Alsatian vs Immigrants from Zaire Family Households
COMPARE
Alsatian
Immigrants from Zaire
Family Households
Family Households Comparison
Alsatians
Immigrants from Zaire
61.7%
FAMILY HOUSEHOLDS
0.0/ 100
METRIC RATING
321st/ 347
METRIC RANK
59.2%
FAMILY HOUSEHOLDS
0.0/ 100
METRIC RATING
345th/ 347
METRIC RANK
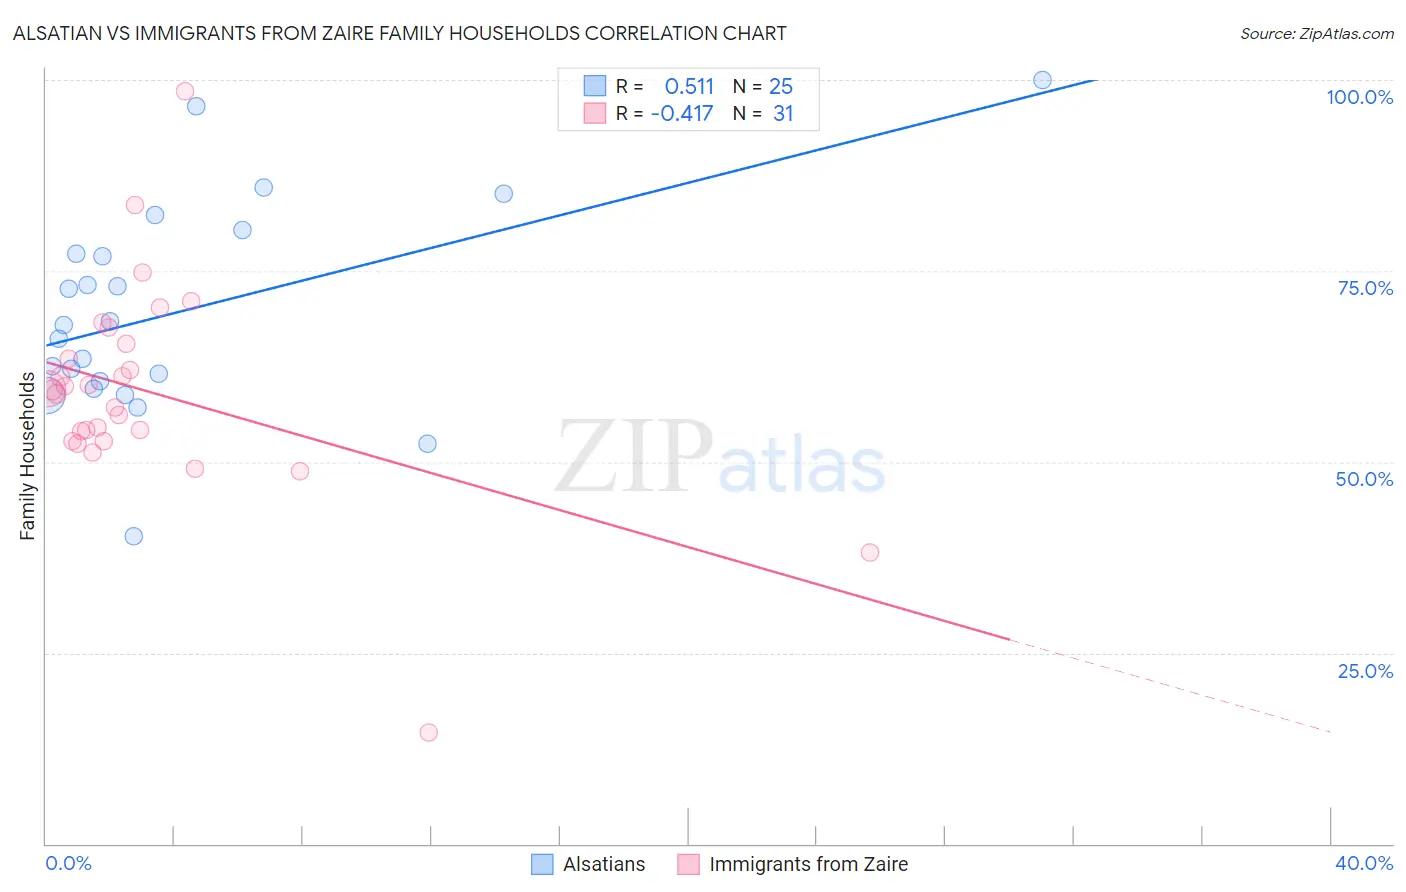
Alsatian vs Immigrants from Zaire Family Households Correlation Chart
The statistical analysis conducted on geographies consisting of 82,680,020 people shows a substantial positive correlation between the proportion of Alsatians and percentage of family households in the United States with a correlation coefficient (R) of 0.511 and weighted average of 61.7%. Similarly, the statistical analysis conducted on geographies consisting of 107,246,225 people shows a moderate negative correlation between the proportion of Immigrants from Zaire and percentage of family households in the United States with a correlation coefficient (R) of -0.417 and weighted average of 59.2%, a difference of 4.3%.
Family Households Correlation Summary
| Measurement | Alsatian | Immigrants from Zaire |
| Minimum | 40.3% | 14.5% |
| Maximum | 100.0% | 98.6% |
| Range | 59.7% | 84.1% |
| Mean | 69.7% | 59.2% |
| Median | 67.9% | 59.4% |
| Interquartile 25% (IQ1) | 60.0% | 52.7% |
| Interquartile 75% (IQ3) | 78.8% | 65.5% |
| Interquartile Range (IQR) | 18.7% | 12.8% |
| Standard Deviation (Sample) | 13.7% | 14.0% |
| Standard Deviation (Population) | 13.5% | 13.7% |
Similar Demographics by Family Households
Demographics Similar to Alsatians by Family Households
In terms of family households, the demographic groups most similar to Alsatians are Ugandan (61.7%, a difference of 0.050%), Immigrants from Serbia (61.6%, a difference of 0.090%), Tlingit-Haida (61.6%, a difference of 0.10%), Immigrants from West Indies (61.6%, a difference of 0.10%), and Immigrants from Switzerland (61.6%, a difference of 0.11%).
| Demographics | Rating | Rank | Family Households |
| Immigrants | Cabo Verde | 0.0 /100 | #314 | Tragic 61.9% |
| Moroccans | 0.0 /100 | #315 | Tragic 61.9% |
| Immigrants | Middle Africa | 0.0 /100 | #316 | Tragic 61.9% |
| Immigrants | Bosnia and Herzegovina | 0.0 /100 | #317 | Tragic 61.9% |
| Alaskan Athabascans | 0.0 /100 | #318 | Tragic 61.8% |
| Cape Verdeans | 0.0 /100 | #319 | Tragic 61.8% |
| Ugandans | 0.0 /100 | #320 | Tragic 61.7% |
| Alsatians | 0.0 /100 | #321 | Tragic 61.7% |
| Immigrants | Serbia | 0.0 /100 | #322 | Tragic 61.6% |
| Tlingit-Haida | 0.0 /100 | #323 | Tragic 61.6% |
| Immigrants | West Indies | 0.0 /100 | #324 | Tragic 61.6% |
| Immigrants | Switzerland | 0.0 /100 | #325 | Tragic 61.6% |
| Indonesians | 0.0 /100 | #326 | Tragic 61.5% |
| Blacks/African Americans | 0.0 /100 | #327 | Tragic 61.5% |
| Kiowa | 0.0 /100 | #328 | Tragic 61.4% |
Demographics Similar to Immigrants from Zaire by Family Households
In terms of family households, the demographic groups most similar to Immigrants from Zaire are Immigrants from Congo (59.2%, a difference of 0.14%), Senegalese (59.8%, a difference of 1.1%), Sudanese (60.0%, a difference of 1.4%), Immigrants from Senegal (60.1%, a difference of 1.6%), and Immigrants from Sudan (60.2%, a difference of 1.7%).
| Demographics | Rating | Rank | Family Households |
| Immigrants | Ethiopia | 0.0 /100 | #333 | Tragic 61.2% |
| Immigrants | Eastern Africa | 0.0 /100 | #334 | Tragic 61.1% |
| Carpatho Rusyns | 0.0 /100 | #335 | Tragic 61.1% |
| German Russians | 0.0 /100 | #336 | Tragic 60.9% |
| Soviet Union | 0.0 /100 | #337 | Tragic 60.9% |
| Immigrants | Eritrea | 0.0 /100 | #338 | Tragic 60.8% |
| Immigrants | Saudi Arabia | 0.0 /100 | #339 | Tragic 60.7% |
| Immigrants | Sudan | 0.0 /100 | #340 | Tragic 60.2% |
| Immigrants | Senegal | 0.0 /100 | #341 | Tragic 60.1% |
| Sudanese | 0.0 /100 | #342 | Tragic 60.0% |
| Senegalese | 0.0 /100 | #343 | Tragic 59.8% |
| Immigrants | Congo | 0.0 /100 | #344 | Tragic 59.2% |
| Immigrants | Zaire | 0.0 /100 | #345 | Tragic 59.2% |
| Somalis | 0.0 /100 | #346 | Tragic 57.6% |
| Immigrants | Somalia | 0.0 /100 | #347 | Tragic 56.7% |