Alsatian vs Immigrants from Vietnam Per Capita Income
COMPARE
Alsatian
Immigrants from Vietnam
Per Capita Income
Per Capita Income Comparison
Alsatians
Immigrants from Vietnam
$47,284
PER CAPITA INCOME
98.3/ 100
METRIC RATING
96th/ 347
METRIC RANK
$43,229
PER CAPITA INCOME
38.1/ 100
METRIC RATING
182nd/ 347
METRIC RANK
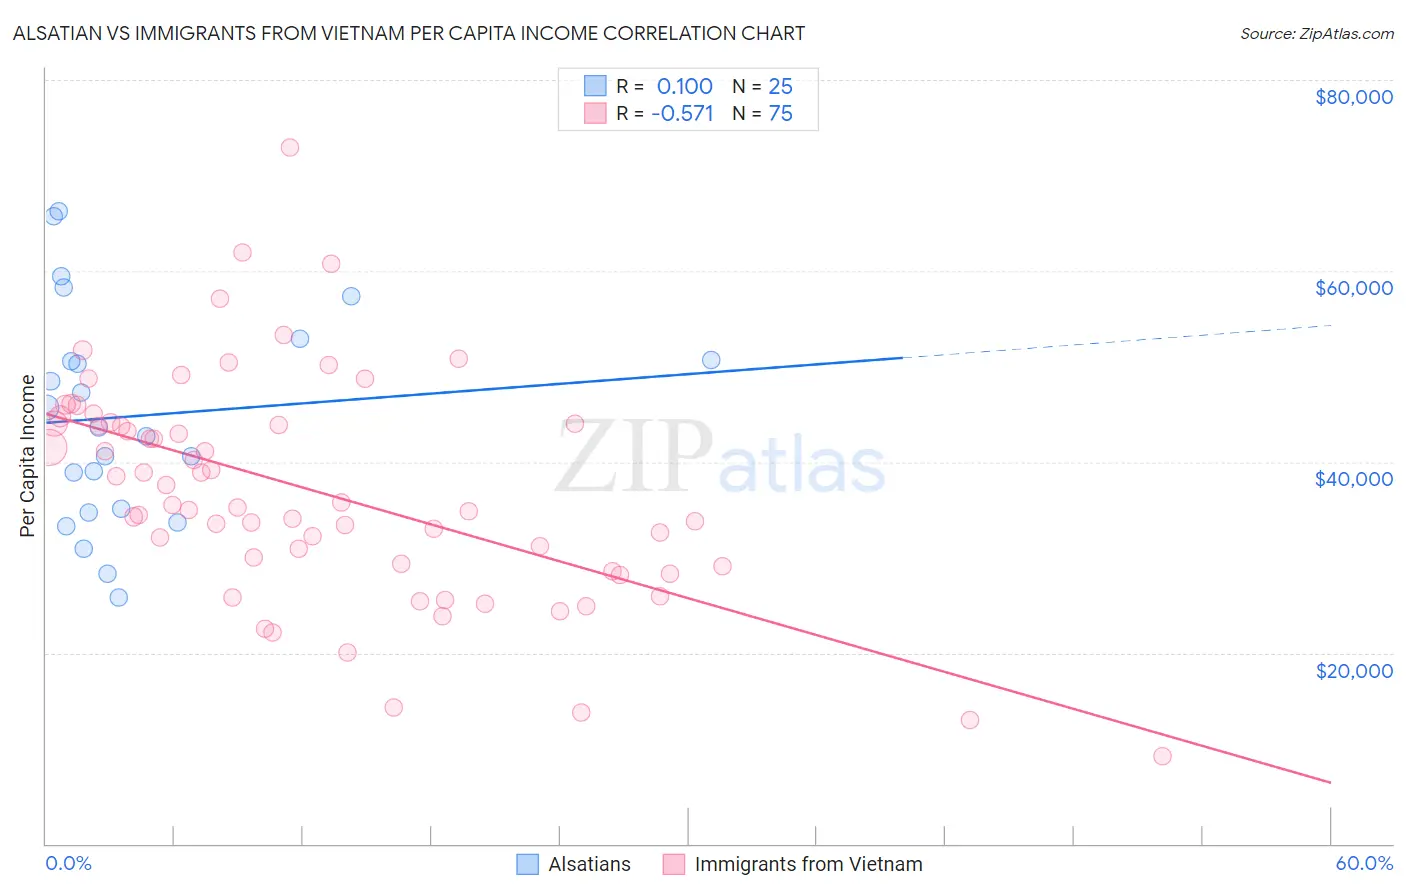
Alsatian vs Immigrants from Vietnam Per Capita Income Correlation Chart
The statistical analysis conducted on geographies consisting of 82,682,365 people shows a slight positive correlation between the proportion of Alsatians and per capita income in the United States with a correlation coefficient (R) of 0.100 and weighted average of $47,284. Similarly, the statistical analysis conducted on geographies consisting of 404,854,816 people shows a substantial negative correlation between the proportion of Immigrants from Vietnam and per capita income in the United States with a correlation coefficient (R) of -0.571 and weighted average of $43,229, a difference of 9.4%.
Per Capita Income Correlation Summary
| Measurement | Alsatian | Immigrants from Vietnam |
| Minimum | $25,853 | $9,224 |
| Maximum | $66,221 | $72,882 |
| Range | $40,368 | $63,658 |
| Mean | $44,810 | $36,916 |
| Median | $43,610 | $35,508 |
| Interquartile 25% (IQ1) | $34,894 | $29,060 |
| Interquartile 75% (IQ3) | $51,799 | $44,032 |
| Interquartile Range (IQR) | $16,905 | $14,972 |
| Standard Deviation (Sample) | $11,224 | $11,678 |
| Standard Deviation (Population) | $10,998 | $11,600 |
Similar Demographics by Per Capita Income
Demographics Similar to Alsatians by Per Capita Income
In terms of per capita income, the demographic groups most similar to Alsatians are Carpatho Rusyn ($47,248, a difference of 0.080%), Immigrants from Egypt ($47,361, a difference of 0.16%), Albanian ($47,379, a difference of 0.20%), Immigrants from Zimbabwe ($47,394, a difference of 0.23%), and Immigrants from Moldova ($47,489, a difference of 0.43%).
| Demographics | Rating | Rank | Per Capita Income |
| Northern Europeans | 98.9 /100 | #89 | Exceptional $47,698 |
| Italians | 98.8 /100 | #90 | Exceptional $47,574 |
| Macedonians | 98.8 /100 | #91 | Exceptional $47,573 |
| Immigrants | Moldova | 98.7 /100 | #92 | Exceptional $47,489 |
| Immigrants | Zimbabwe | 98.5 /100 | #93 | Exceptional $47,394 |
| Albanians | 98.5 /100 | #94 | Exceptional $47,379 |
| Immigrants | Egypt | 98.5 /100 | #95 | Exceptional $47,361 |
| Alsatians | 98.3 /100 | #96 | Exceptional $47,284 |
| Carpatho Rusyns | 98.2 /100 | #97 | Exceptional $47,248 |
| Immigrants | Pakistan | 97.9 /100 | #98 | Exceptional $47,084 |
| Laotians | 97.8 /100 | #99 | Exceptional $47,041 |
| Immigrants | Lebanon | 97.5 /100 | #100 | Exceptional $46,938 |
| Immigrants | Uzbekistan | 97.5 /100 | #101 | Exceptional $46,929 |
| Immigrants | Western Asia | 97.4 /100 | #102 | Exceptional $46,876 |
| Syrians | 97.2 /100 | #103 | Exceptional $46,837 |
Demographics Similar to Immigrants from Vietnam by Per Capita Income
In terms of per capita income, the demographic groups most similar to Immigrants from Vietnam are Welsh ($43,233, a difference of 0.010%), German ($43,067, a difference of 0.38%), Sierra Leonean ($43,405, a difference of 0.41%), Spaniard ($43,028, a difference of 0.47%), and Immigrants ($43,010, a difference of 0.51%).
| Demographics | Rating | Rank | Per Capita Income |
| Celtics | 48.9 /100 | #175 | Average $43,621 |
| Immigrants | South Eastern Asia | 46.6 /100 | #176 | Average $43,539 |
| Tlingit-Haida | 45.9 /100 | #177 | Average $43,516 |
| Immigrants | Costa Rica | 44.5 /100 | #178 | Average $43,464 |
| Finns | 44.4 /100 | #179 | Average $43,461 |
| Sierra Leoneans | 42.9 /100 | #180 | Average $43,405 |
| Welsh | 38.2 /100 | #181 | Fair $43,233 |
| Immigrants | Vietnam | 38.1 /100 | #182 | Fair $43,229 |
| Germans | 33.9 /100 | #183 | Fair $43,067 |
| Spaniards | 32.9 /100 | #184 | Fair $43,028 |
| Immigrants | Immigrants | 32.5 /100 | #185 | Fair $43,010 |
| French Canadians | 32.3 /100 | #186 | Fair $43,003 |
| Immigrants | Colombia | 31.5 /100 | #187 | Fair $42,971 |
| Immigrants | Africa | 31.0 /100 | #188 | Fair $42,950 |
| Bermudans | 30.1 /100 | #189 | Fair $42,911 |