Armenian vs Immigrants from Zaire Per Capita Income
COMPARE
Armenian
Immigrants from Zaire
Per Capita Income
Per Capita Income Comparison
Armenians
Immigrants from Zaire
$48,287
PER CAPITA INCOME
99.4/ 100
METRIC RATING
81st/ 347
METRIC RANK
$38,848
PER CAPITA INCOME
0.4/ 100
METRIC RATING
267th/ 347
METRIC RANK
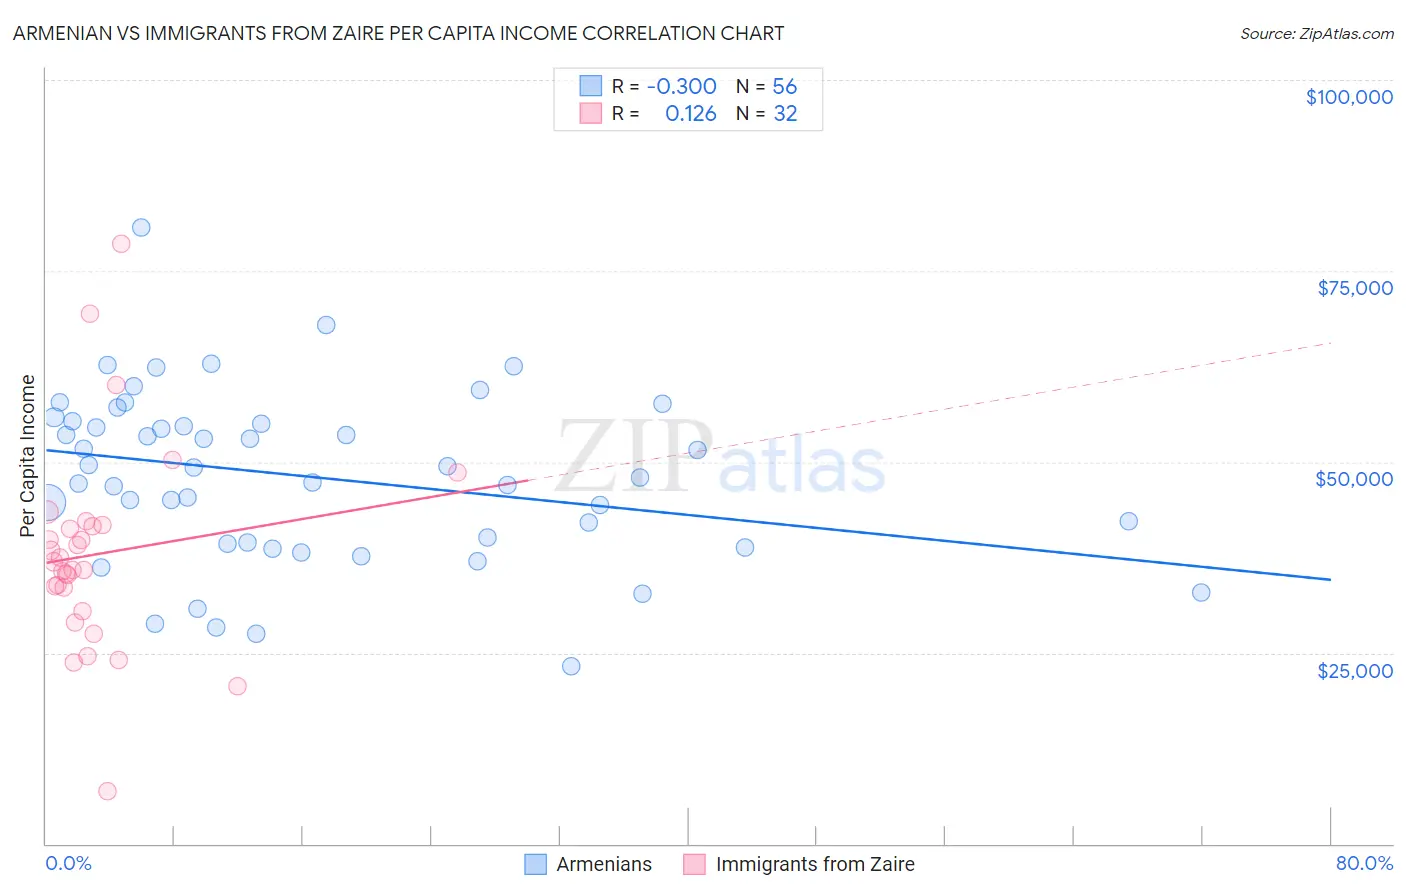
Armenian vs Immigrants from Zaire Per Capita Income Correlation Chart
The statistical analysis conducted on geographies consisting of 310,965,464 people shows a mild negative correlation between the proportion of Armenians and per capita income in the United States with a correlation coefficient (R) of -0.300 and weighted average of $48,287. Similarly, the statistical analysis conducted on geographies consisting of 107,255,805 people shows a poor positive correlation between the proportion of Immigrants from Zaire and per capita income in the United States with a correlation coefficient (R) of 0.126 and weighted average of $38,848, a difference of 24.3%.
Per Capita Income Correlation Summary
| Measurement | Armenian | Immigrants from Zaire |
| Minimum | $23,281 | $6,803 |
| Maximum | $80,691 | $78,629 |
| Range | $57,410 | $71,826 |
| Mean | $48,045 | $37,941 |
| Median | $48,616 | $36,388 |
| Interquartile 25% (IQ1) | $39,345 | $32,029 |
| Interquartile 75% (IQ3) | $55,100 | $41,659 |
| Interquartile Range (IQR) | $15,755 | $9,630 |
| Standard Deviation (Sample) | $11,238 | $13,517 |
| Standard Deviation (Population) | $11,138 | $13,304 |
Similar Demographics by Per Capita Income
Demographics Similar to Armenians by Per Capita Income
In terms of per capita income, the demographic groups most similar to Armenians are Egyptian ($48,358, a difference of 0.15%), Immigrants from Indonesia ($48,195, a difference of 0.19%), Immigrants from Brazil ($48,164, a difference of 0.26%), Immigrants from Ukraine ($48,134, a difference of 0.32%), and Romanian ($48,445, a difference of 0.33%).
| Demographics | Rating | Rank | Per Capita Income |
| Mongolians | 99.8 /100 | #74 | Exceptional $49,173 |
| Immigrants | Bolivia | 99.7 /100 | #75 | Exceptional $48,970 |
| Immigrants | England | 99.7 /100 | #76 | Exceptional $48,844 |
| Immigrants | Kazakhstan | 99.7 /100 | #77 | Exceptional $48,747 |
| Immigrants | Italy | 99.6 /100 | #78 | Exceptional $48,654 |
| Romanians | 99.5 /100 | #79 | Exceptional $48,445 |
| Egyptians | 99.5 /100 | #80 | Exceptional $48,358 |
| Armenians | 99.4 /100 | #81 | Exceptional $48,287 |
| Immigrants | Indonesia | 99.4 /100 | #82 | Exceptional $48,195 |
| Immigrants | Brazil | 99.4 /100 | #83 | Exceptional $48,164 |
| Immigrants | Ukraine | 99.3 /100 | #84 | Exceptional $48,134 |
| Austrians | 99.3 /100 | #85 | Exceptional $48,116 |
| Immigrants | Southern Europe | 99.3 /100 | #86 | Exceptional $48,027 |
| Ukrainians | 99.3 /100 | #87 | Exceptional $48,014 |
| Croatians | 99.0 /100 | #88 | Exceptional $47,742 |
Demographics Similar to Immigrants from Zaire by Per Capita Income
In terms of per capita income, the demographic groups most similar to Immigrants from Zaire are Salvadoran ($38,858, a difference of 0.030%), Liberian ($38,780, a difference of 0.17%), Immigrants from Jamaica ($38,766, a difference of 0.21%), Spanish American ($39,012, a difference of 0.42%), and American ($39,039, a difference of 0.49%).
| Demographics | Rating | Rank | Per Capita Income |
| Alaskan Athabascans | 0.6 /100 | #260 | Tragic $39,163 |
| Marshallese | 0.6 /100 | #261 | Tragic $39,108 |
| Iroquois | 0.6 /100 | #262 | Tragic $39,104 |
| Belizeans | 0.6 /100 | #263 | Tragic $39,097 |
| Americans | 0.6 /100 | #264 | Tragic $39,039 |
| Spanish Americans | 0.5 /100 | #265 | Tragic $39,012 |
| Salvadorans | 0.5 /100 | #266 | Tragic $38,858 |
| Immigrants | Zaire | 0.4 /100 | #267 | Tragic $38,848 |
| Liberians | 0.4 /100 | #268 | Tragic $38,780 |
| Immigrants | Jamaica | 0.4 /100 | #269 | Tragic $38,766 |
| Immigrants | Belize | 0.3 /100 | #270 | Tragic $38,614 |
| Central Americans | 0.3 /100 | #271 | Tragic $38,560 |
| Immigrants | Cabo Verde | 0.3 /100 | #272 | Tragic $38,540 |
| Nepalese | 0.3 /100 | #273 | Tragic $38,442 |
| Immigrants | El Salvador | 0.3 /100 | #274 | Tragic $38,394 |