Zip Codes with the Highest Percentage of Population Employed in Security & Protection in Waukegan, IL
RELATED REPORTS & OPTIONS
Security & Protection
Waukegan
Compare Zip Codes
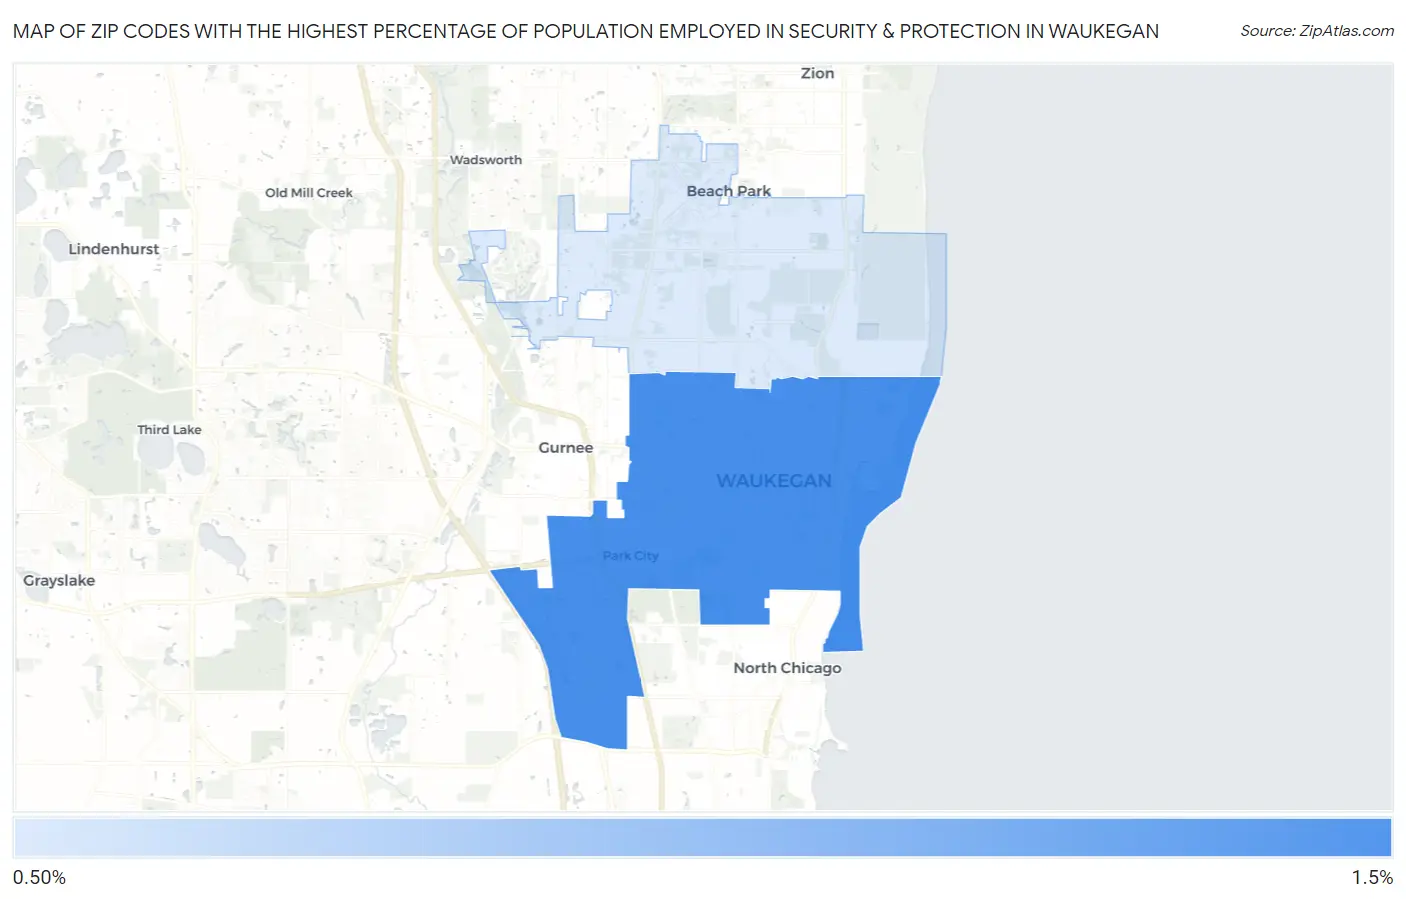
Map of Zip Codes with the Highest Percentage of Population Employed in Security & Protection in Waukegan
1.2%
1.3%
Zip Codes with the Highest Percentage of Population Employed in Security & Protection in Waukegan, IL
| Zip Code | % Employed | vs State | vs National | |
| 1. | 60085 | 1.3% | 2.2%(-0.881)#777 | 2.1%(-0.837)#17,644 |
| 2. | 60087 | 1.2% | 2.2%(-0.990)#814 | 2.1%(-0.947)#18,493 |
1
Common Questions
What are the Top Zip Codes with the Highest Percentage of Population Employed in Security & Protection in Waukegan, IL?
Top Zip Codes with the Highest Percentage of Population Employed in Security & Protection in Waukegan, IL are:
What zip code has the Highest Percentage of Population Employed in Security & Protection in Waukegan, IL?
60085 has the Highest Percentage of Population Employed in Security & Protection in Waukegan, IL with 1.3%.
What is the Percentage of Population Employed in Security & Protection in Waukegan, IL?
Percentage of Population Employed in Security & Protection in Waukegan is 1.7%.
What is the Percentage of Population Employed in Security & Protection in Illinois?
Percentage of Population Employed in Security & Protection in Illinois is 2.2%.
What is the Percentage of Population Employed in Security & Protection in the United States?
Percentage of Population Employed in Security & Protection in the United States is 2.1%.