Zip Codes with the Highest Percentage of Population Employed in Security & Protection in Crystal Lake, IL
RELATED REPORTS & OPTIONS
Security & Protection
Crystal Lake
Compare Zip Codes
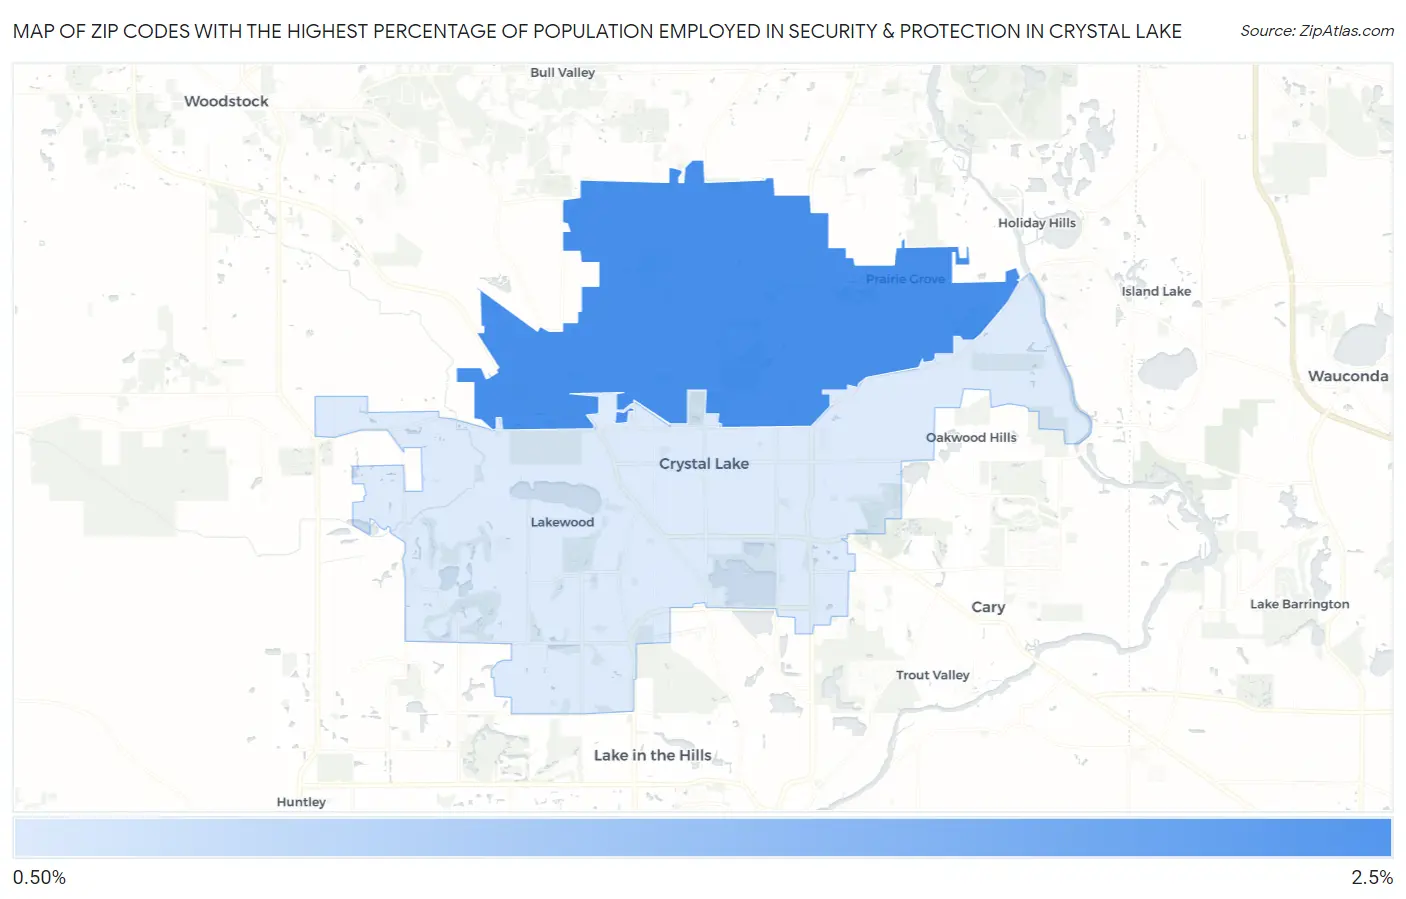
Map of Zip Codes with the Highest Percentage of Population Employed in Security & Protection in Crystal Lake
1.3%
2.2%
Zip Codes with the Highest Percentage of Population Employed in Security & Protection in Crystal Lake, IL
| Zip Code | % Employed | vs State | vs National | |
| 1. | 60012 | 2.2% | 2.2%(+0.047)#472 | 2.1%(+0.090)#11,019 |
| 2. | 60014 | 1.3% | 2.2%(-0.844)#764 | 2.1%(-0.801)#17,362 |
1
Common Questions
What are the Top Zip Codes with the Highest Percentage of Population Employed in Security & Protection in Crystal Lake, IL?
Top Zip Codes with the Highest Percentage of Population Employed in Security & Protection in Crystal Lake, IL are:
What zip code has the Highest Percentage of Population Employed in Security & Protection in Crystal Lake, IL?
60012 has the Highest Percentage of Population Employed in Security & Protection in Crystal Lake, IL with 2.2%.
What is the Percentage of Population Employed in Security & Protection in Crystal Lake, IL?
Percentage of Population Employed in Security & Protection in Crystal Lake is 1.8%.
What is the Percentage of Population Employed in Security & Protection in Illinois?
Percentage of Population Employed in Security & Protection in Illinois is 2.2%.
What is the Percentage of Population Employed in Security & Protection in the United States?
Percentage of Population Employed in Security & Protection in the United States is 2.1%.