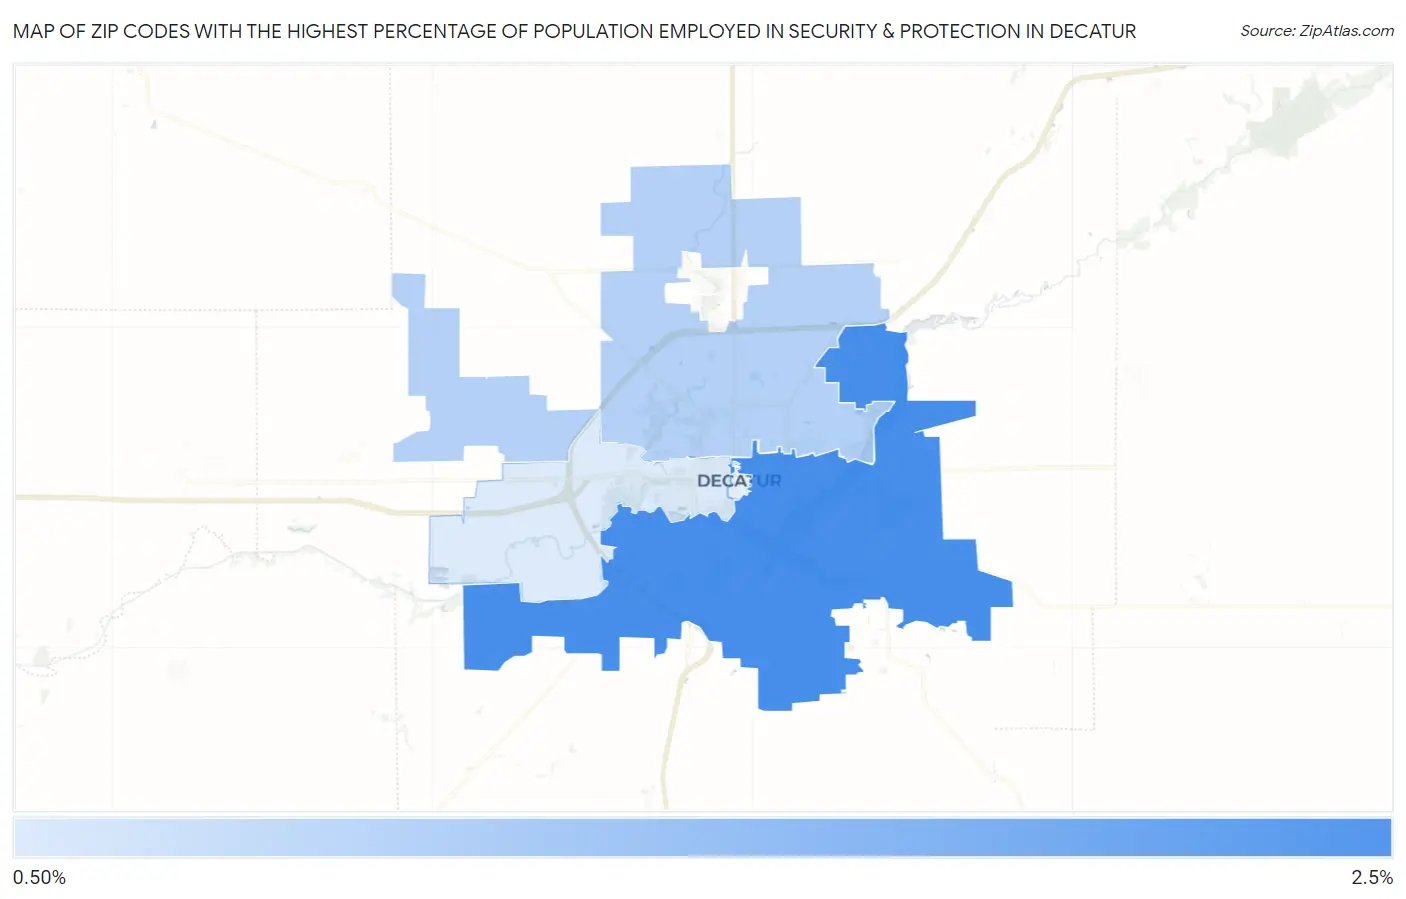
Zip Codes with the Highest Percentage of Population Employed in Security & Protection in Decatur, IL
RELATED REPORTS & OPTIONS
Security & Protection
Decatur
Compare Zip Codes
Map of Zip Codes with the Highest Percentage of Population Employed in Security & Protection in Decatur
1.3%
2.1%
Zip Codes with the Highest Percentage of Population Employed in Security & Protection in Decatur, IL
| Zip Code | % Employed | vs State | vs National | |
| 1. | 62521 | 2.1% | 2.2%(-0.062)#506 | 2.1%(-0.019)#11,700 |
| 2. | 62526 | 1.5% | 2.2%(-0.666)#688 | 2.1%(-0.623)#15,985 |
| 3. | 62522 | 1.3% | 2.2%(-0.901)#781 | 2.1%(-0.857)#17,818 |
1
Common Questions
What are the Top 3 Zip Codes with the Highest Percentage of Population Employed in Security & Protection in Decatur, IL?
Top 3 Zip Codes with the Highest Percentage of Population Employed in Security & Protection in Decatur, IL are:
What zip code has the Highest Percentage of Population Employed in Security & Protection in Decatur, IL?
62521 has the Highest Percentage of Population Employed in Security & Protection in Decatur, IL with 2.1%.
What is the Percentage of Population Employed in Security & Protection in Decatur, IL?
Percentage of Population Employed in Security & Protection in Decatur is 1.7%.
What is the Percentage of Population Employed in Security & Protection in Illinois?
Percentage of Population Employed in Security & Protection in Illinois is 2.2%.
What is the Percentage of Population Employed in Security & Protection in the United States?
Percentage of Population Employed in Security & Protection in the United States is 2.1%.