Zip Codes with the Highest Percentage of Households with Income Above $200,000 in Tifton, GA
RELATED REPORTS & OPTIONS
Household Income | $200k+
Tifton
Compare Zip Codes
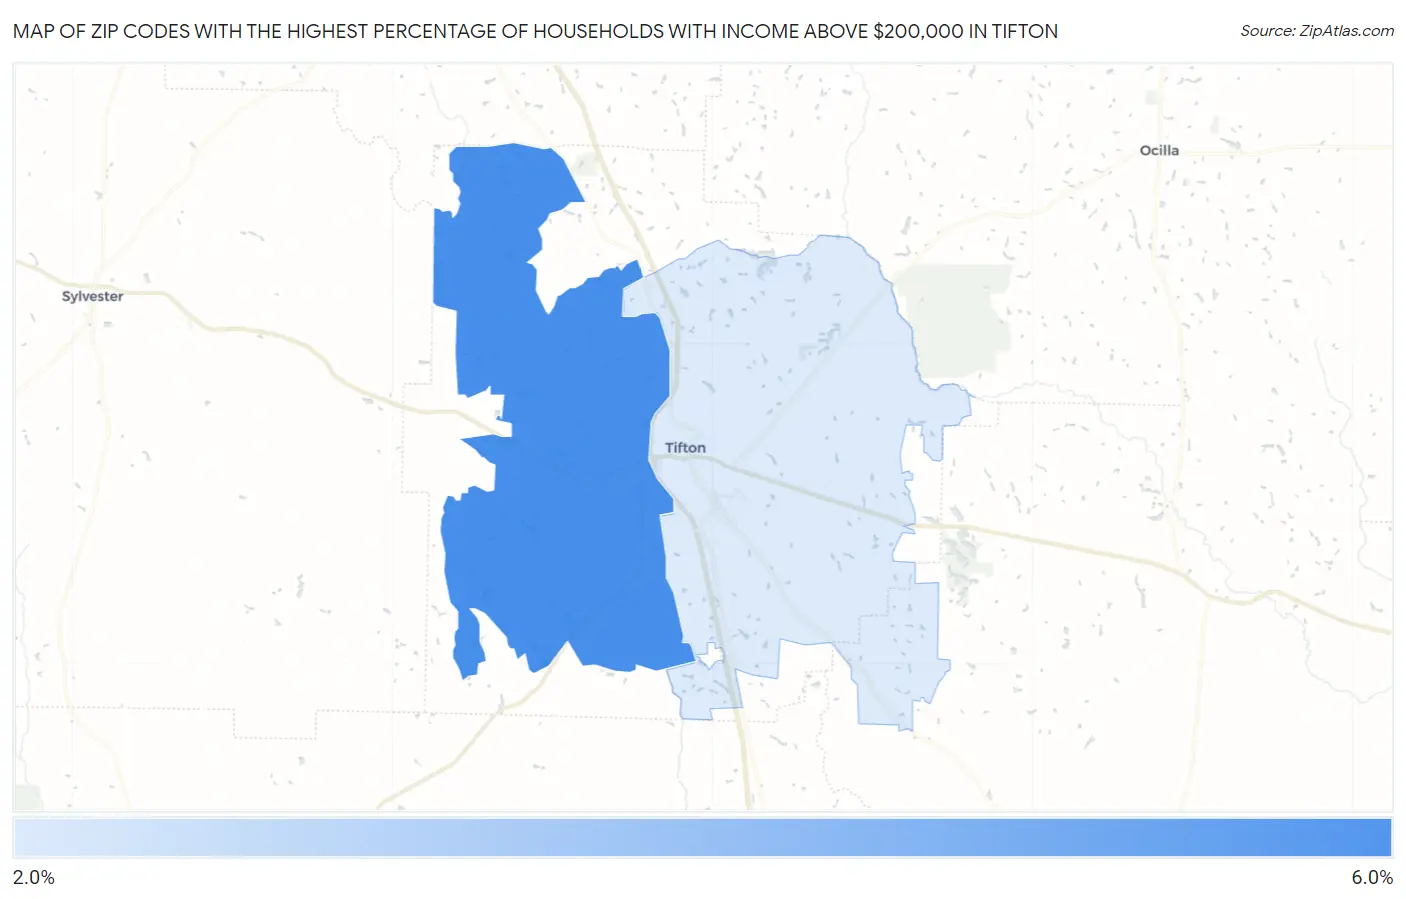
Map of Zip Codes with the Highest Percentage of Households with Income Above $200,000 in Tifton
2.5%
5.4%
Zip Codes with the Highest Percentage of Households with Income Above $200,000 in Tifton, GA
| Zip Code | Households with Income > $200k | vs State | vs National | |
| 1. | 31793 | 5.4% | 10.0%(-4.60)#286 | 11.4%(-6.00)#14,717 |
| 2. | 31794 | 2.5% | 10.0%(-7.50)#479 | 11.4%(-8.90)#22,334 |
1
Common Questions
What are the Top Zip Codes with the Highest Percentage of Households with Income Above $200,000 in Tifton, GA?
Top Zip Codes with the Highest Percentage of Households with Income Above $200,000 in Tifton, GA are:
What zip code has the Highest Percentage of Households with Income Above $200,000 in Tifton, GA?
31793 has the Highest Percentage of Households with Income Above $200,000 in Tifton, GA with 5.4%.
What is the Percentage of Households with Income Above $200,000 in Tifton, GA?
Percentage of Households with Income Above $200,000 in Tifton is 1.2%.
What is the Percentage of Households with Income Above $200,000 in Georgia?
Percentage of Households with Income Above $200,000 in Georgia is 10.0%.
What is the Percentage of Households with Income Above $200,000 in the United States?
Percentage of Households with Income Above $200,000 in the United States is 11.4%.