Zip Codes with the Highest Percentage of Population Employed in Office & Administration in Snellville, GA
RELATED REPORTS & OPTIONS
Office & Administration
Snellville
Compare Zip Codes
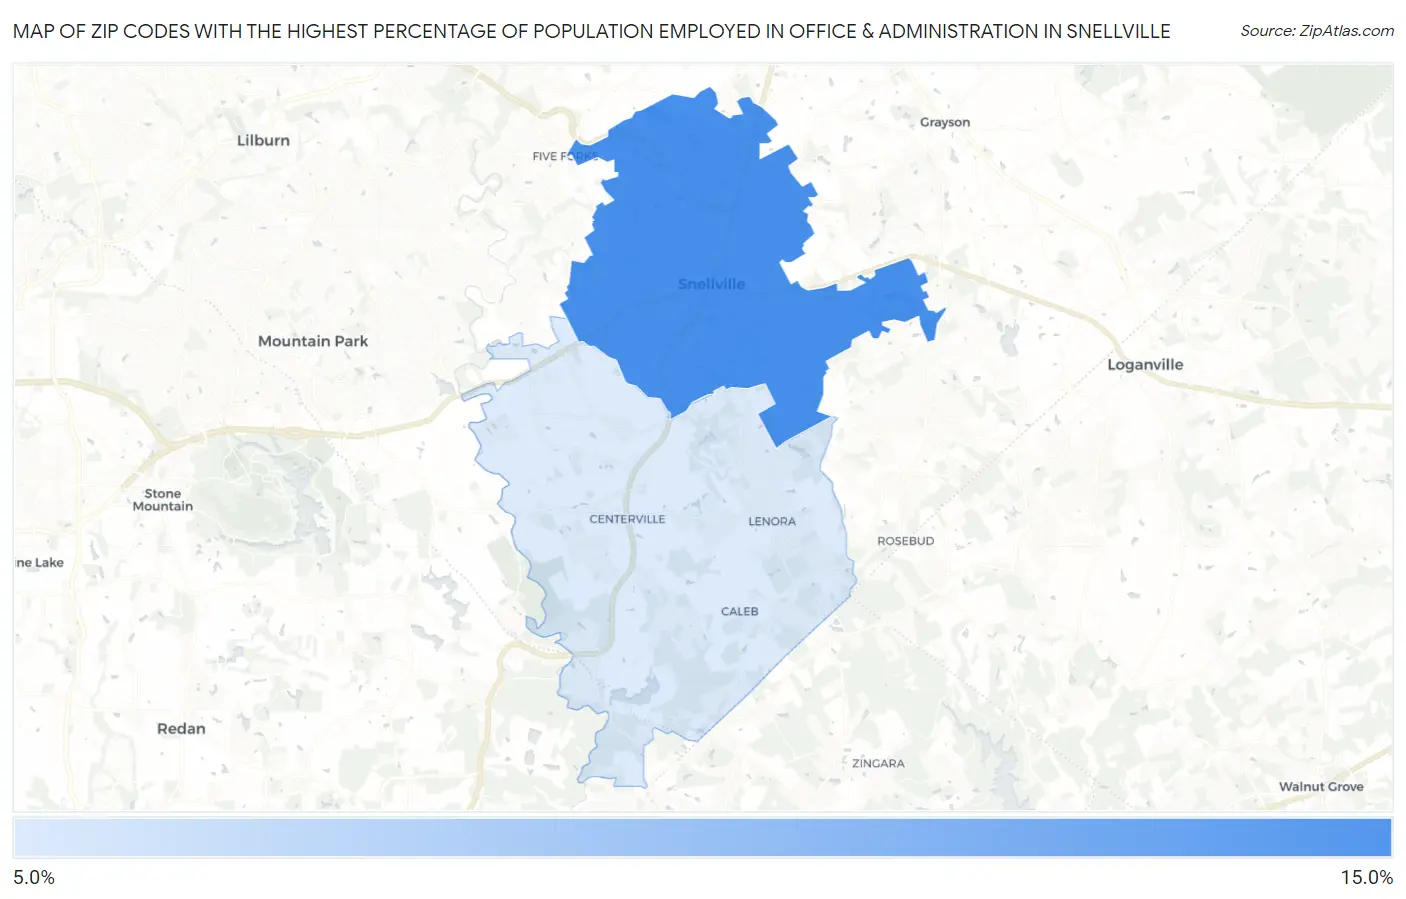
Map of Zip Codes with the Highest Percentage of Population Employed in Office & Administration in Snellville
12.0%
14.1%
Zip Codes with the Highest Percentage of Population Employed in Office & Administration in Snellville, GA
| Zip Code | % Employed | vs State | vs National | |
| 1. | 30078 | 14.1% | 11.1%(+3.04)#147 | 10.9%(+3.26)#5,836 |
| 2. | 30039 | 12.0% | 11.1%(+0.946)#270 | 10.9%(+1.17)#10,636 |
1
Common Questions
What are the Top Zip Codes with the Highest Percentage of Population Employed in Office & Administration in Snellville, GA?
Top Zip Codes with the Highest Percentage of Population Employed in Office & Administration in Snellville, GA are:
What zip code has the Highest Percentage of Population Employed in Office & Administration in Snellville, GA?
30078 has the Highest Percentage of Population Employed in Office & Administration in Snellville, GA with 14.1%.
What is the Percentage of Population Employed in Office & Administration in Snellville, GA?
Percentage of Population Employed in Office & Administration in Snellville is 14.0%.
What is the Percentage of Population Employed in Office & Administration in Georgia?
Percentage of Population Employed in Office & Administration in Georgia is 11.1%.
What is the Percentage of Population Employed in Office & Administration in the United States?
Percentage of Population Employed in Office & Administration in the United States is 10.9%.