Zip Codes with the Highest Percentage of Population with a Degree in Liberal Arts and History in Snellville, GA
RELATED REPORTS & OPTIONS
Liberal Arts and History
Snellville
Compare Zip Codes
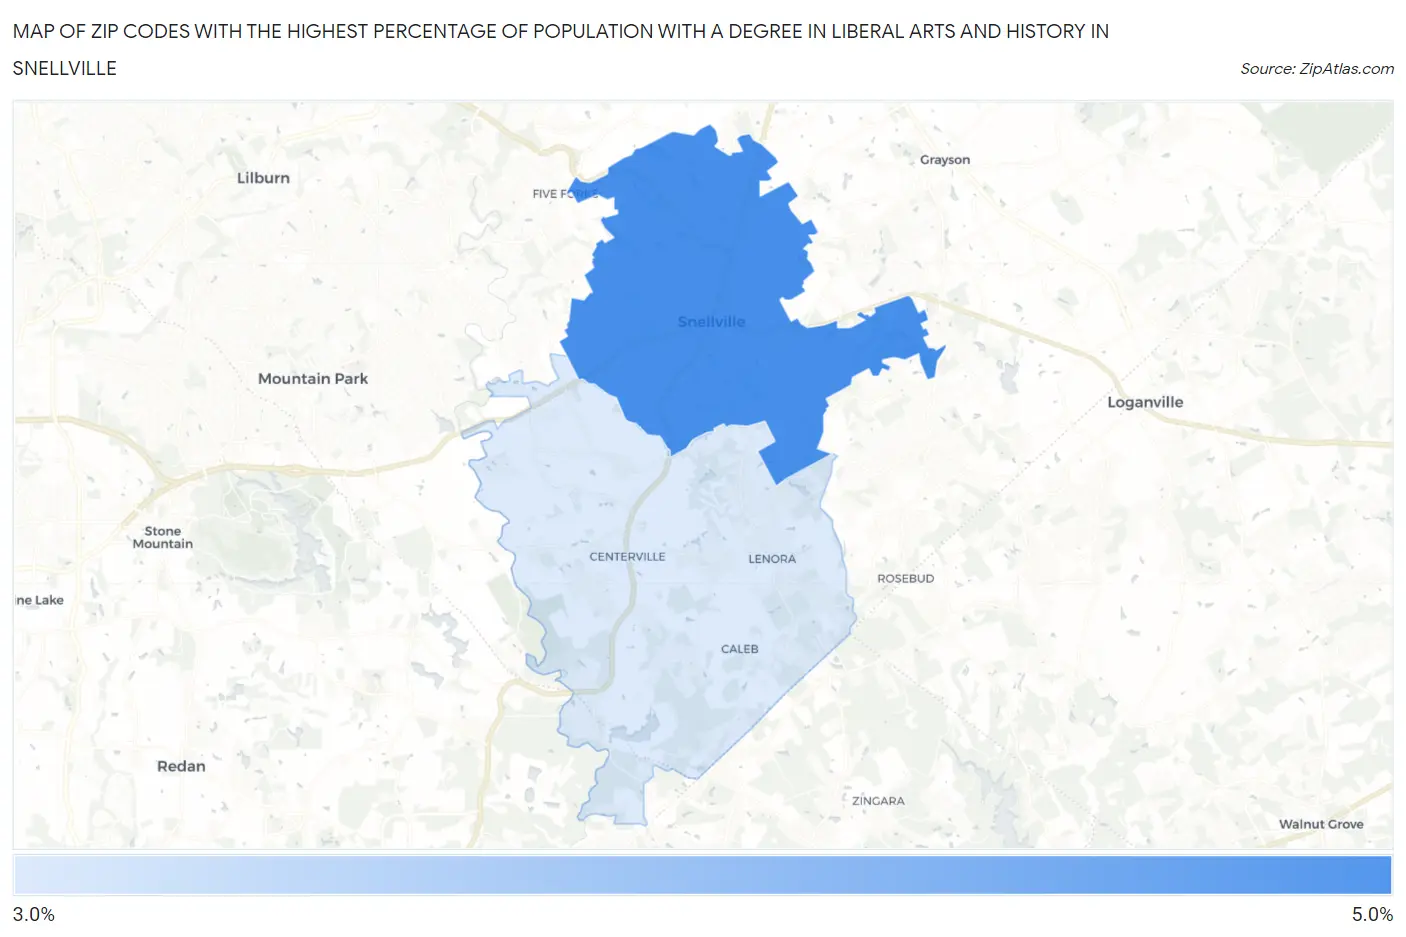
Map of Zip Codes with the Highest Percentage of Population with a Degree in Liberal Arts and History in Snellville
3.0%
4.6%
Zip Codes with the Highest Percentage of Population with a Degree in Liberal Arts and History in Snellville, GA
| Zip Code | % Graduates | vs State | vs National | |
| 1. | 30078 | 4.6% | 4.1%(+0.473)#255 | 4.9%(-0.273)#12,649 |
| 2. | 30039 | 3.0% | 4.1%(-1.10)#418 | 4.9%(-1.84)#18,259 |
1
Common Questions
What are the Top Zip Codes with the Highest Percentage of Population with a Degree in Liberal Arts and History in Snellville, GA?
Top Zip Codes with the Highest Percentage of Population with a Degree in Liberal Arts and History in Snellville, GA are:
What zip code has the Highest Percentage of Population with a Degree in Liberal Arts and History in Snellville, GA?
30078 has the Highest Percentage of Population with a Degree in Liberal Arts and History in Snellville, GA with 4.6%.
What is the Percentage of Population with a Degree in Liberal Arts and History in Snellville, GA?
Percentage of Population with a Degree in Liberal Arts and History in Snellville is 2.7%.
What is the Percentage of Population with a Degree in Liberal Arts and History in Georgia?
Percentage of Population with a Degree in Liberal Arts and History in Georgia is 4.1%.
What is the Percentage of Population with a Degree in Liberal Arts and History in the United States?
Percentage of Population with a Degree in Liberal Arts and History in the United States is 4.9%.