Zip Codes with the Highest Percentage of Population Employed in Security & Protection in Snellville, GA
RELATED REPORTS & OPTIONS
Security & Protection
Snellville
Compare Zip Codes
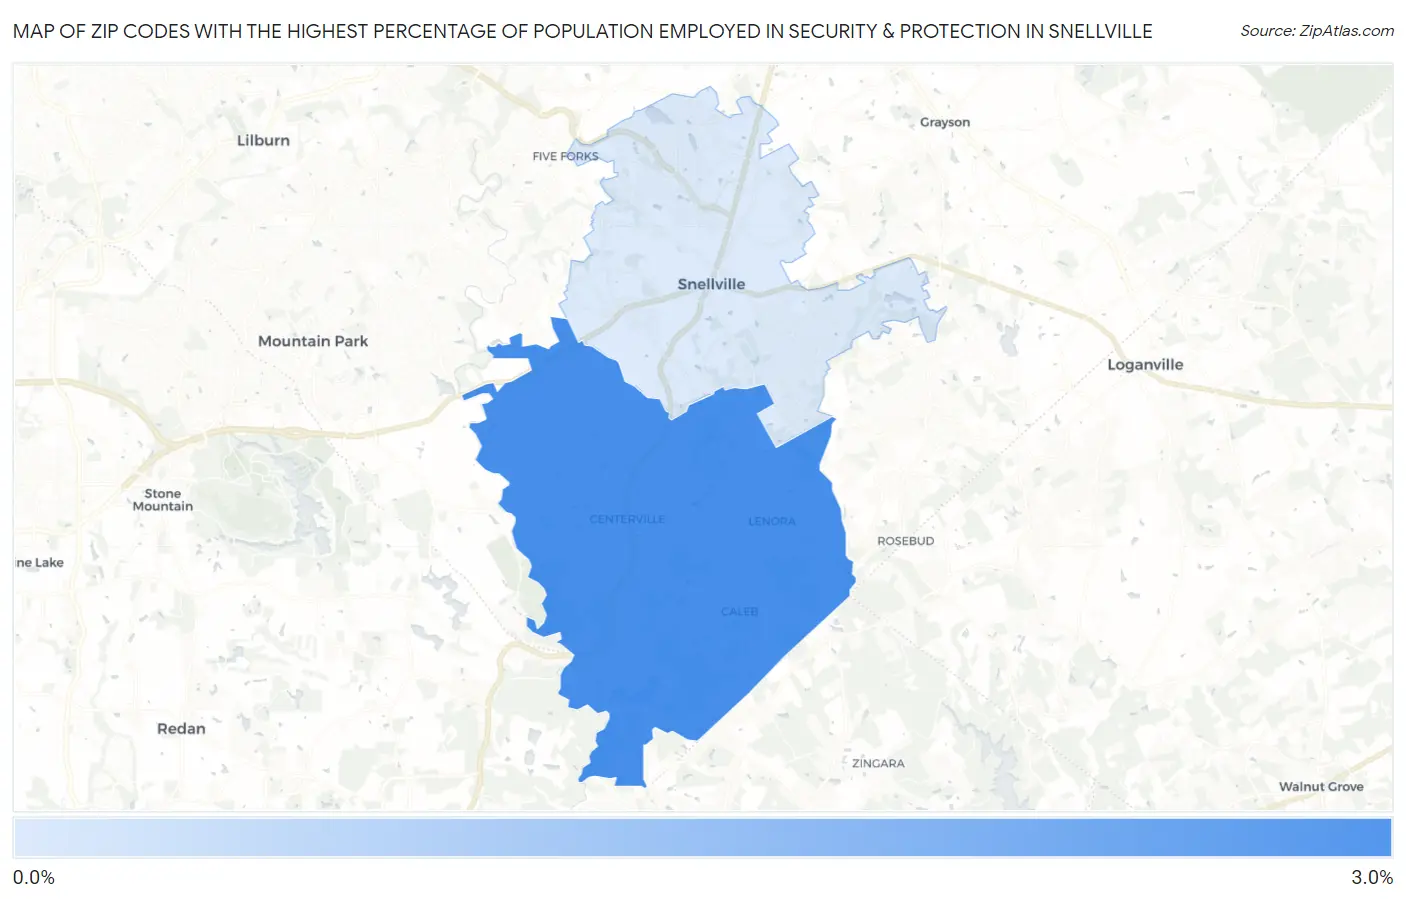
Map of Zip Codes with the Highest Percentage of Population Employed in Security & Protection in Snellville
0.33%
2.6%
Zip Codes with the Highest Percentage of Population Employed in Security & Protection in Snellville, GA
| Zip Code | % Employed | vs State | vs National | |
| 1. | 30039 | 2.6% | 2.2%(+0.396)#270 | 2.1%(+0.420)#9,167 |
| 2. | 30078 | 0.33% | 2.2%(-1.84)#600 | 2.1%(-1.82)#24,065 |
1
Common Questions
What are the Top Zip Codes with the Highest Percentage of Population Employed in Security & Protection in Snellville, GA?
Top Zip Codes with the Highest Percentage of Population Employed in Security & Protection in Snellville, GA are:
What zip code has the Highest Percentage of Population Employed in Security & Protection in Snellville, GA?
30039 has the Highest Percentage of Population Employed in Security & Protection in Snellville, GA with 2.6%.
What is the Percentage of Population Employed in Security & Protection in Snellville, GA?
Percentage of Population Employed in Security & Protection in Snellville is 0.36%.
What is the Percentage of Population Employed in Security & Protection in Georgia?
Percentage of Population Employed in Security & Protection in Georgia is 2.2%.
What is the Percentage of Population Employed in Security & Protection in the United States?
Percentage of Population Employed in Security & Protection in the United States is 2.1%.