Zip Codes with the Highest Percentage of Population Employed in Health Diagnosing & Treating in Newnan, GA
RELATED REPORTS & OPTIONS
Health Diagnosing & Treating
Newnan
Compare Zip Codes
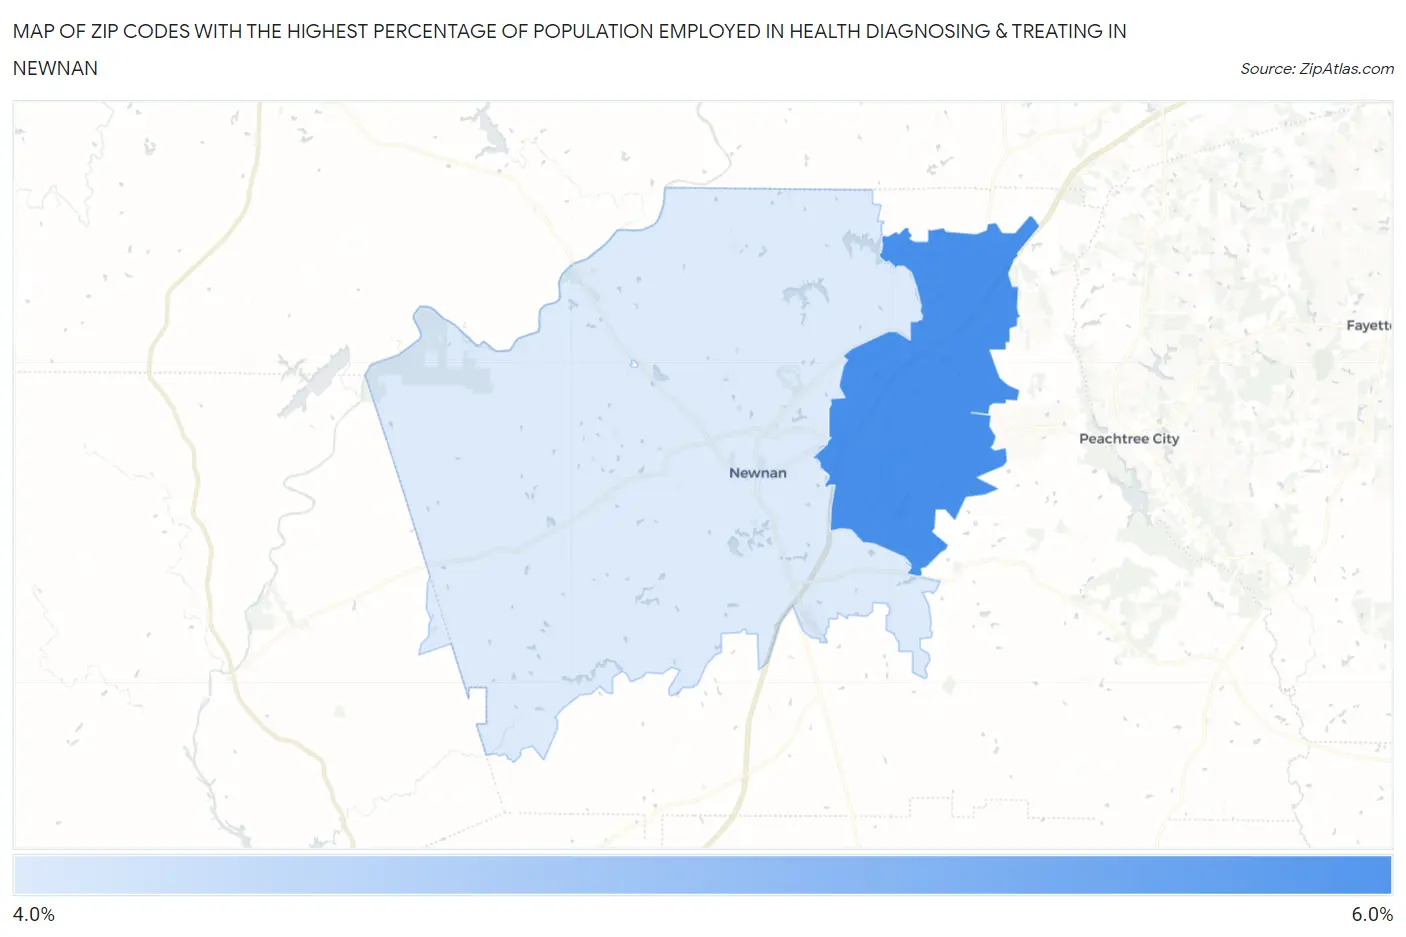
Map of Zip Codes with the Highest Percentage of Population Employed in Health Diagnosing & Treating in Newnan
5.0%
5.8%
Zip Codes with the Highest Percentage of Population Employed in Health Diagnosing & Treating in Newnan, GA
| Zip Code | % Employed | vs State | vs National | |
| 1. | 30265 | 5.8% | 5.7%(+0.084)#299 | 6.2%(-0.455)#14,650 |
| 2. | 30263 | 5.0% | 5.7%(-0.729)#376 | 6.2%(-1.27)#17,812 |
1
Common Questions
What are the Top Zip Codes with the Highest Percentage of Population Employed in Health Diagnosing & Treating in Newnan, GA?
Top Zip Codes with the Highest Percentage of Population Employed in Health Diagnosing & Treating in Newnan, GA are:
What zip code has the Highest Percentage of Population Employed in Health Diagnosing & Treating in Newnan, GA?
30265 has the Highest Percentage of Population Employed in Health Diagnosing & Treating in Newnan, GA with 5.8%.
What is the Percentage of Population Employed in Health Diagnosing & Treating in Newnan, GA?
Percentage of Population Employed in Health Diagnosing & Treating in Newnan is 5.7%.
What is the Percentage of Population Employed in Health Diagnosing & Treating in Georgia?
Percentage of Population Employed in Health Diagnosing & Treating in Georgia is 5.7%.
What is the Percentage of Population Employed in Health Diagnosing & Treating in the United States?
Percentage of Population Employed in Health Diagnosing & Treating in the United States is 6.2%.