Zip Codes with the Highest Percentage of Population Employed in Office & Administration in Newnan, GA
RELATED REPORTS & OPTIONS
Office & Administration
Newnan
Compare Zip Codes
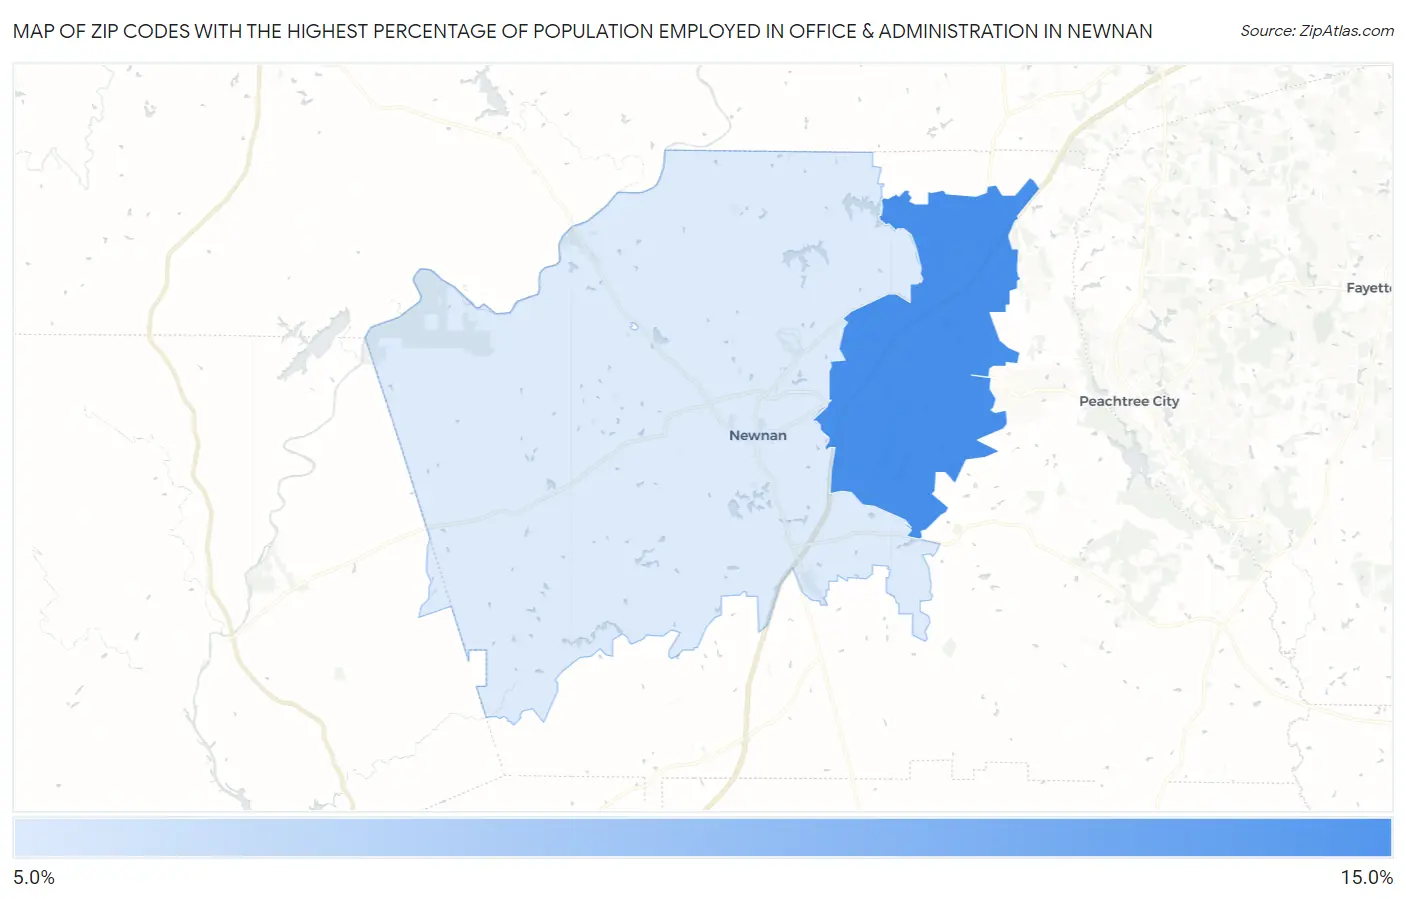
Map of Zip Codes with the Highest Percentage of Population Employed in Office & Administration in Newnan
10.4%
12.1%
Zip Codes with the Highest Percentage of Population Employed in Office & Administration in Newnan, GA
| Zip Code | % Employed | vs State | vs National | |
| 1. | 30265 | 12.1% | 11.1%(+1.02)#263 | 10.9%(+1.24)#10,433 |
| 2. | 30263 | 10.4% | 11.1%(-0.639)#392 | 10.9%(-0.415)#15,692 |
1
Common Questions
What are the Top Zip Codes with the Highest Percentage of Population Employed in Office & Administration in Newnan, GA?
Top Zip Codes with the Highest Percentage of Population Employed in Office & Administration in Newnan, GA are:
What zip code has the Highest Percentage of Population Employed in Office & Administration in Newnan, GA?
30265 has the Highest Percentage of Population Employed in Office & Administration in Newnan, GA with 12.1%.
What is the Percentage of Population Employed in Office & Administration in Newnan, GA?
Percentage of Population Employed in Office & Administration in Newnan is 11.5%.
What is the Percentage of Population Employed in Office & Administration in Georgia?
Percentage of Population Employed in Office & Administration in Georgia is 11.1%.
What is the Percentage of Population Employed in Office & Administration in the United States?
Percentage of Population Employed in Office & Administration in the United States is 10.9%.