Zip Codes with the Highest Percentage of Population Employed in Security & Protection in Newnan, GA
RELATED REPORTS & OPTIONS
Security & Protection
Newnan
Compare Zip Codes
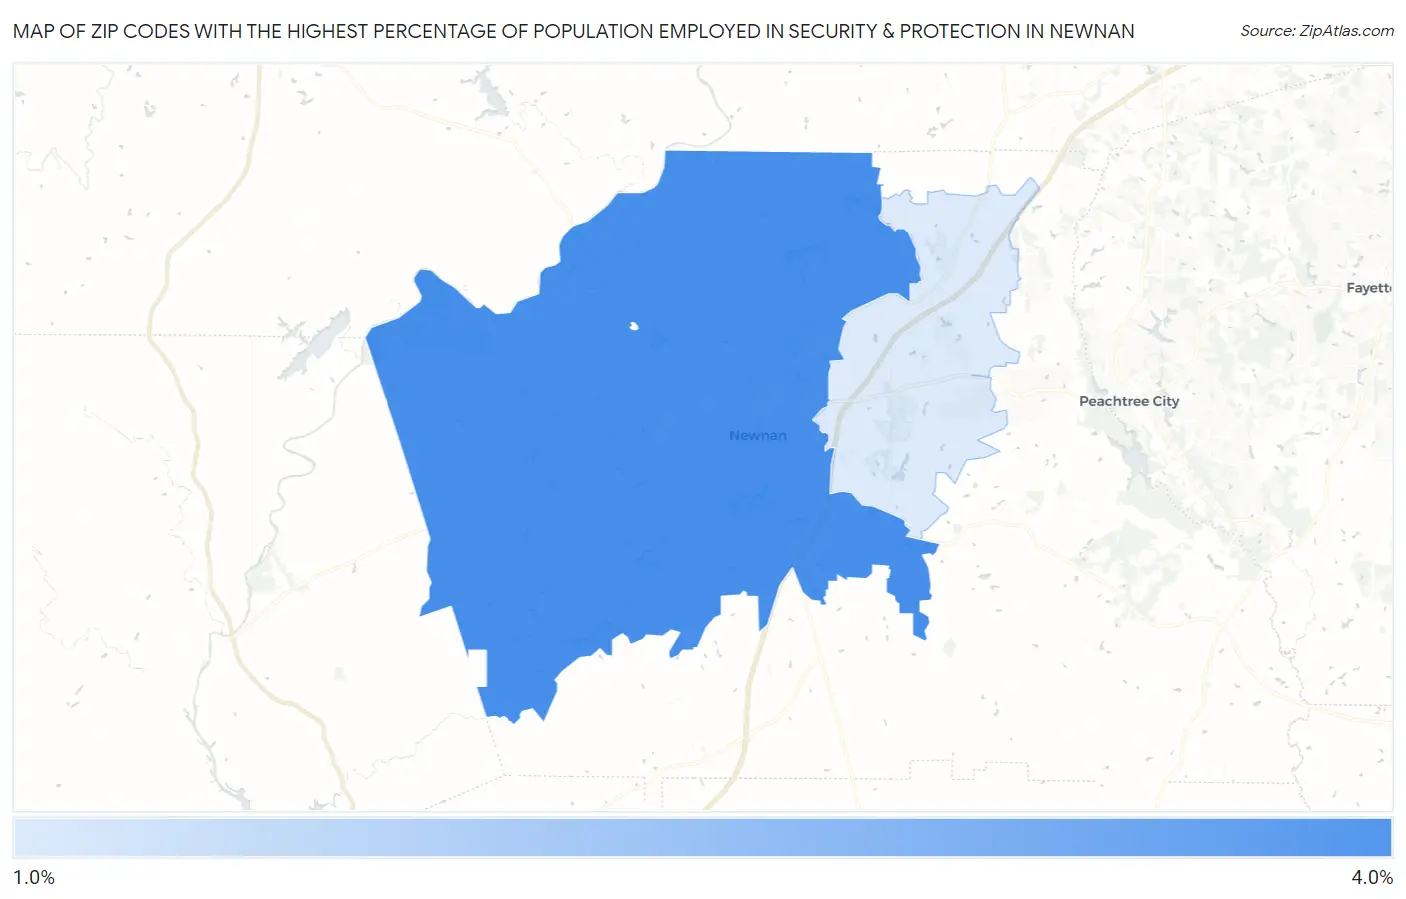
Map of Zip Codes with the Highest Percentage of Population Employed in Security & Protection in Newnan
1.4%
3.0%
Zip Codes with the Highest Percentage of Population Employed in Security & Protection in Newnan, GA
| Zip Code | % Employed | vs State | vs National | |
| 1. | 30263 | 3.0% | 2.2%(+0.861)#212 | 2.1%(+0.884)#7,095 |
| 2. | 30265 | 1.4% | 2.2%(-0.748)#461 | 2.1%(-0.725)#16,779 |
1
Common Questions
What are the Top Zip Codes with the Highest Percentage of Population Employed in Security & Protection in Newnan, GA?
Top Zip Codes with the Highest Percentage of Population Employed in Security & Protection in Newnan, GA are:
What zip code has the Highest Percentage of Population Employed in Security & Protection in Newnan, GA?
30263 has the Highest Percentage of Population Employed in Security & Protection in Newnan, GA with 3.0%.
What is the Percentage of Population Employed in Security & Protection in Newnan, GA?
Percentage of Population Employed in Security & Protection in Newnan is 2.3%.
What is the Percentage of Population Employed in Security & Protection in Georgia?
Percentage of Population Employed in Security & Protection in Georgia is 2.2%.
What is the Percentage of Population Employed in Security & Protection in the United States?
Percentage of Population Employed in Security & Protection in the United States is 2.1%.