Tongan vs Immigrants from Kazakhstan Female Unemployment

COMPARE

Tongan
Race
Ancestry
AfghanAfricanAlaska NativeAlaskan AthabascanAlbanianAleutAlsatianAmericanApacheArabArapahoArgentineanArmenianAssyrian/Chaldean/SyriacAustralianAustrianBahamianBangladeshiBarbadianBasqueBelgianBelizeanBermudanBhutaneseBlackfeetBolivianBrazilianBritishBritish West IndianBulgarianBurmeseCajunCambodianCanadianCape VerdeanCarpatho RusynCelticCentral AmericanCentral American IndianCherokeeCheyenneChickasawChileanChineseChippewaChoctawColombianColvilleComancheCosta RicanCreeCreekCroatianCrowCubanCypriotCzechCzechoslovakianDanishDelawareDominicanDutchDutch West IndianEastern EuropeanEcuadorianEgyptianEnglishEstonianEthiopianEuropeanFijianFilipinoFinnishFrenchFrench American IndianFrench CanadianGermanGerman RussianGhanaianGreekGuamanian/ChamorroGuatemalanGuyaneseHaitianHmongHonduranHopiHoumaHungarianIcelanderIndian (Asian)IndonesianInupiatIranianIraqiIrishIroquoisIsraeliItalianJamaicanJapaneseJordanianKenyanKiowaKoreanLaotianLatvianLebaneseLiberianLithuanianLumbeeLuxembourgerMacedonianMalaysianMalteseMarshalleseMenomineeMexicanMexican American IndianMongolianMoroccanNative HawaiianNavajoNepaleseNew ZealanderNicaraguanNigerianNorthern EuropeanNorwegianOkinawanOsageOttawaPaiutePakistaniPalestinianPanamanianParaguayanPennsylvania GermanPeruvianPimaPolishPortuguesePotawatomiPuebloPuerto RicanPuget Sound SalishRomanianRussianSalvadoranSamoanScandinavianScotch-IrishScottishSeminoleSenegaleseSerbianShoshoneSierra LeoneanSiouxSlavicSlovakSloveneSomaliSouth AfricanSouth AmericanSouth American IndianSoviet UnionSpaniardSpanishSpanish AmericanSpanish American IndianSri LankanSubsaharan AfricanSudaneseSwedishSwissSyrianTaiwaneseThaiTlingit-HaidaTohono O'OdhamTonganTrinidadian and TobagonianTsimshianTurkishU.S. Virgin IslanderUgandanUkrainianUruguayanUteVenezuelanVietnameseWelshWest IndianYakamaYaquiYugoslavianYumanYup'ikZimbabwean
Immigration
NonimmigrantsImmigrantsAfghanistanAfricaAlbaniaArgentinaArmeniaAsiaAustraliaAustriaBahamasBangladeshBarbadosBelarusBelgiumBelizeBoliviaBosnia and HerzegovinaBrazilBulgariaBurma/MyanmarCabo VerdeCambodiaCameroonCanadaCaribbeanCentral AmericaChileChinaColombiaCongoCosta RicaCroatiaCubaCzechoslovakiaDenmarkDominicaDominican RepublicEastern AfricaEastern AsiaEastern EuropeEcuadorEgyptEl SalvadorEnglandEritreaEthiopiaEuropeFijiFranceGermanyGhanaGreeceGrenadaGuatemalaGuyanaHaitiHondurasHong KongHungaryIndiaIndonesiaIranIraqIrelandIsraelItalyJamaicaJapanJordanKenyaKoreaKuwaitLaosLatin AmericaLatviaLebanonLiberiaLithuaniaMalaysiaMexicoMicronesiaMiddle AfricaMoldovaMoroccoNepalNetherlandsNicaraguaNigeriaNorth AmericaNorth MacedoniaNorthern AfricaNorthern EuropeNorwayOceaniaPakistanPanamaPeruPhilippinesPolandPortugalRomaniaRussiaSaudi ArabiaScotlandSenegalSerbiaSierra LeoneSingaporeSomaliaSouth AfricaSouth AmericaSouth Central AsiaSouth Eastern AsiaSouthern EuropeSpainSri LankaSt. Vincent and the GrenadinesSudanSwedenSwitzerlandSyriaTaiwanThailandTrinidad and TobagoTurkeyUgandaUkraineUruguayUzbekistanVenezuelaVietnamWest IndiesWestern AfricaWestern AsiaWestern EuropeYemenZaireZimbabweAzores
Immigrants from Kazakhstan
Race
Ancestry
AfghanAfricanAlaska NativeAlaskan AthabascanAlbanianAleutAlsatianAmericanApacheArabArapahoArgentineanArmenianAssyrian/Chaldean/SyriacAustralianAustrianBahamianBangladeshiBarbadianBasqueBelgianBelizeanBermudanBhutaneseBlackfeetBolivianBrazilianBritishBritish West IndianBulgarianBurmeseCajunCambodianCanadianCape VerdeanCarpatho RusynCelticCentral AmericanCentral American IndianCherokeeCheyenneChickasawChileanChineseChippewaChoctawColombianColvilleComancheCosta RicanCreeCreekCroatianCrowCubanCypriotCzechCzechoslovakianDanishDelawareDominicanDutchDutch West IndianEastern EuropeanEcuadorianEgyptianEnglishEstonianEthiopianEuropeanFijianFilipinoFinnishFrenchFrench American IndianFrench CanadianGermanGerman RussianGhanaianGreekGuamanian/ChamorroGuatemalanGuyaneseHaitianHmongHonduranHopiHoumaHungarianIcelanderIndian (Asian)IndonesianInupiatIranianIraqiIrishIroquoisIsraeliItalianJamaicanJapaneseJordanianKenyanKiowaKoreanLaotianLatvianLebaneseLiberianLithuanianLumbeeLuxembourgerMacedonianMalaysianMalteseMarshalleseMenomineeMexicanMexican American IndianMongolianMoroccanNative HawaiianNavajoNepaleseNew ZealanderNicaraguanNigerianNorthern EuropeanNorwegianOkinawanOsageOttawaPaiutePakistaniPalestinianPanamanianParaguayanPennsylvania GermanPeruvianPimaPolishPortuguesePotawatomiPuebloPuerto RicanPuget Sound SalishRomanianRussianSalvadoranSamoanScandinavianScotch-IrishScottishSeminoleSenegaleseSerbianShoshoneSierra LeoneanSiouxSlavicSlovakSloveneSomaliSouth AfricanSouth AmericanSouth American IndianSoviet UnionSpaniardSpanishSpanish AmericanSpanish American IndianSri LankanSubsaharan AfricanSudaneseSwedishSwissSyrianTaiwaneseThaiTlingit-HaidaTohono O'OdhamTrinidadian and TobagonianTsimshianTurkishU.S. Virgin IslanderUgandanUkrainianUruguayanUteVenezuelanVietnameseWelshWest IndianYakamaYaquiYugoslavianYumanYup'ikZimbabwean
Immigration
NonimmigrantsImmigrantsAfghanistanAfricaAlbaniaArgentinaArmeniaAsiaAustraliaAustriaBahamasBangladeshBarbadosBelarusBelgiumBelizeBoliviaBosnia and HerzegovinaBrazilBulgariaBurma/MyanmarCabo VerdeCambodiaCameroonCanadaCaribbeanCentral AmericaChileChinaColombiaCongoCosta RicaCroatiaCubaCzechoslovakiaDenmarkDominicaDominican RepublicEastern AfricaEastern AsiaEastern EuropeEcuadorEgyptEl SalvadorEnglandEritreaEthiopiaEuropeFijiFranceGermanyGhanaGreeceGrenadaGuatemalaGuyanaHaitiHondurasHong KongHungaryIndiaIndonesiaIranIraqIrelandIsraelItalyJamaicaJapanJordanKazakhstanKenyaKoreaKuwaitLaosLatin AmericaLatviaLebanonLiberiaLithuaniaMalaysiaMexicoMicronesiaMiddle AfricaMoldovaMoroccoNepalNetherlandsNicaraguaNigeriaNorth AmericaNorth MacedoniaNorthern AfricaNorthern EuropeNorwayOceaniaPakistanPanamaPeruPhilippinesPolandPortugalRomaniaRussiaSaudi ArabiaScotlandSenegalSerbiaSierra LeoneSingaporeSomaliaSouth AfricaSouth AmericaSouth Central AsiaSouth Eastern AsiaSouthern EuropeSpainSri LankaSt. Vincent and the GrenadinesSudanSwedenSwitzerlandSyriaTaiwanThailandTrinidad and TobagoTurkeyUgandaUkraineUruguayUzbekistanVenezuelaVietnamWest IndiesWestern AfricaWestern AsiaWestern EuropeYemenZaireZimbabweAzores
Female Unemployment
Income
Poverty
Unemployment
Labor Participation
Family Structure
Vehicle Availability
Education Level
Disability

Female Unemployment Comparison

Tongans

Immigrants from Kazakhstan

Exceptional
Excellent
4.8%
FEMALE UNEMPLOYMENT
99.5/ 100
METRIC RATING
41st/ 347
METRIC RANK
5.1%
FEMALE UNEMPLOYMENT
80.7/ 100
METRIC RATING
143rd/ 347
METRIC RANK

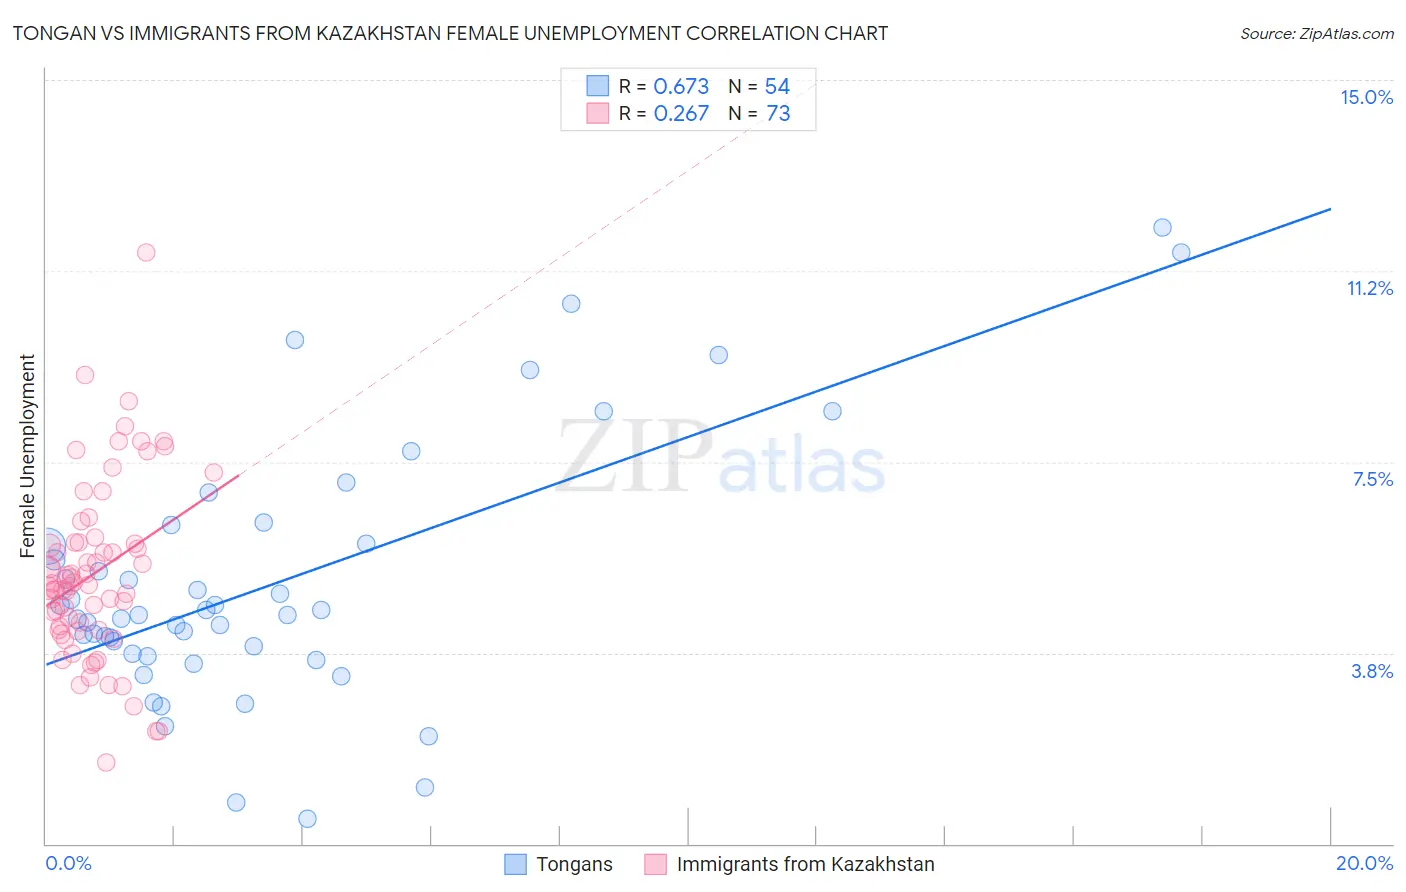
Tongan vs Immigrants from Kazakhstan Female Unemployment Correlation Chart

The statistical analysis conducted on geographies consisting of 102,722,911 people shows a significant positive correlation between the proportion of Tongans and unemploymnet rate among females in the United States with a correlation coefficient (R) of 0.673 and weighted average of 4.8%. Similarly, the statistical analysis conducted on geographies consisting of 124,276,021 people shows a weak positive correlation between the proportion of Immigrants from Kazakhstan and unemploymnet rate among females in the United States with a correlation coefficient (R) of 0.267 and weighted average of 5.1%, a difference of 6.4%.
Tongan vs Immigrants from Kazakhstan Female Unemployment

Female Unemployment Correlation Summary

MeasurementTonganImmigrants from Kazakhstan
Minimum0.50%1.6%
Maximum12.1%11.6%
Range11.6%10.0%
Mean5.1%5.3%
Median4.5%5.1%
Interquartile 25% (IQ1)3.7%4.2%
Interquartile 75% (IQ3)5.9%5.9%
Interquartile Range (IQR)2.2%1.7%
Standard Deviation (Sample)2.5%1.7%
Standard Deviation (Population)2.5%1.7%

Similar Demographics by Female Unemployment

Demographics Similar to Tongans by Female Unemployment

In terms of female unemployment, the demographic groups most similar to Tongans are Italian (4.8%, a difference of 0.13%), French (4.8%, a difference of 0.26%), Scotch-Irish (4.8%, a difference of 0.30%), Northern European (4.8%, a difference of 0.31%), and Eastern European (4.9%, a difference of 0.31%).
DemographicsRating | RankFemale Unemployment
Zimbabweans
99.7
/100
|
#34
Exceptional
4.8%
French Canadians
99.7
/100
|
#35
Exceptional
4.8%
Yugoslavians
99.7
/100
|
#36
Exceptional
4.8%
Pennsylvania Germans
99.6
/100
|
#37
Exceptional
4.8%
Northern Europeans
99.6
/100
|
#38
Exceptional
4.8%
Scotch-Irish
99.6
/100
|
#39
Exceptional
4.8%
French
99.6
/100
|
#40
Exceptional
4.8%
Tongans
99.5
/100
|
#41
Exceptional
4.8%
Italians
99.5
/100
|
#42
Exceptional
4.8%
Eastern Europeans
99.4
/100
|
#43
Exceptional
4.9%
Greeks
99.4
/100
|
#44
Exceptional
4.9%
Austrians
99.3
/100
|
#45
Exceptional
4.9%
Immigrants | Bulgaria
99.3
/100
|
#46
Exceptional
4.9%
Okinawans
99.3
/100
|
#47
Exceptional
4.9%
Thais
99.2
/100
|
#48
Exceptional
4.9%

Demographics Similar to Immigrants from Kazakhstan by Female Unemployment

In terms of female unemployment, the demographic groups most similar to Immigrants from Kazakhstan are Palestinian (5.1%, a difference of 0.010%), Immigrants from Jordan (5.1%, a difference of 0.030%), Immigrants from Eastern Europe (5.1%, a difference of 0.090%), Immigrants from Oceania (5.2%, a difference of 0.12%), and Immigrants from Norway (5.2%, a difference of 0.13%).
DemographicsRating | RankFemale Unemployment
Indians (Asian)
84.2
/100
|
#136
Excellent
5.1%
Pakistanis
83.8
/100
|
#137
Excellent
5.1%
Chickasaw
83.2
/100
|
#138
Excellent
5.1%
Immigrants | Eastern Asia
83.0
/100
|
#139
Excellent
5.1%
Immigrants | France
82.7
/100
|
#140
Excellent
5.1%
Immigrants | Eastern Europe
81.5
/100
|
#141
Excellent
5.1%
Palestinians
80.8
/100
|
#142
Excellent
5.1%
Immigrants | Kazakhstan
80.7
/100
|
#143
Excellent
5.1%
Immigrants | Jordan
80.4
/100
|
#144
Excellent
5.1%
Immigrants | Oceania
79.5
/100
|
#145
Good
5.2%
Immigrants | Norway
79.4
/100
|
#146
Good
5.2%
Argentineans
79.2
/100
|
#147
Good
5.2%
Immigrants | Argentina
78.7
/100
|
#148
Good
5.2%
Asians
78.3
/100
|
#149
Good
5.2%
Egyptians
78.3
/100
|
#150
Good
5.2%