Immigrants from Jamaica vs French Disability Age Under 5

COMPARE

Immigrants from Jamaica
Race
Ancestry
AfghanAfricanAlaska NativeAlaskan AthabascanAlbanianAleutAlsatianAmericanApacheArabArapahoArgentineanArmenianAssyrian/Chaldean/SyriacAustralianAustrianBahamianBangladeshiBarbadianBasqueBelgianBelizeanBermudanBhutaneseBlackfeetBolivianBrazilianBritishBritish West IndianBulgarianBurmeseCajunCambodianCanadianCape VerdeanCarpatho RusynCelticCentral AmericanCentral American IndianCherokeeCheyenneChickasawChileanChineseChippewaChoctawColombianColvilleComancheCosta RicanCreeCreekCroatianCrowCubanCypriotCzechCzechoslovakianDanishDelawareDominicanDutchDutch West IndianEastern EuropeanEcuadorianEgyptianEnglishEstonianEthiopianEuropeanFijianFilipinoFinnishFrench American IndianFrench CanadianGermanGerman RussianGhanaianGreekGuamanian/ChamorroGuatemalanGuyaneseHaitianHmongHonduranHopiHoumaHungarianIcelanderIndian (Asian)IndonesianInupiatIranianIraqiIrishIroquoisIsraeliItalianJamaicanJapaneseJordanianKenyanKiowaKoreanLaotianLatvianLebaneseLiberianLithuanianLumbeeLuxembourgerMacedonianMalaysianMalteseMarshalleseMenomineeMexicanMexican American IndianMongolianMoroccanNative HawaiianNavajoNepaleseNew ZealanderNicaraguanNigerianNorthern EuropeanNorwegianOkinawanOsageOttawaPaiutePakistaniPalestinianPanamanianParaguayanPennsylvania GermanPeruvianPimaPolishPortuguesePotawatomiPuebloPuerto RicanPuget Sound SalishRomanianRussianSalvadoranSamoanScandinavianScotch-IrishScottishSeminoleSenegaleseSerbianShoshoneSierra LeoneanSiouxSlavicSlovakSloveneSomaliSouth AfricanSouth AmericanSouth American IndianSoviet UnionSpaniardSpanishSpanish AmericanSpanish American IndianSri LankanSubsaharan AfricanSudaneseSwedishSwissSyrianTaiwaneseThaiTlingit-HaidaTohono O'OdhamTonganTrinidadian and TobagonianTsimshianTurkishU.S. Virgin IslanderUgandanUkrainianUruguayanUteVenezuelanVietnameseWelshWest IndianYakamaYaquiYugoslavianYumanYup'ikZimbabwean
Immigration
NonimmigrantsImmigrantsAfghanistanAfricaAlbaniaArgentinaArmeniaAsiaAustraliaAustriaBahamasBangladeshBarbadosBelarusBelgiumBelizeBoliviaBosnia and HerzegovinaBrazilBulgariaBurma/MyanmarCabo VerdeCambodiaCameroonCanadaCaribbeanCentral AmericaChileChinaColombiaCongoCosta RicaCroatiaCubaCzechoslovakiaDenmarkDominicaDominican RepublicEastern AfricaEastern AsiaEastern EuropeEcuadorEgyptEl SalvadorEnglandEritreaEthiopiaEuropeFijiFranceGermanyGhanaGreeceGrenadaGuatemalaGuyanaHaitiHondurasHong KongHungaryIndiaIndonesiaIranIraqIrelandIsraelItalyJamaicaJapanJordanKazakhstanKenyaKoreaKuwaitLaosLatin AmericaLatviaLebanonLiberiaLithuaniaMalaysiaMexicoMicronesiaMiddle AfricaMoldovaMoroccoNepalNetherlandsNicaraguaNigeriaNorth AmericaNorth MacedoniaNorthern AfricaNorthern EuropeNorwayOceaniaPakistanPanamaPeruPhilippinesPolandPortugalRomaniaRussiaSaudi ArabiaScotlandSenegalSerbiaSierra LeoneSingaporeSomaliaSouth AfricaSouth AmericaSouth Central AsiaSouth Eastern AsiaSouthern EuropeSpainSri LankaSt. Vincent and the GrenadinesSudanSwedenSwitzerlandSyriaTaiwanThailandTrinidad and TobagoTurkeyUgandaUkraineUruguayUzbekistanVenezuelaVietnamWest IndiesWestern AfricaWestern AsiaWestern EuropeYemenZaireZimbabweAzores
French
Race
Ancestry
AfghanAfricanAlaska NativeAlaskan AthabascanAlbanianAleutAlsatianAmericanApacheArabArapahoArgentineanArmenianAssyrian/Chaldean/SyriacAustralianAustrianBahamianBangladeshiBarbadianBasqueBelgianBelizeanBermudanBhutaneseBlackfeetBolivianBrazilianBritishBritish West IndianBulgarianBurmeseCajunCambodianCanadianCape VerdeanCarpatho RusynCelticCentral AmericanCentral American IndianCherokeeCheyenneChickasawChileanChineseChippewaChoctawColombianColvilleComancheCosta RicanCreeCreekCroatianCrowCubanCypriotCzechCzechoslovakianDanishDelawareDominicanDutchDutch West IndianEastern EuropeanEcuadorianEgyptianEnglishEstonianEthiopianEuropeanFijianFilipinoFinnishFrenchFrench American IndianFrench CanadianGermanGerman RussianGhanaianGreekGuamanian/ChamorroGuatemalanGuyaneseHaitianHmongHonduranHopiHoumaHungarianIcelanderIndian (Asian)IndonesianInupiatIranianIraqiIrishIroquoisIsraeliItalianJamaicanJapaneseJordanianKenyanKiowaKoreanLaotianLatvianLebaneseLiberianLithuanianLumbeeLuxembourgerMacedonianMalaysianMalteseMarshalleseMenomineeMexicanMexican American IndianMongolianMoroccanNative HawaiianNavajoNepaleseNew ZealanderNicaraguanNigerianNorthern EuropeanNorwegianOkinawanOsageOttawaPaiutePakistaniPalestinianPanamanianParaguayanPennsylvania GermanPeruvianPimaPolishPortuguesePotawatomiPuebloPuerto RicanPuget Sound SalishRomanianRussianSalvadoranSamoanScandinavianScotch-IrishScottishSeminoleSenegaleseSerbianShoshoneSierra LeoneanSiouxSlavicSlovakSloveneSomaliSouth AfricanSouth AmericanSouth American IndianSoviet UnionSpaniardSpanishSpanish AmericanSpanish American IndianSri LankanSubsaharan AfricanSudaneseSwedishSwissSyrianTaiwaneseThaiTlingit-HaidaTohono O'OdhamTonganTrinidadian and TobagonianTsimshianTurkishU.S. Virgin IslanderUgandanUkrainianUruguayanUteVenezuelanVietnameseWelshWest IndianYakamaYaquiYugoslavianYumanYup'ikZimbabwean
Immigration
NonimmigrantsImmigrantsAfghanistanAfricaAlbaniaArgentinaArmeniaAsiaAustraliaAustriaBahamasBangladeshBarbadosBelarusBelgiumBelizeBoliviaBosnia and HerzegovinaBrazilBulgariaBurma/MyanmarCabo VerdeCambodiaCameroonCanadaCaribbeanCentral AmericaChileChinaColombiaCongoCosta RicaCroatiaCubaCzechoslovakiaDenmarkDominicaDominican RepublicEastern AfricaEastern AsiaEastern EuropeEcuadorEgyptEl SalvadorEnglandEritreaEthiopiaEuropeFijiFranceGermanyGhanaGreeceGrenadaGuatemalaGuyanaHaitiHondurasHong KongHungaryIndiaIndonesiaIranIraqIrelandIsraelItalyJapanJordanKazakhstanKenyaKoreaKuwaitLaosLatin AmericaLatviaLebanonLiberiaLithuaniaMalaysiaMexicoMicronesiaMiddle AfricaMoldovaMoroccoNepalNetherlandsNicaraguaNigeriaNorth AmericaNorth MacedoniaNorthern AfricaNorthern EuropeNorwayOceaniaPakistanPanamaPeruPhilippinesPolandPortugalRomaniaRussiaSaudi ArabiaScotlandSenegalSerbiaSierra LeoneSingaporeSomaliaSouth AfricaSouth AmericaSouth Central AsiaSouth Eastern AsiaSouthern EuropeSpainSri LankaSt. Vincent and the GrenadinesSudanSwedenSwitzerlandSyriaTaiwanThailandTrinidad and TobagoTurkeyUgandaUkraineUruguayUzbekistanVenezuelaVietnamWest IndiesWestern AfricaWestern AsiaWestern EuropeYemenZaireZimbabweAzores
Disability Age Under 5
Income
Poverty
Unemployment
Labor Participation
Family Structure
Vehicle Availability
Education Level
Disability

Disability Age Under 5 Comparison

Immigrants from Jamaica

French

Average
Tragic
1.2%
DISABILITY AGE UNDER 5
58.8/ 100
METRIC RATING
170th/ 347
METRIC RANK
1.7%
DISABILITY AGE UNDER 5
0.0/ 100
METRIC RATING
317th/ 347
METRIC RANK

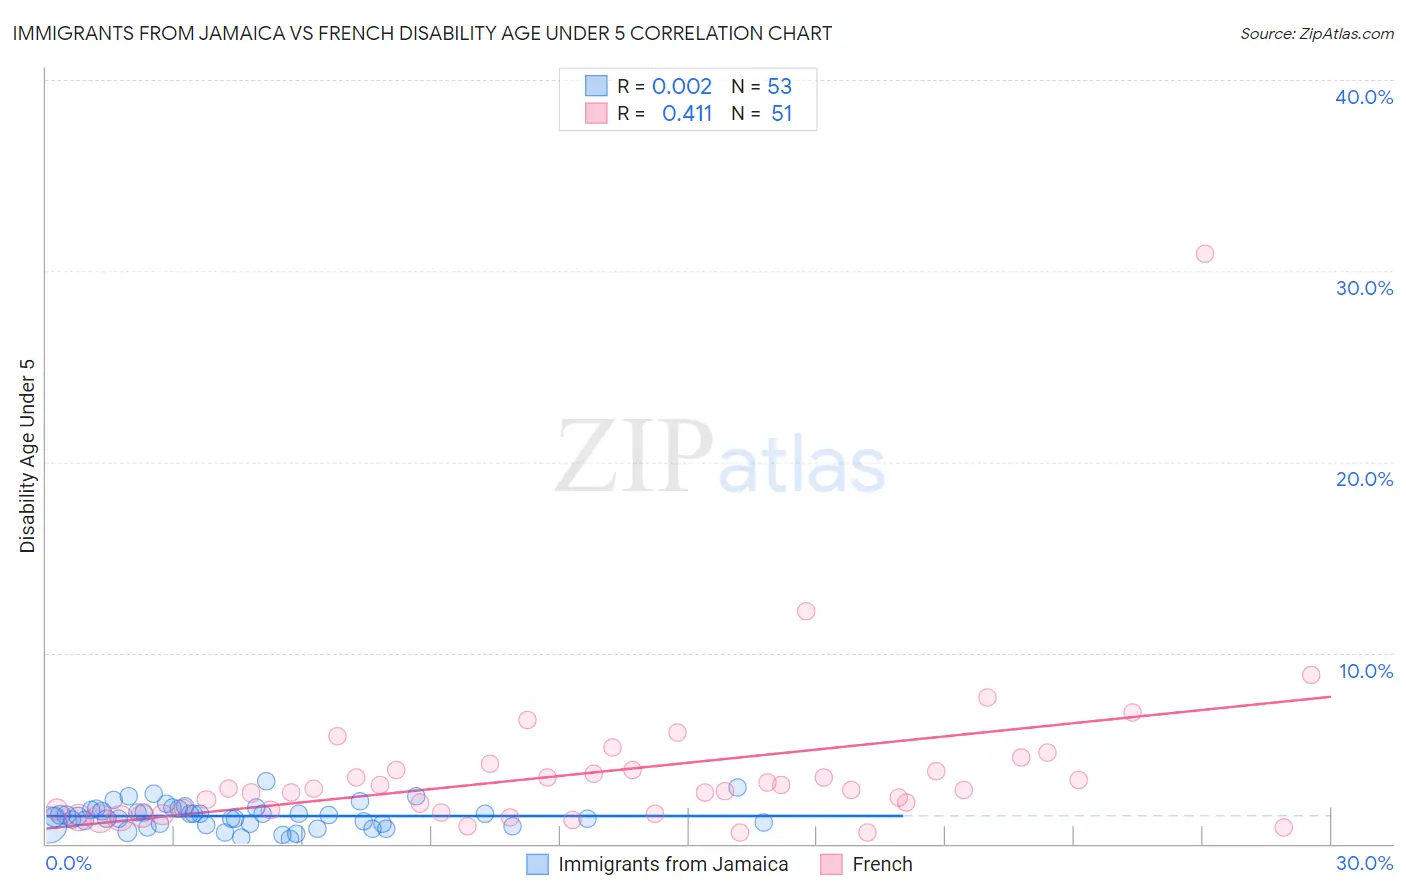
Immigrants from Jamaica vs French Disability Age Under 5 Correlation Chart

The statistical analysis conducted on geographies consisting of 173,327,307 people shows no correlation between the proportion of Immigrants from Jamaica and percentage of population with a disability under the age of 5 in the United States with a correlation coefficient (R) of 0.002 and weighted average of 1.2%. Similarly, the statistical analysis conducted on geographies consisting of 260,987,253 people shows a moderate positive correlation between the proportion of French and percentage of population with a disability under the age of 5 in the United States with a correlation coefficient (R) of 0.411 and weighted average of 1.7%, a difference of 37.5%.
Immigrants from Jamaica vs French Disability Age Under 5

Disability Age Under 5 Correlation Summary

MeasurementImmigrants from JamaicaFrench
Minimum0.28%0.58%
Maximum3.3%30.9%
Range3.0%30.3%
Mean1.4%3.8%
Median1.5%2.8%
Interquartile 25% (IQ1)1.0%1.7%
Interquartile 75% (IQ3)1.8%3.9%
Interquartile Range (IQR)0.78%2.2%
Standard Deviation (Sample)0.64%4.5%
Standard Deviation (Population)0.63%4.4%

Similar Demographics by Disability Age Under 5

Demographics Similar to Immigrants from Jamaica by Disability Age Under 5

In terms of disability age under 5, the demographic groups most similar to Immigrants from Jamaica are Immigrants from Uruguay (1.2%, a difference of 0.020%), Sierra Leonean (1.2%, a difference of 0.030%), Guamanian/Chamorro (1.2%, a difference of 0.090%), Immigrants from Argentina (1.2%, a difference of 0.13%), and Immigrants from Central America (1.2%, a difference of 0.25%).
DemographicsRating | RankDisability Age Under 5
Immigrants | Guatemala
63.2
/100
|
#163
Good
1.2%
Laotians
62.8
/100
|
#164
Good
1.2%
Immigrants | Kuwait
62.6
/100
|
#165
Good
1.2%
Immigrants | Central America
61.4
/100
|
#166
Good
1.2%
Immigrants | Argentina
60.2
/100
|
#167
Good
1.2%
Sierra Leoneans
59.1
/100
|
#168
Average
1.2%
Immigrants | Uruguay
59.0
/100
|
#169
Average
1.2%
Immigrants | Jamaica
58.8
/100
|
#170
Average
1.2%
Guamanians/Chamorros
57.8
/100
|
#171
Average
1.2%
Crow
51.0
/100
|
#172
Average
1.2%
Immigrants | Ireland
50.3
/100
|
#173
Average
1.2%
Immigrants | Latvia
50.0
/100
|
#174
Average
1.2%
Immigrants | Nigeria
50.0
/100
|
#175
Average
1.2%
Immigrants | Kenya
48.6
/100
|
#176
Average
1.2%
Comanche
47.5
/100
|
#177
Average
1.2%

Demographics Similar to French by Disability Age Under 5

In terms of disability age under 5, the demographic groups most similar to French are Irish (1.7%, a difference of 0.27%), Immigrants from Cabo Verde (1.7%, a difference of 0.42%), Slovak (1.7%, a difference of 0.58%), Dutch (1.7%, a difference of 0.61%), and Norwegian (1.7%, a difference of 0.87%).
DemographicsRating | RankDisability Age Under 5
Whites/Caucasians
0.0
/100
|
#310
Tragic
1.7%
English
0.0
/100
|
#311
Tragic
1.7%
Puerto Ricans
0.0
/100
|
#312
Tragic
1.7%
Celtics
0.0
/100
|
#313
Tragic
1.7%
Norwegians
0.0
/100
|
#314
Tragic
1.7%
Dutch
0.0
/100
|
#315
Tragic
1.7%
Immigrants | Cabo Verde
0.0
/100
|
#316
Tragic
1.7%
French
0.0
/100
|
#317
Tragic
1.7%
Irish
0.0
/100
|
#318
Tragic
1.7%
Slovaks
0.0
/100
|
#319
Tragic
1.7%
Scotch-Irish
0.0
/100
|
#320
Tragic
1.7%
Ottawa
0.0
/100
|
#321
Tragic
1.7%
Germans
0.0
/100
|
#322
Tragic
1.7%
Chickasaw
0.0
/100
|
#323
Tragic
1.7%
Cherokee
0.0
/100
|
#324
Tragic
1.8%