Immigrants from Bahamas vs Immigrants from Iran Disability Age Under 5

COMPARE

Immigrants from Bahamas
Race
Ancestry
AfghanAfricanAlaska NativeAlaskan AthabascanAlbanianAleutAlsatianAmericanApacheArabArapahoArgentineanArmenianAssyrian/Chaldean/SyriacAustralianAustrianBahamianBangladeshiBarbadianBasqueBelgianBelizeanBermudanBhutaneseBlackfeetBolivianBrazilianBritishBritish West IndianBulgarianBurmeseCajunCambodianCanadianCape VerdeanCarpatho RusynCelticCentral AmericanCentral American IndianCherokeeCheyenneChickasawChileanChineseChippewaChoctawColombianColvilleComancheCosta RicanCreeCreekCroatianCrowCubanCypriotCzechCzechoslovakianDanishDelawareDominicanDutchDutch West IndianEastern EuropeanEcuadorianEgyptianEnglishEstonianEthiopianEuropeanFijianFilipinoFinnishFrenchFrench American IndianFrench CanadianGermanGerman RussianGhanaianGreekGuamanian/ChamorroGuatemalanGuyaneseHaitianHmongHonduranHopiHoumaHungarianIcelanderIndian (Asian)IndonesianInupiatIranianIraqiIrishIroquoisIsraeliItalianJamaicanJapaneseJordanianKenyanKiowaKoreanLaotianLatvianLebaneseLiberianLithuanianLumbeeLuxembourgerMacedonianMalaysianMalteseMarshalleseMenomineeMexicanMexican American IndianMongolianMoroccanNative HawaiianNavajoNepaleseNew ZealanderNicaraguanNigerianNorthern EuropeanNorwegianOkinawanOsageOttawaPaiutePakistaniPalestinianPanamanianParaguayanPennsylvania GermanPeruvianPimaPolishPortuguesePotawatomiPuebloPuerto RicanPuget Sound SalishRomanianRussianSalvadoranSamoanScandinavianScotch-IrishScottishSeminoleSenegaleseSerbianShoshoneSierra LeoneanSiouxSlavicSlovakSloveneSomaliSouth AfricanSouth AmericanSouth American IndianSoviet UnionSpaniardSpanishSpanish AmericanSpanish American IndianSri LankanSubsaharan AfricanSudaneseSwedishSwissSyrianTaiwaneseThaiTlingit-HaidaTohono O'OdhamTonganTrinidadian and TobagonianTsimshianTurkishU.S. Virgin IslanderUgandanUkrainianUruguayanUteVenezuelanVietnameseWelshWest IndianYakamaYaquiYugoslavianYumanYup'ikZimbabwean
Immigration
NonimmigrantsImmigrantsAfghanistanAfricaAlbaniaArgentinaArmeniaAsiaAustraliaAustriaBahamasBangladeshBarbadosBelarusBelgiumBelizeBoliviaBosnia and HerzegovinaBrazilBulgariaBurma/MyanmarCabo VerdeCambodiaCameroonCanadaCaribbeanCentral AmericaChileChinaColombiaCongoCosta RicaCroatiaCubaCzechoslovakiaDenmarkDominicaDominican RepublicEastern AfricaEastern AsiaEastern EuropeEcuadorEgyptEl SalvadorEnglandEritreaEthiopiaEuropeFijiFranceGermanyGhanaGreeceGrenadaGuatemalaGuyanaHaitiHondurasHong KongHungaryIndiaIndonesiaIraqIrelandIsraelItalyJamaicaJapanJordanKazakhstanKenyaKoreaKuwaitLaosLatin AmericaLatviaLebanonLiberiaLithuaniaMalaysiaMexicoMicronesiaMiddle AfricaMoldovaMoroccoNepalNetherlandsNicaraguaNigeriaNorth AmericaNorth MacedoniaNorthern AfricaNorthern EuropeNorwayOceaniaPakistanPanamaPeruPhilippinesPolandPortugalRomaniaRussiaSaudi ArabiaScotlandSenegalSerbiaSierra LeoneSingaporeSomaliaSouth AfricaSouth AmericaSouth Central AsiaSouth Eastern AsiaSouthern EuropeSpainSri LankaSt. Vincent and the GrenadinesSudanSwedenSwitzerlandSyriaTaiwanThailandTrinidad and TobagoTurkeyUgandaUkraineUruguayUzbekistanVenezuelaVietnamWest IndiesWestern AfricaWestern AsiaWestern EuropeYemenZaireZimbabweAzores
Immigrants from Iran
Race
Ancestry
AfghanAfricanAlaska NativeAlaskan AthabascanAlbanianAleutAlsatianAmericanApacheArabArapahoArgentineanArmenianAssyrian/Chaldean/SyriacAustralianAustrianBahamianBangladeshiBarbadianBasqueBelgianBelizeanBermudanBhutaneseBlackfeetBolivianBrazilianBritishBritish West IndianBulgarianBurmeseCajunCambodianCanadianCape VerdeanCarpatho RusynCelticCentral AmericanCentral American IndianCherokeeCheyenneChickasawChileanChineseChippewaChoctawColombianColvilleComancheCosta RicanCreeCreekCroatianCrowCubanCypriotCzechCzechoslovakianDanishDelawareDominicanDutchDutch West IndianEastern EuropeanEcuadorianEgyptianEnglishEstonianEthiopianEuropeanFijianFilipinoFinnishFrenchFrench American IndianFrench CanadianGermanGerman RussianGhanaianGreekGuamanian/ChamorroGuatemalanGuyaneseHaitianHmongHonduranHopiHoumaHungarianIcelanderIndian (Asian)IndonesianInupiatIranianIraqiIrishIroquoisIsraeliItalianJamaicanJapaneseJordanianKenyanKiowaKoreanLaotianLatvianLebaneseLiberianLithuanianLumbeeLuxembourgerMacedonianMalaysianMalteseMarshalleseMenomineeMexicanMexican American IndianMongolianMoroccanNative HawaiianNavajoNepaleseNew ZealanderNicaraguanNigerianNorthern EuropeanNorwegianOkinawanOsageOttawaPaiutePakistaniPalestinianPanamanianParaguayanPennsylvania GermanPeruvianPimaPolishPortuguesePotawatomiPuebloPuerto RicanPuget Sound SalishRomanianRussianSalvadoranSamoanScandinavianScotch-IrishScottishSeminoleSenegaleseSerbianShoshoneSierra LeoneanSiouxSlavicSlovakSloveneSomaliSouth AfricanSouth AmericanSouth American IndianSoviet UnionSpaniardSpanishSpanish AmericanSpanish American IndianSri LankanSubsaharan AfricanSudaneseSwedishSwissSyrianTaiwaneseThaiTlingit-HaidaTohono O'OdhamTonganTrinidadian and TobagonianTsimshianTurkishU.S. Virgin IslanderUgandanUkrainianUruguayanUteVenezuelanVietnameseWelshWest IndianYakamaYaquiYugoslavianYumanYup'ikZimbabwean
Immigration
NonimmigrantsImmigrantsAfghanistanAfricaAlbaniaArgentinaArmeniaAsiaAustraliaAustriaBangladeshBarbadosBelarusBelgiumBelizeBoliviaBosnia and HerzegovinaBrazilBulgariaBurma/MyanmarCabo VerdeCambodiaCameroonCanadaCaribbeanCentral AmericaChileChinaColombiaCongoCosta RicaCroatiaCubaCzechoslovakiaDenmarkDominicaDominican RepublicEastern AfricaEastern AsiaEastern EuropeEcuadorEgyptEl SalvadorEnglandEritreaEthiopiaEuropeFijiFranceGermanyGhanaGreeceGrenadaGuatemalaGuyanaHaitiHondurasHong KongHungaryIndiaIndonesiaIranIraqIrelandIsraelItalyJamaicaJapanJordanKazakhstanKenyaKoreaKuwaitLaosLatin AmericaLatviaLebanonLiberiaLithuaniaMalaysiaMexicoMicronesiaMiddle AfricaMoldovaMoroccoNepalNetherlandsNicaraguaNigeriaNorth AmericaNorth MacedoniaNorthern AfricaNorthern EuropeNorwayOceaniaPakistanPanamaPeruPhilippinesPolandPortugalRomaniaRussiaSaudi ArabiaScotlandSenegalSerbiaSierra LeoneSingaporeSomaliaSouth AfricaSouth AmericaSouth Central AsiaSouth Eastern AsiaSouthern EuropeSpainSri LankaSt. Vincent and the GrenadinesSudanSwedenSwitzerlandSyriaTaiwanThailandTrinidad and TobagoTurkeyUgandaUkraineUruguayUzbekistanVenezuelaVietnamWest IndiesWestern AfricaWestern AsiaWestern EuropeYemenZaireZimbabweAzores
Disability Age Under 5
Income
Poverty
Unemployment
Labor Participation
Family Structure
Vehicle Availability
Education Level
Disability

Disability Age Under 5 Comparison

Immigrants from Bahamas

Immigrants from Iran

Average
Exceptional
1.2%
DISABILITY AGE UNDER 5
45.2/ 100
METRIC RATING
179th/ 347
METRIC RANK
1.00%
DISABILITY AGE UNDER 5
100.0/ 100
METRIC RATING
22nd/ 347
METRIC RANK

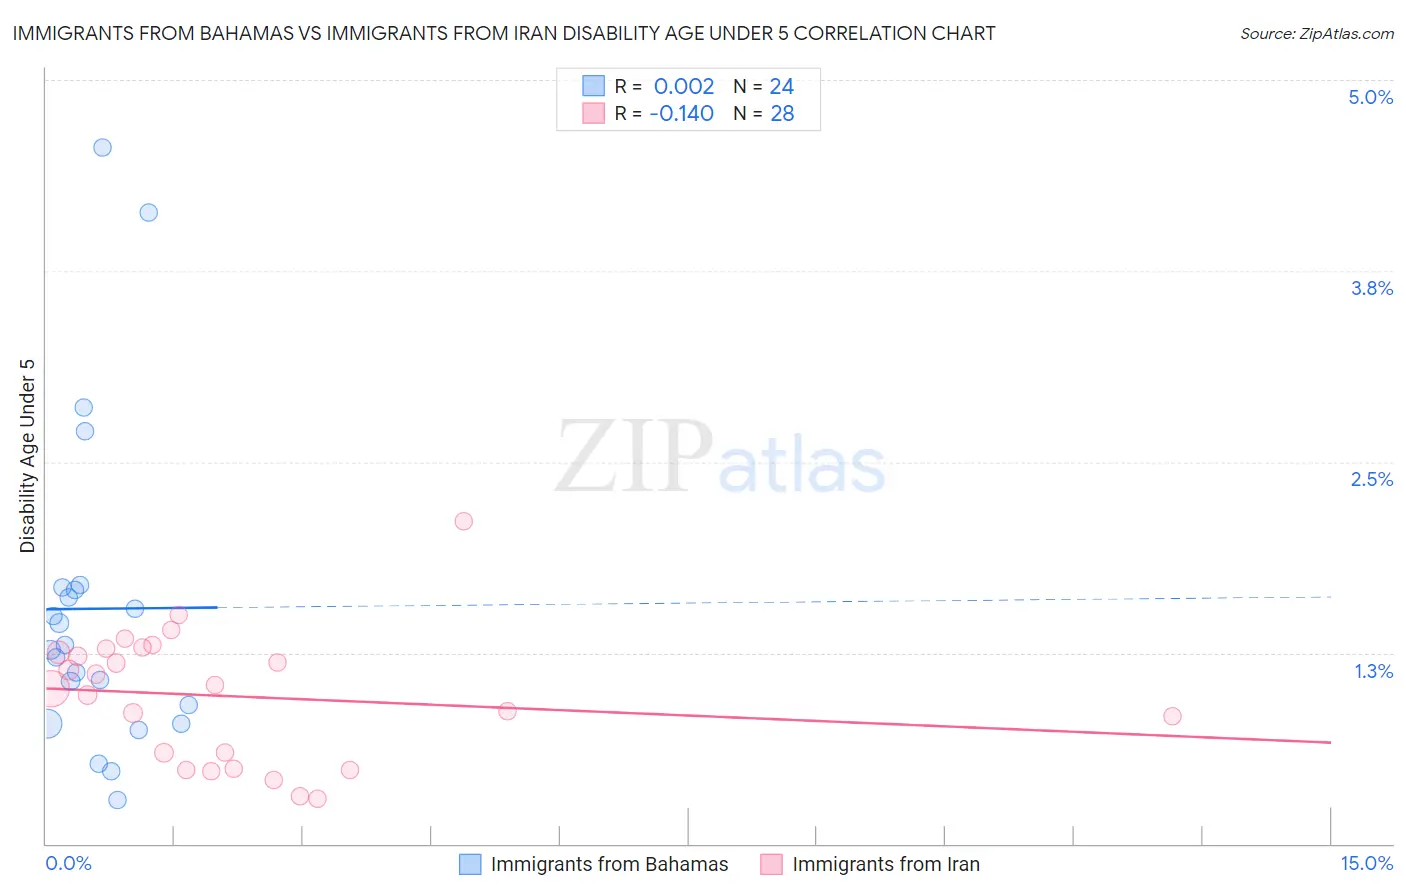
Immigrants from Bahamas vs Immigrants from Iran Disability Age Under 5 Correlation Chart

The statistical analysis conducted on geographies consisting of 77,902,509 people shows no correlation between the proportion of Immigrants from Bahamas and percentage of population with a disability under the age of 5 in the United States with a correlation coefficient (R) of 0.002 and weighted average of 1.2%. Similarly, the statistical analysis conducted on geographies consisting of 168,672,244 people shows a poor negative correlation between the proportion of Immigrants from Iran and percentage of population with a disability under the age of 5 in the United States with a correlation coefficient (R) of -0.140 and weighted average of 1.00%, a difference of 24.7%.
Immigrants from Bahamas vs Immigrants from Iran Disability Age Under 5

Disability Age Under 5 Correlation Summary

MeasurementImmigrants from BahamasImmigrants from Iran
Minimum0.28%0.30%
Maximum4.6%2.1%
Range4.3%1.8%
Mean1.5%0.97%
Median1.3%1.0%
Interquartile 25% (IQ1)0.85%0.54%
Interquartile 75% (IQ3)1.7%1.3%
Interquartile Range (IQR)0.82%0.73%
Standard Deviation (Sample)1.1%0.43%
Standard Deviation (Population)1.0%0.42%

Similar Demographics by Disability Age Under 5

Demographics Similar to Immigrants from Bahamas by Disability Age Under 5

In terms of disability age under 5, the demographic groups most similar to Immigrants from Bahamas are Immigrants from Mexico (1.2%, a difference of 0.070%), Immigrants from Peru (1.2%, a difference of 0.13%), Macedonian (1.2%, a difference of 0.13%), Venezuelan (1.2%, a difference of 0.17%), and Immigrants from Saudi Arabia (1.2%, a difference of 0.17%).
DemographicsRating | RankDisability Age Under 5
Crow
51.0
/100
|
#172
Average
1.2%
Immigrants | Ireland
50.3
/100
|
#173
Average
1.2%
Immigrants | Latvia
50.0
/100
|
#174
Average
1.2%
Immigrants | Nigeria
50.0
/100
|
#175
Average
1.2%
Immigrants | Kenya
48.6
/100
|
#176
Average
1.2%
Comanche
47.5
/100
|
#177
Average
1.2%
Venezuelans
47.1
/100
|
#178
Average
1.2%
Immigrants | Bahamas
45.2
/100
|
#179
Average
1.2%
Immigrants | Mexico
44.4
/100
|
#180
Average
1.2%
Immigrants | Peru
43.7
/100
|
#181
Average
1.2%
Macedonians
43.7
/100
|
#181
Average
1.2%
Immigrants | Saudi Arabia
43.3
/100
|
#183
Average
1.2%
Palestinians
43.0
/100
|
#184
Average
1.2%
Immigrants | Western Africa
42.5
/100
|
#185
Average
1.2%
Cubans
42.5
/100
|
#186
Average
1.2%

Demographics Similar to Immigrants from Iran by Disability Age Under 5

In terms of disability age under 5, the demographic groups most similar to Immigrants from Iran are Yakama (1.00%, a difference of 0.080%), Indian (Asian) (1.0%, a difference of 0.36%), Immigrants from Micronesia (1.0%, a difference of 0.67%), British West Indian (0.99%, a difference of 0.79%), and Immigrants from Taiwan (1.0%, a difference of 0.79%).
DemographicsRating | RankDisability Age Under 5
Immigrants | Hong Kong
100.0
/100
|
#15
Exceptional
0.95%
Immigrants | Israel
100.0
/100
|
#16
Exceptional
0.96%
Immigrants | China
100.0
/100
|
#17
Exceptional
0.96%
Immigrants | Barbados
100.0
/100
|
#18
Exceptional
0.97%
Puget Sound Salish
100.0
/100
|
#19
Exceptional
0.97%
Nepalese
100.0
/100
|
#20
Exceptional
0.97%
British West Indians
100.0
/100
|
#21
Exceptional
0.99%
Immigrants | Iran
100.0
/100
|
#22
Exceptional
1.00%
Yakama
100.0
/100
|
#23
Exceptional
1.00%
Indians (Asian)
100.0
/100
|
#24
Exceptional
1.0%
Immigrants | Micronesia
100.0
/100
|
#25
Exceptional
1.0%
Immigrants | Taiwan
100.0
/100
|
#26
Exceptional
1.0%
Guyanese
100.0
/100
|
#27
Exceptional
1.0%
Immigrants | Eastern Asia
100.0
/100
|
#28
Exceptional
1.0%
Immigrants | Belarus
100.0
/100
|
#29
Exceptional
1.0%