Zip Codes with the Highest Percentage of Population Employed in Architecture & Engineering in Colorado Springs, CO
RELATED REPORTS & OPTIONS
Architecture & Engineering
Colorado Springs
Compare Zip Codes
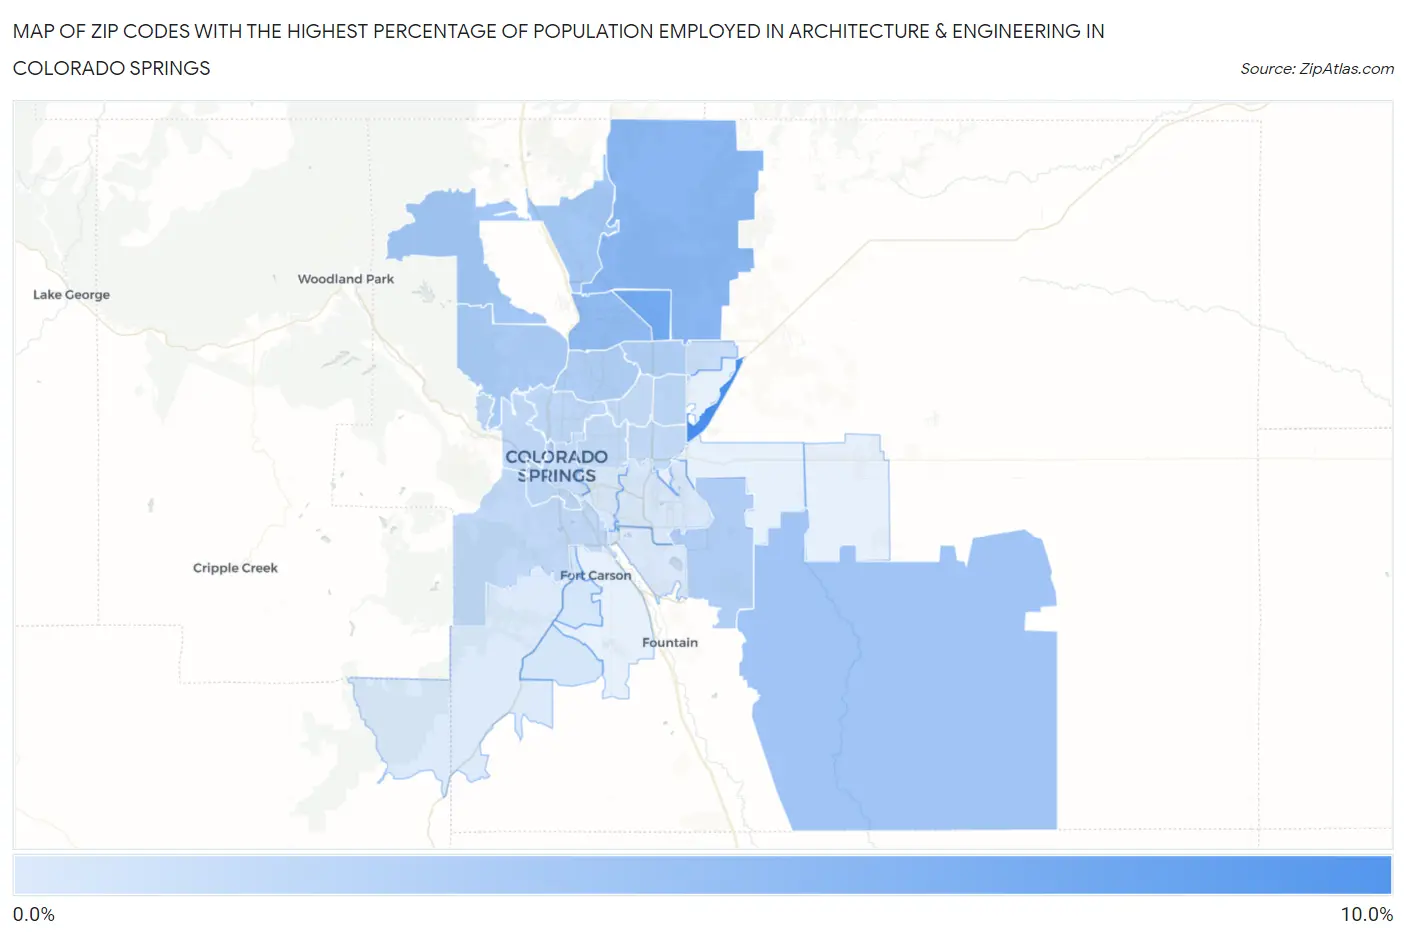
Map of Zip Codes with the Highest Percentage of Population Employed in Architecture & Engineering in Colorado Springs
0.0%
10.0%
Zip Codes with the Highest Percentage of Population Employed in Architecture & Engineering in Colorado Springs, CO
| Zip Code | % Employed | vs State | vs National | |
| 1. | 80951 | 8.2% | 2.9%(+5.27)#8 | 2.1%(+6.04)#539 |
| 2. | 80924 | 6.0% | 2.9%(+3.07)#18 | 2.1%(+3.84)#1,084 |
| 3. | 80908 | 4.8% | 2.9%(+1.93)#39 | 2.1%(+2.70)#1,788 |
| 4. | 80920 | 4.5% | 2.9%(+1.60)#52 | 2.1%(+2.37)#2,095 |
| 5. | 80928 | 3.8% | 2.9%(+0.846)#85 | 2.1%(+1.62)#3,162 |
| 6. | 80921 | 3.7% | 2.9%(+0.765)#87 | 2.1%(+1.54)#3,325 |
| 7. | 80919 | 3.3% | 2.9%(+0.404)#103 | 2.1%(+1.18)#4,134 |
| 8. | 80925 | 3.1% | 2.9%(+0.133)#116 | 2.1%(+0.905)#4,872 |
| 9. | 80918 | 3.0% | 2.9%(+0.119)#117 | 2.1%(+0.891)#4,924 |
| 10. | 80923 | 2.9% | 2.9%(+0.026)#126 | 2.1%(+0.798)#5,246 |
| 11. | 80922 | 2.4% | 2.9%(-0.474)#166 | 2.1%(+0.298)#7,240 |
| 12. | 80905 | 2.4% | 2.9%(-0.514)#167 | 2.1%(+0.258)#7,453 |
| 13. | 80907 | 2.4% | 2.9%(-0.562)#171 | 2.1%(+0.211)#7,668 |
| 14. | 80904 | 2.2% | 2.9%(-0.673)#177 | 2.1%(+0.099)#8,211 |
| 15. | 80906 | 2.2% | 2.9%(-0.730)#179 | 2.1%(+0.042)#8,519 |
| 16. | 80917 | 2.1% | 2.9%(-0.848)#190 | 2.1%(-0.075)#9,184 |
| 17. | 80909 | 2.1% | 2.9%(-0.855)#191 | 2.1%(-0.082)#9,226 |
| 18. | 80915 | 2.1% | 2.9%(-0.868)#193 | 2.1%(-0.096)#9,300 |
| 19. | 80927 | 1.9% | 2.9%(-1.05)#203 | 2.1%(-0.276)#10,415 |
| 20. | 80903 | 1.9% | 2.9%(-1.05)#204 | 2.1%(-0.282)#10,443 |
| 21. | 80902 | 1.2% | 2.9%(-1.68)#258 | 2.1%(-0.905)#14,724 |
| 22. | 80910 | 1.1% | 2.9%(-1.84)#274 | 2.1%(-1.07)#16,004 |
| 23. | 80916 | 1.1% | 2.9%(-1.86)#277 | 2.1%(-1.09)#16,173 |
| 24. | 80911 | 1.0% | 2.9%(-1.90)#278 | 2.1%(-1.12)#16,422 |
| 25. | 80926 | 0.89% | 2.9%(-2.03)#292 | 2.1%(-1.26)#17,429 |
1
Common Questions
What are the Top 10 Zip Codes with the Highest Percentage of Population Employed in Architecture & Engineering in Colorado Springs, CO?
Top 10 Zip Codes with the Highest Percentage of Population Employed in Architecture & Engineering in Colorado Springs, CO are:
What zip code has the Highest Percentage of Population Employed in Architecture & Engineering in Colorado Springs, CO?
80951 has the Highest Percentage of Population Employed in Architecture & Engineering in Colorado Springs, CO with 8.2%.
What is the Percentage of Population Employed in Architecture & Engineering in Colorado Springs, CO?
Percentage of Population Employed in Architecture & Engineering in Colorado Springs is 2.7%.
What is the Percentage of Population Employed in Architecture & Engineering in Colorado?
Percentage of Population Employed in Architecture & Engineering in Colorado is 2.9%.
What is the Percentage of Population Employed in Architecture & Engineering in the United States?
Percentage of Population Employed in Architecture & Engineering in the United States is 2.1%.