Zip Codes with the Highest Percentage of Population Employed in Administrative & Support Services in Whittier, CA
RELATED REPORTS & OPTIONS
Administrative & Support Services
Whittier
Compare Zip Codes
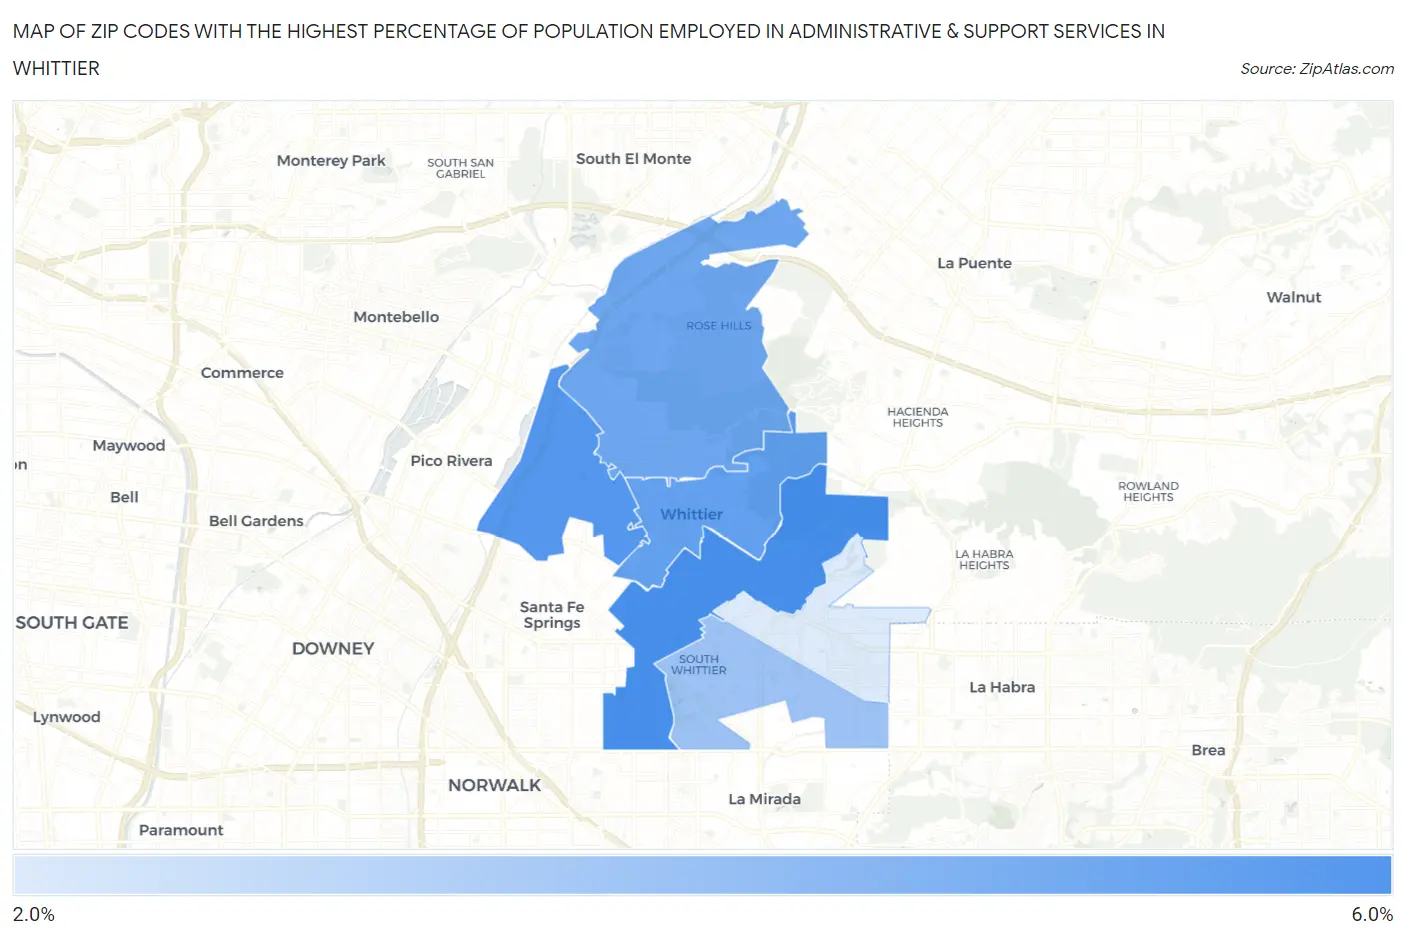
Map of Zip Codes with the Highest Percentage of Population Employed in Administrative & Support Services in Whittier
2.5%
5.5%
Zip Codes with the Highest Percentage of Population Employed in Administrative & Support Services in Whittier, CA
| Zip Code | % Employed | vs State | vs National | |
| 1. | 90605 | 5.5% | 4.6%(+0.955)#435 | 4.1%(+1.38)#5,776 |
| 2. | 90606 | 5.3% | 4.6%(+0.693)#474 | 4.1%(+1.11)#6,438 |
| 3. | 90602 | 4.9% | 4.6%(+0.370)#539 | 4.1%(+0.789)#7,280 |
| 4. | 90601 | 4.7% | 4.6%(+0.153)#603 | 4.1%(+0.573)#7,957 |
| 5. | 90604 | 3.9% | 4.6%(-0.713)#819 | 4.1%(-0.293)#11,292 |
| 6. | 90603 | 2.5% | 4.6%(-2.07)#1,210 | 4.1%(-1.65)#18,165 |
1
Common Questions
What are the Top 5 Zip Codes with the Highest Percentage of Population Employed in Administrative & Support Services in Whittier, CA?
Top 5 Zip Codes with the Highest Percentage of Population Employed in Administrative & Support Services in Whittier, CA are:
What zip code has the Highest Percentage of Population Employed in Administrative & Support Services in Whittier, CA?
90605 has the Highest Percentage of Population Employed in Administrative & Support Services in Whittier, CA with 5.5%.
What is the Percentage of Population Employed in Administrative & Support Services in Whittier, CA?
Percentage of Population Employed in Administrative & Support Services in Whittier is 3.8%.
What is the Percentage of Population Employed in Administrative & Support Services in California?
Percentage of Population Employed in Administrative & Support Services in California is 4.6%.
What is the Percentage of Population Employed in Administrative & Support Services in the United States?
Percentage of Population Employed in Administrative & Support Services in the United States is 4.1%.