Zip Codes with the Highest Percentage of Population Employed in Administrative & Support Services in Chula Vista, CA
RELATED REPORTS & OPTIONS
Administrative & Support Services
Chula Vista
Compare Zip Codes
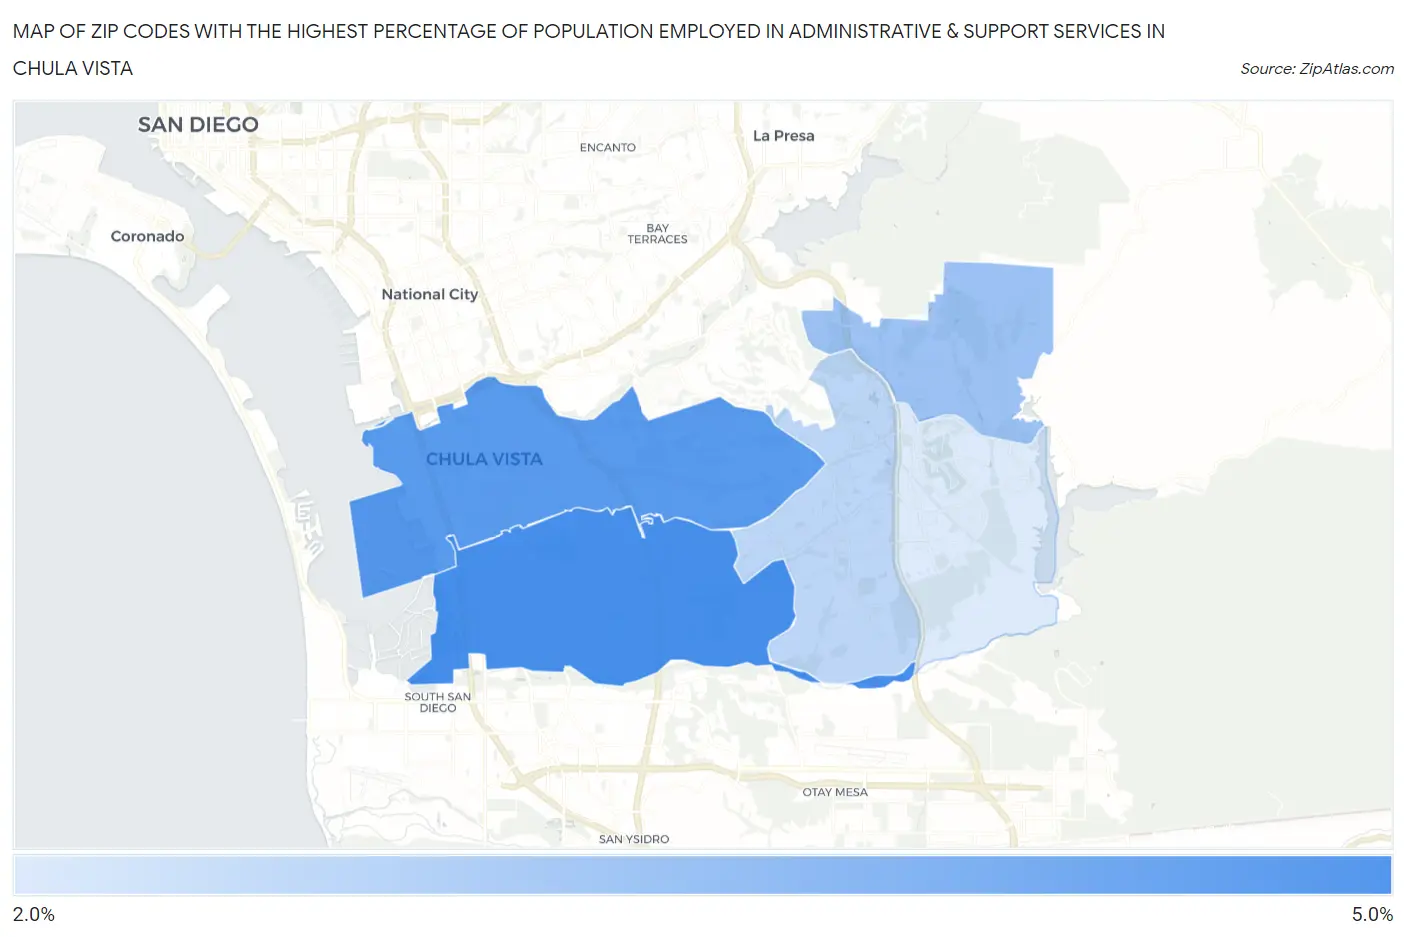
Map of Zip Codes with the Highest Percentage of Population Employed in Administrative & Support Services in Chula Vista
2.1%
4.8%
Zip Codes with the Highest Percentage of Population Employed in Administrative & Support Services in Chula Vista, CA
| Zip Code | % Employed | vs State | vs National | |
| 1. | 91911 | 4.8% | 4.6%(+0.277)#573 | 4.1%(+0.697)#7,584 |
| 2. | 91910 | 4.5% | 4.6%(-0.029)#648 | 4.1%(+0.390)#8,592 |
| 3. | 91914 | 3.3% | 4.6%(-1.30)#986 | 4.1%(-0.885)#14,129 |
| 4. | 91913 | 2.7% | 4.6%(-1.88)#1,157 | 4.1%(-1.46)#17,162 |
| 5. | 91915 | 2.1% | 4.6%(-2.48)#1,311 | 4.1%(-2.06)#20,179 |
1
Common Questions
What are the Top 3 Zip Codes with the Highest Percentage of Population Employed in Administrative & Support Services in Chula Vista, CA?
Top 3 Zip Codes with the Highest Percentage of Population Employed in Administrative & Support Services in Chula Vista, CA are:
What zip code has the Highest Percentage of Population Employed in Administrative & Support Services in Chula Vista, CA?
91911 has the Highest Percentage of Population Employed in Administrative & Support Services in Chula Vista, CA with 4.8%.
What is the Percentage of Population Employed in Administrative & Support Services in Chula Vista, CA?
Percentage of Population Employed in Administrative & Support Services in Chula Vista is 3.8%.
What is the Percentage of Population Employed in Administrative & Support Services in California?
Percentage of Population Employed in Administrative & Support Services in California is 4.6%.
What is the Percentage of Population Employed in Administrative & Support Services in the United States?
Percentage of Population Employed in Administrative & Support Services in the United States is 4.1%.