Zip Codes with the Highest Percentage of Population with a Degree in Science and Engineering in Whittier, CA
RELATED REPORTS & OPTIONS
Science and Engineering
Whittier
Compare Zip Codes
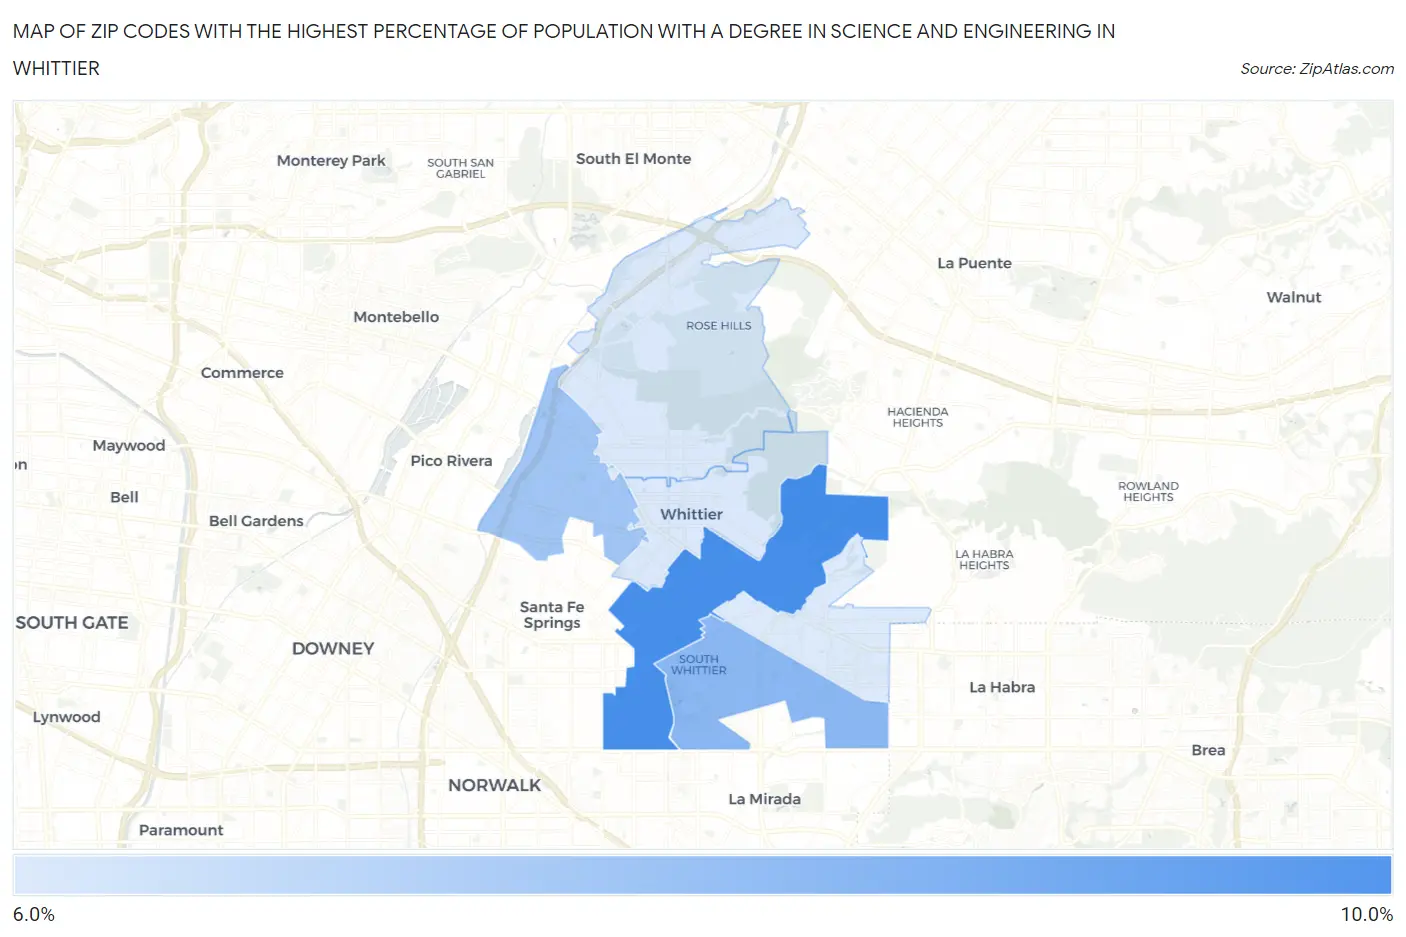
Map of Zip Codes with the Highest Percentage of Population with a Degree in Science and Engineering in Whittier
6.5%
9.9%
Zip Codes with the Highest Percentage of Population with a Degree in Science and Engineering in Whittier, CA
| Zip Code | % Graduates | vs State | vs National | |
| 1. | 90605 | 9.9% | 8.3%(+1.65)#487 | 9.8%(+0.128)#15,232 |
| 2. | 90604 | 8.4% | 8.3%(+0.106)#720 | 9.8%(-1.41)#18,780 |
| 3. | 90606 | 7.8% | 8.3%(-0.434)#830 | 9.8%(-1.95)#20,035 |
| 4. | 90602 | 6.5% | 8.3%(-1.73)#1,062 | 9.8%(-3.25)#22,537 |
| 5. | 90601 | 6.5% | 8.3%(-1.73)#1,064 | 9.8%(-3.25)#22,543 |
| 6. | 90603 | 6.5% | 8.3%(-1.77)#1,075 | 9.8%(-3.29)#22,612 |
1
Common Questions
What are the Top 5 Zip Codes with the Highest Percentage of Population with a Degree in Science and Engineering in Whittier, CA?
Top 5 Zip Codes with the Highest Percentage of Population with a Degree in Science and Engineering in Whittier, CA are:
What zip code has the Highest Percentage of Population with a Degree in Science and Engineering in Whittier, CA?
90605 has the Highest Percentage of Population with a Degree in Science and Engineering in Whittier, CA with 9.9%.
What is the Percentage of Population with a Degree in Science and Engineering in Whittier, CA?
Percentage of Population with a Degree in Science and Engineering in Whittier is 6.4%.
What is the Percentage of Population with a Degree in Science and Engineering in California?
Percentage of Population with a Degree in Science and Engineering in California is 8.3%.
What is the Percentage of Population with a Degree in Science and Engineering in the United States?
Percentage of Population with a Degree in Science and Engineering in the United States is 9.8%.