Zip Codes with the Highest Percentage of Population Employed in Administrative & Support Services in San Diego, CA
RELATED REPORTS & OPTIONS
Administrative & Support Services
San Diego
Compare Zip Codes
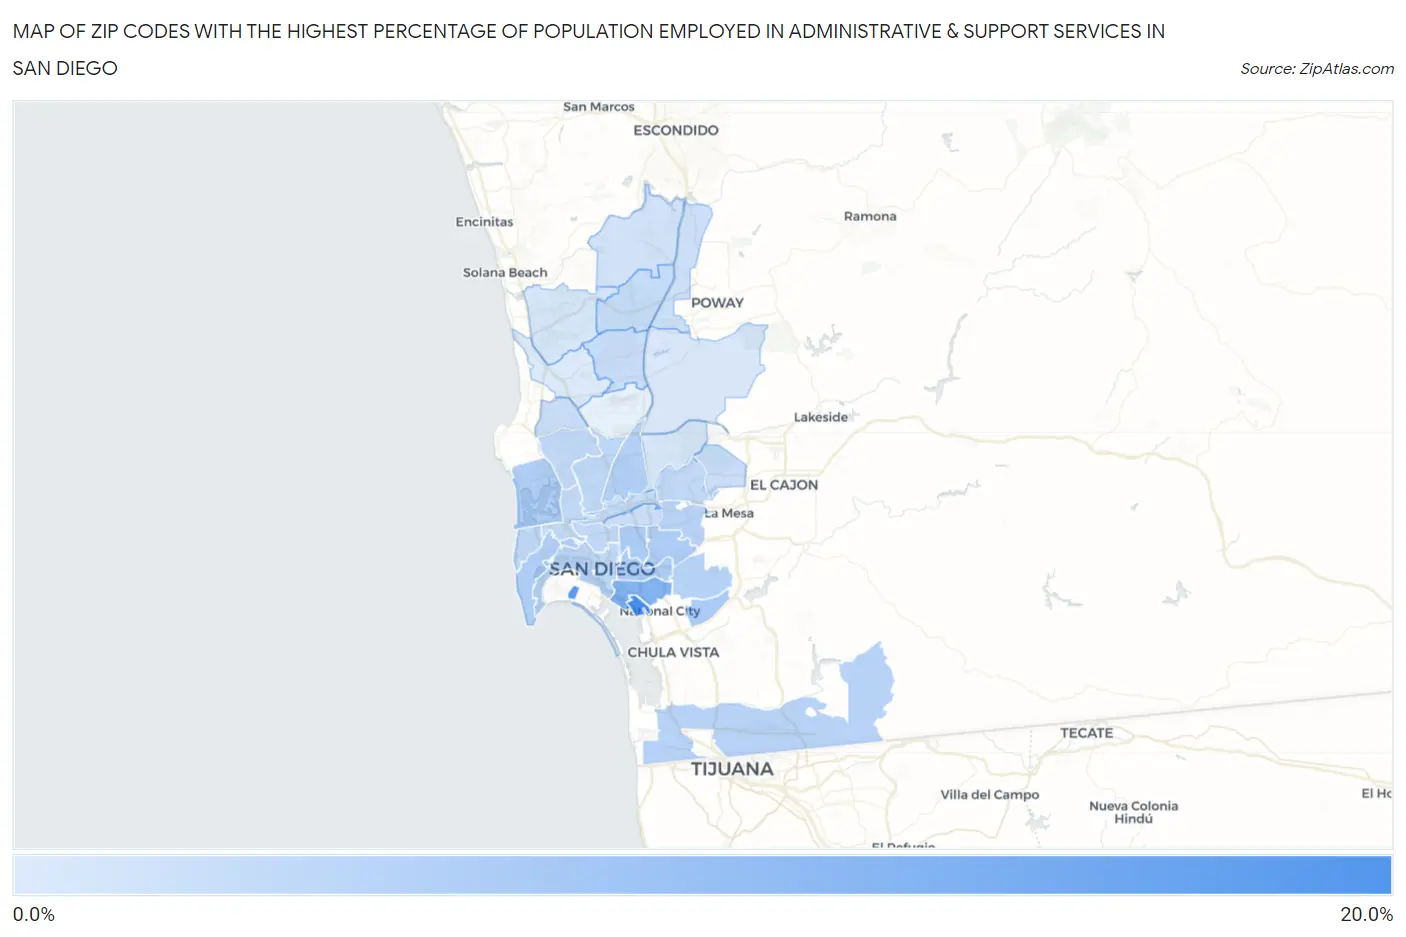
Map of Zip Codes with the Highest Percentage of Population Employed in Administrative & Support Services in San Diego
1.0%
17.6%
Zip Codes with the Highest Percentage of Population Employed in Administrative & Support Services in San Diego, CA
| Zip Code | % Employed | vs State | vs National | |
| 1. | 92136 | 17.6% | 4.6%(+13.0)#22 | 4.1%(+13.4)#373 |
| 2. | 92135 | 15.8% | 4.6%(+11.2)#31 | 4.1%(+11.6)#476 |
| 3. | 92113 | 10.6% | 4.6%(+6.03)#79 | 4.1%(+6.45)#1,124 |
| 4. | 92139 | 6.3% | 4.6%(+1.72)#306 | 4.1%(+2.14)#4,262 |
| 5. | 92104 | 6.2% | 4.6%(+1.66)#313 | 4.1%(+2.08)#4,360 |
| 6. | 92105 | 6.2% | 4.6%(+1.61)#320 | 4.1%(+2.03)#4,456 |
| 7. | 92102 | 6.1% | 4.6%(+1.48)#337 | 4.1%(+1.90)#4,686 |
| 8. | 92106 | 5.9% | 4.6%(+1.35)#358 | 4.1%(+1.77)#4,927 |
| 9. | 92140 | 5.8% | 4.6%(+1.23)#383 | 4.1%(+1.65)#5,155 |
| 10. | 92109 | 5.5% | 4.6%(+0.971)#430 | 4.1%(+1.39)#5,729 |
| 11. | 92123 | 5.4% | 4.6%(+0.848)#448 | 4.1%(+1.27)#6,031 |
| 12. | 92114 | 5.1% | 4.6%(+0.565)#495 | 4.1%(+0.984)#6,747 |
| 13. | 92154 | 5.0% | 4.6%(+0.390)#530 | 4.1%(+0.810)#7,211 |
| 14. | 92115 | 4.8% | 4.6%(+0.212)#591 | 4.1%(+0.631)#7,785 |
| 15. | 92107 | 4.2% | 4.6%(-0.350)#734 | 4.1%(+0.070)#9,747 |
| 16. | 92111 | 4.2% | 4.6%(-0.357)#735 | 4.1%(+0.063)#9,770 |
| 17. | 92101 | 4.2% | 4.6%(-0.383)#745 | 4.1%(+0.037)#9,886 |
| 18. | 92103 | 3.9% | 4.6%(-0.652)#808 | 4.1%(-0.233)#11,020 |
| 19. | 92117 | 3.9% | 4.6%(-0.716)#821 | 4.1%(-0.296)#11,307 |
| 20. | 92120 | 3.8% | 4.6%(-0.771)#838 | 4.1%(-0.352)#11,538 |
| 21. | 92110 | 3.7% | 4.6%(-0.911)#878 | 4.1%(-0.491)#12,194 |
| 22. | 92129 | 3.3% | 4.6%(-1.24)#974 | 4.1%(-0.823)#13,808 |
| 23. | 92126 | 3.2% | 4.6%(-1.39)#1,018 | 4.1%(-0.973)#14,588 |
| 24. | 92108 | 3.1% | 4.6%(-1.50)#1,053 | 4.1%(-1.08)#15,129 |
| 25. | 92116 | 3.0% | 4.6%(-1.54)#1,068 | 4.1%(-1.12)#15,339 |
| 26. | 92119 | 3.0% | 4.6%(-1.58)#1,081 | 4.1%(-1.16)#15,521 |
| 27. | 92122 | 2.9% | 4.6%(-1.68)#1,115 | 4.1%(-1.26)#16,036 |
| 28. | 92128 | 2.8% | 4.6%(-1.78)#1,136 | 4.1%(-1.36)#16,594 |
| 29. | 92127 | 2.2% | 4.6%(-2.33)#1,281 | 4.1%(-1.91)#19,483 |
| 30. | 92130 | 1.7% | 4.6%(-2.92)#1,383 | 4.1%(-2.50)#22,153 |
| 31. | 92124 | 1.6% | 4.6%(-2.97)#1,392 | 4.1%(-2.55)#22,371 |
| 32. | 92131 | 1.6% | 4.6%(-2.98)#1,394 | 4.1%(-2.56)#22,403 |
| 33. | 92121 | 1.0% | 4.6%(-3.52)#1,448 | 4.1%(-3.10)#24,334 |
1
Common Questions
What are the Top 10 Zip Codes with the Highest Percentage of Population Employed in Administrative & Support Services in San Diego, CA?
Top 10 Zip Codes with the Highest Percentage of Population Employed in Administrative & Support Services in San Diego, CA are:
What zip code has the Highest Percentage of Population Employed in Administrative & Support Services in San Diego, CA?
92136 has the Highest Percentage of Population Employed in Administrative & Support Services in San Diego, CA with 17.6%.
What is the Percentage of Population Employed in Administrative & Support Services in San Diego, CA?
Percentage of Population Employed in Administrative & Support Services in San Diego is 4.3%.
What is the Percentage of Population Employed in Administrative & Support Services in California?
Percentage of Population Employed in Administrative & Support Services in California is 4.6%.
What is the Percentage of Population Employed in Administrative & Support Services in the United States?
Percentage of Population Employed in Administrative & Support Services in the United States is 4.1%.