Zip Codes with the Highest Percentage of Population Employed in Administrative & Support Services in Los Angeles, CA
RELATED REPORTS & OPTIONS
Administrative & Support Services
Los Angeles
Compare Zip Codes
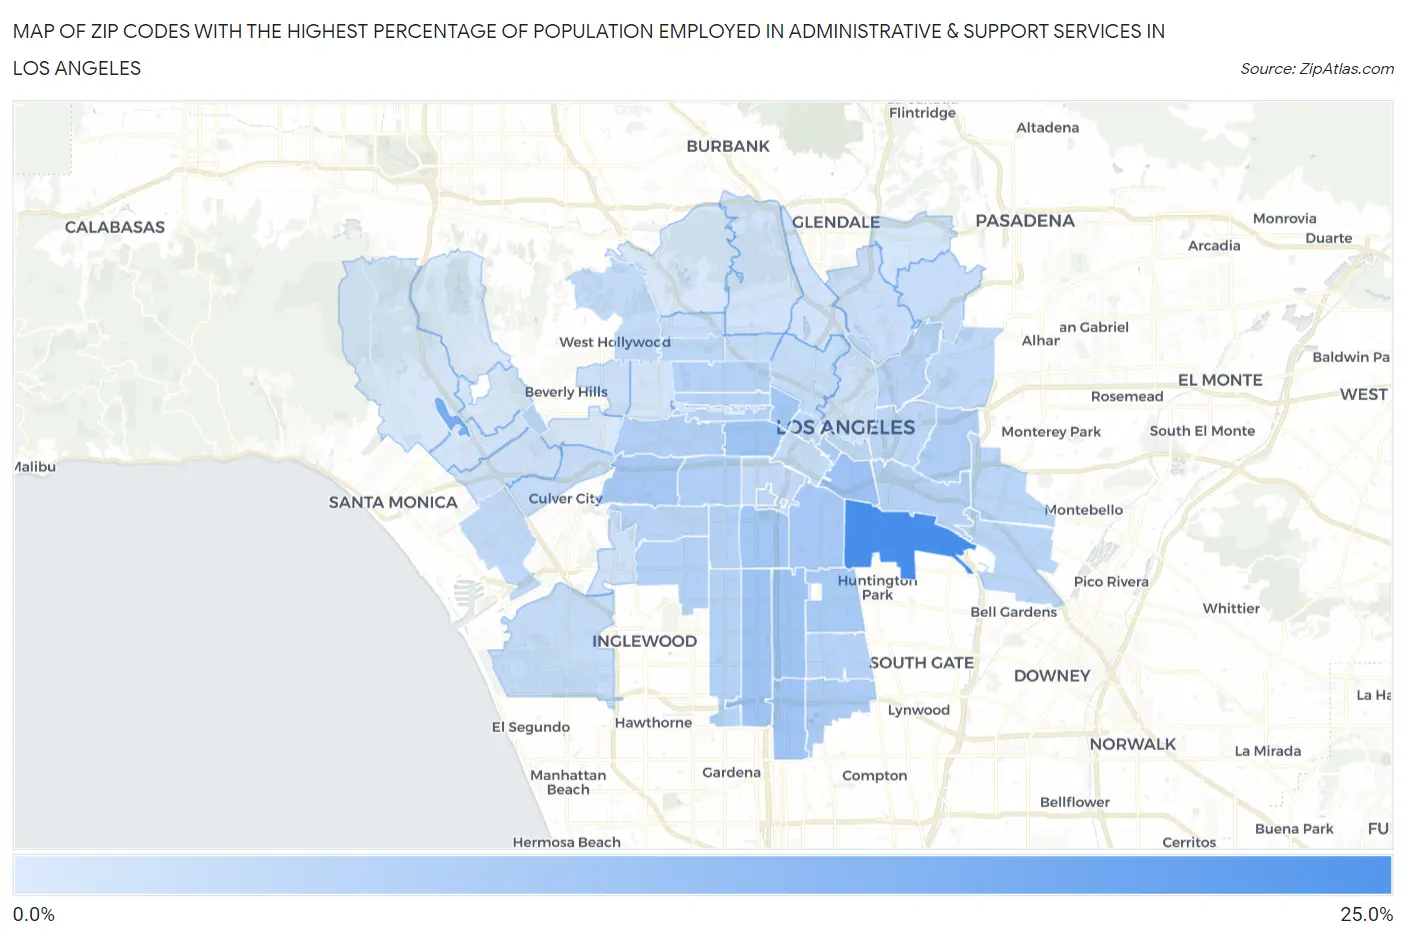
Map of Zip Codes with the Highest Percentage of Population Employed in Administrative & Support Services in Los Angeles
1.2%
21.2%
Zip Codes with the Highest Percentage of Population Employed in Administrative & Support Services in Los Angeles, CA
| Zip Code | % Employed | vs State | vs National | |
| 1. | 90058 | 21.2% | 4.6%(+16.6)#15 | 4.1%(+17.1)#258 |
| 2. | 90073 | 14.3% | 4.6%(+9.72)#42 | 4.1%(+10.1)#594 |
| 3. | 90021 | 9.7% | 4.6%(+5.18)#91 | 4.1%(+5.60)#1,374 |
| 4. | 90044 | 9.1% | 4.6%(+4.57)#109 | 4.1%(+4.99)#1,622 |
| 5. | 90003 | 9.1% | 4.6%(+4.48)#112 | 4.1%(+4.90)#1,663 |
| 6. | 90006 | 9.0% | 4.6%(+4.39)#116 | 4.1%(+4.81)#1,709 |
| 7. | 90061 | 8.7% | 4.6%(+4.12)#122 | 4.1%(+4.54)#1,857 |
| 8. | 90057 | 8.5% | 4.6%(+3.93)#128 | 4.1%(+4.35)#1,967 |
| 9. | 90037 | 8.4% | 4.6%(+3.82)#130 | 4.1%(+4.24)#2,030 |
| 10. | 90016 | 8.1% | 4.6%(+3.52)#148 | 4.1%(+3.94)#2,213 |
| 11. | 90011 | 8.0% | 4.6%(+3.47)#150 | 4.1%(+3.89)#2,247 |
| 12. | 90001 | 7.9% | 4.6%(+3.30)#161 | 4.1%(+3.72)#2,376 |
| 13. | 90059 | 7.4% | 4.6%(+2.86)#187 | 4.1%(+3.28)#2,759 |
| 14. | 90014 | 7.3% | 4.6%(+2.69)#202 | 4.1%(+3.11)#2,919 |
| 15. | 90063 | 6.9% | 4.6%(+2.29)#242 | 4.1%(+2.71)#3,400 |
| 16. | 90018 | 6.8% | 4.6%(+2.20)#250 | 4.1%(+2.62)#3,522 |
| 17. | 90019 | 6.7% | 4.6%(+2.14)#257 | 4.1%(+2.56)#3,605 |
| 18. | 90043 | 6.5% | 4.6%(+1.89)#289 | 4.1%(+2.31)#3,966 |
| 19. | 90062 | 6.2% | 4.6%(+1.60)#321 | 4.1%(+2.02)#4,478 |
| 20. | 90002 | 6.1% | 4.6%(+1.56)#326 | 4.1%(+1.98)#4,532 |
| 21. | 90005 | 6.1% | 4.6%(+1.54)#329 | 4.1%(+1.96)#4,568 |
| 22. | 90047 | 6.1% | 4.6%(+1.51)#332 | 4.1%(+1.93)#4,631 |
| 23. | 90004 | 6.0% | 4.6%(+1.46)#339 | 4.1%(+1.88)#4,717 |
| 24. | 90023 | 6.0% | 4.6%(+1.41)#347 | 4.1%(+1.83)#4,830 |
| 25. | 90008 | 5.8% | 4.6%(+1.24)#378 | 4.1%(+1.66)#5,128 |
| 26. | 90067 | 5.8% | 4.6%(+1.20)#390 | 4.1%(+1.62)#5,230 |
| 27. | 90031 | 5.7% | 4.6%(+1.17)#395 | 4.1%(+1.59)#5,271 |
| 28. | 90020 | 5.7% | 4.6%(+1.15)#396 | 4.1%(+1.57)#5,314 |
| 29. | 90040 | 5.6% | 4.6%(+1.06)#409 | 4.1%(+1.48)#5,510 |
| 30. | 90022 | 5.6% | 4.6%(+1.04)#418 | 4.1%(+1.46)#5,575 |
| 31. | 90013 | 5.2% | 4.6%(+0.595)#487 | 4.1%(+1.01)#6,672 |
| 32. | 90038 | 5.2% | 4.6%(+0.589)#491 | 4.1%(+1.01)#6,695 |
| 33. | 90033 | 5.1% | 4.6%(+0.573)#493 | 4.1%(+0.993)#6,732 |
| 34. | 90089 | 5.1% | 4.6%(+0.497)#510 | 4.1%(+0.917)#6,929 |
| 35. | 90017 | 5.0% | 4.6%(+0.442)#518 | 4.1%(+0.862)#7,070 |
| 36. | 90032 | 4.8% | 4.6%(+0.261)#574 | 4.1%(+0.680)#7,629 |
| 37. | 90066 | 4.7% | 4.6%(+0.177)#596 | 4.1%(+0.596)#7,888 |
| 38. | 90007 | 4.6% | 4.6%(+0.037)#629 | 4.1%(+0.457)#8,355 |
| 39. | 90046 | 4.5% | 4.6%(-0.080)#656 | 4.1%(+0.340)#8,753 |
| 40. | 90015 | 4.4% | 4.6%(-0.162)#673 | 4.1%(+0.258)#9,052 |
| 41. | 90045 | 4.1% | 4.6%(-0.519)#767 | 4.1%(-0.099)#10,465 |
| 42. | 90026 | 4.0% | 4.6%(-0.584)#788 | 4.1%(-0.165)#10,768 |
| 43. | 90029 | 3.9% | 4.6%(-0.642)#805 | 4.1%(-0.223)#10,980 |
| 44. | 90042 | 3.9% | 4.6%(-0.667)#810 | 4.1%(-0.248)#11,103 |
| 45. | 90034 | 3.7% | 4.6%(-0.825)#850 | 4.1%(-0.405)#11,791 |
| 46. | 90028 | 3.7% | 4.6%(-0.899)#874 | 4.1%(-0.479)#12,143 |
| 47. | 90065 | 3.6% | 4.6%(-1.01)#910 | 4.1%(-0.593)#12,682 |
| 48. | 90048 | 3.2% | 4.6%(-1.40)#1,020 | 4.1%(-0.977)#14,611 |
| 49. | 90012 | 3.0% | 4.6%(-1.56)#1,073 | 4.1%(-1.14)#15,434 |
| 50. | 90056 | 2.8% | 4.6%(-1.76)#1,133 | 4.1%(-1.34)#16,496 |
| 51. | 90064 | 2.8% | 4.6%(-1.79)#1,143 | 4.1%(-1.37)#16,668 |
| 52. | 90039 | 2.6% | 4.6%(-1.99)#1,179 | 4.1%(-1.57)#17,693 |
| 53. | 90027 | 2.5% | 4.6%(-2.08)#1,211 | 4.1%(-1.66)#18,175 |
| 54. | 90036 | 2.4% | 4.6%(-2.14)#1,224 | 4.1%(-1.72)#18,479 |
| 55. | 90041 | 2.4% | 4.6%(-2.16)#1,232 | 4.1%(-1.74)#18,614 |
| 56. | 90025 | 2.2% | 4.6%(-2.33)#1,277 | 4.1%(-1.91)#19,447 |
| 57. | 90049 | 1.9% | 4.6%(-2.65)#1,337 | 4.1%(-2.23)#21,008 |
| 58. | 90068 | 1.9% | 4.6%(-2.71)#1,347 | 4.1%(-2.29)#21,242 |
| 59. | 90010 | 1.8% | 4.6%(-2.75)#1,356 | 4.1%(-2.33)#21,416 |
| 60. | 90035 | 1.8% | 4.6%(-2.75)#1,357 | 4.1%(-2.33)#21,431 |
| 61. | 90024 | 1.8% | 4.6%(-2.80)#1,367 | 4.1%(-2.38)#21,642 |
| 62. | 90077 | 1.2% | 4.6%(-3.35)#1,433 | 4.1%(-2.93)#23,788 |
1
Common Questions
What are the Top 10 Zip Codes with the Highest Percentage of Population Employed in Administrative & Support Services in Los Angeles, CA?
Top 10 Zip Codes with the Highest Percentage of Population Employed in Administrative & Support Services in Los Angeles, CA are:
What zip code has the Highest Percentage of Population Employed in Administrative & Support Services in Los Angeles, CA?
90058 has the Highest Percentage of Population Employed in Administrative & Support Services in Los Angeles, CA with 21.2%.
What is the Percentage of Population Employed in Administrative & Support Services in Los Angeles, CA?
Percentage of Population Employed in Administrative & Support Services in Los Angeles is 5.2%.
What is the Percentage of Population Employed in Administrative & Support Services in California?
Percentage of Population Employed in Administrative & Support Services in California is 4.6%.
What is the Percentage of Population Employed in Administrative & Support Services in the United States?
Percentage of Population Employed in Administrative & Support Services in the United States is 4.1%.