Zip Codes with the Highest Percentage of Population Employed in Computer, Engineering & Science in Whittier, CA
RELATED REPORTS & OPTIONS
Computer, Engineering & Science
Whittier
Compare Zip Codes
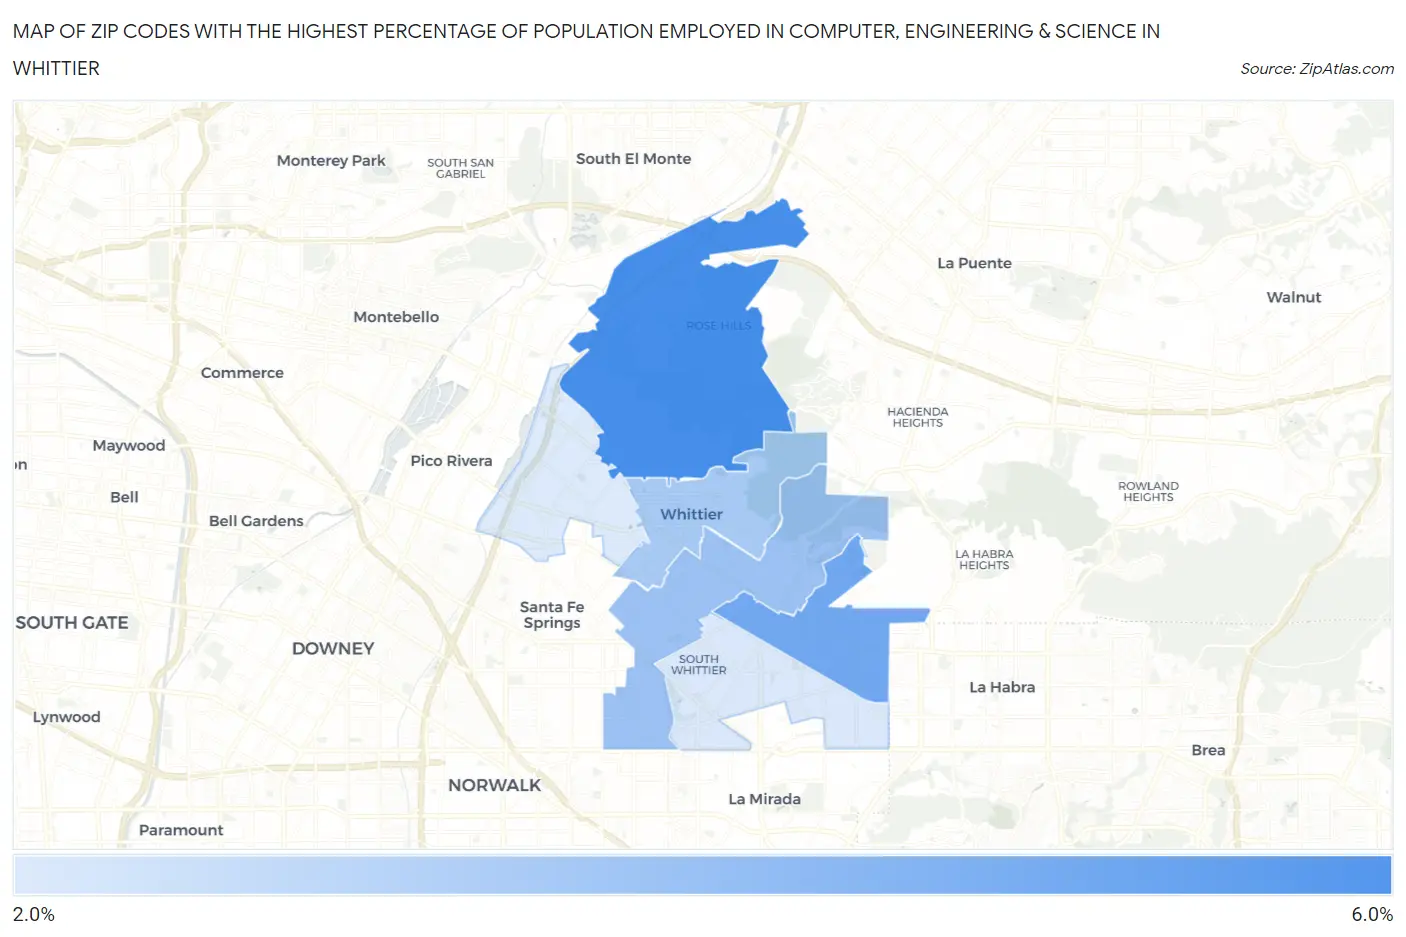
Map of Zip Codes with the Highest Percentage of Population Employed in Computer, Engineering & Science in Whittier
2.6%
5.2%
Zip Codes with the Highest Percentage of Population Employed in Computer, Engineering & Science in Whittier, CA
| Zip Code | % Employed | vs State | vs National | |
| 1. | 90601 | 5.2% | 8.0%(-2.75)#841 | 6.8%(-1.55)#10,787 |
| 2. | 90603 | 4.5% | 8.0%(-3.50)#961 | 6.8%(-2.30)#12,912 |
| 3. | 90605 | 3.7% | 8.0%(-4.22)#1,056 | 6.8%(-3.02)#15,326 |
| 4. | 90602 | 3.5% | 8.0%(-4.47)#1,104 | 6.8%(-3.27)#16,284 |
| 5. | 90604 | 2.6% | 8.0%(-5.34)#1,245 | 6.8%(-4.14)#19,530 |
| 6. | 90606 | 2.6% | 8.0%(-5.38)#1,256 | 6.8%(-4.19)#19,744 |
1
Common Questions
What are the Top 5 Zip Codes with the Highest Percentage of Population Employed in Computer, Engineering & Science in Whittier, CA?
Top 5 Zip Codes with the Highest Percentage of Population Employed in Computer, Engineering & Science in Whittier, CA are:
What zip code has the Highest Percentage of Population Employed in Computer, Engineering & Science in Whittier, CA?
90601 has the Highest Percentage of Population Employed in Computer, Engineering & Science in Whittier, CA with 5.2%.
What is the Percentage of Population Employed in Computer, Engineering & Science in Whittier, CA?
Percentage of Population Employed in Computer, Engineering & Science in Whittier is 4.4%.
What is the Percentage of Population Employed in Computer, Engineering & Science in California?
Percentage of Population Employed in Computer, Engineering & Science in California is 8.0%.
What is the Percentage of Population Employed in Computer, Engineering & Science in the United States?
Percentage of Population Employed in Computer, Engineering & Science in the United States is 6.8%.