Zip Codes with the Highest Percentage of Population Employed in Community & Social Service in Whittier, CA
RELATED REPORTS & OPTIONS
Community & Social Service
Whittier
Compare Zip Codes
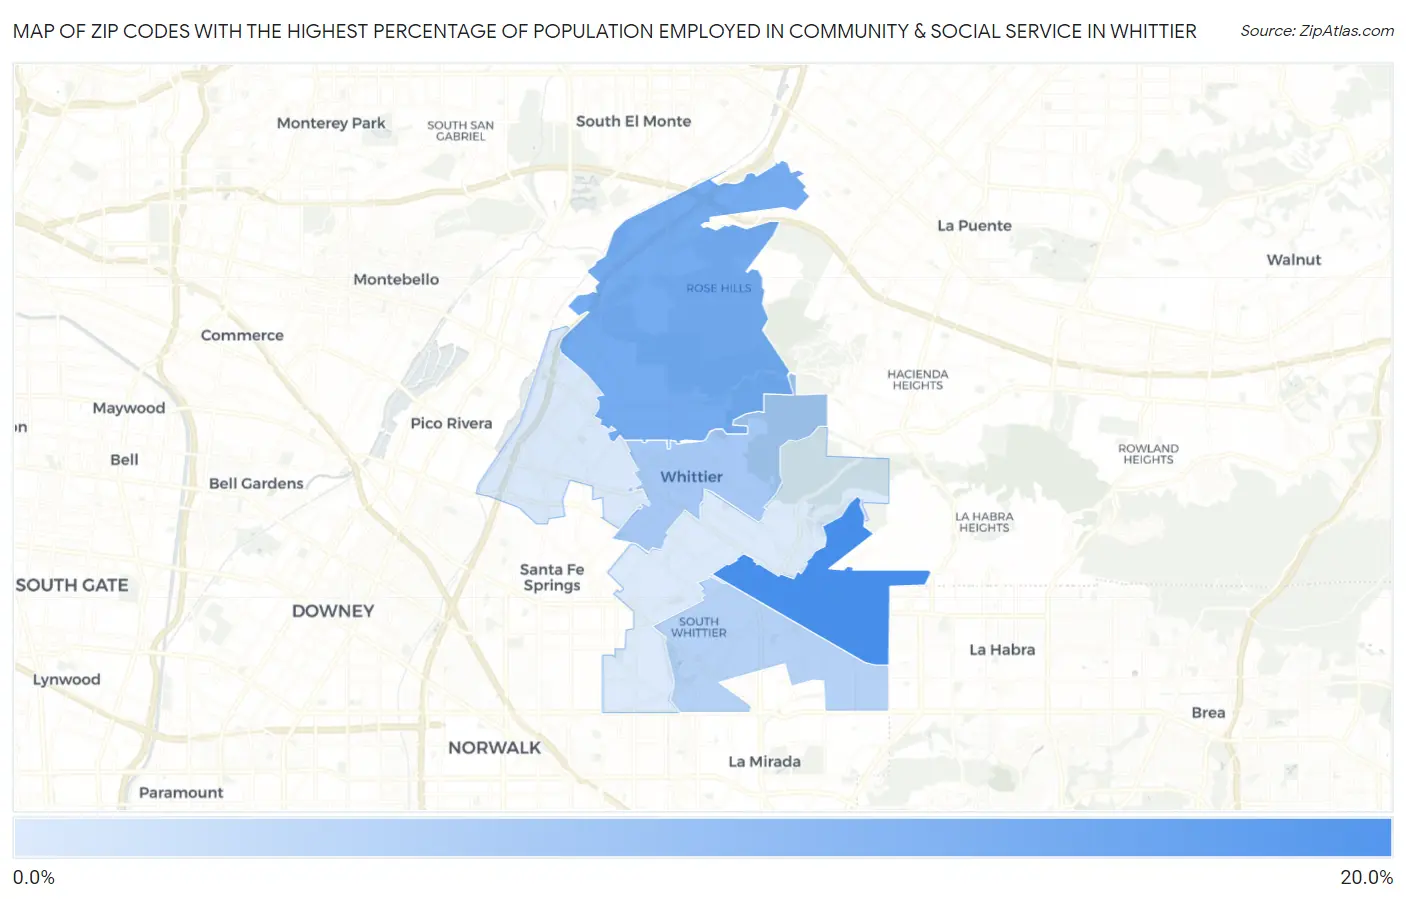
Map of Zip Codes with the Highest Percentage of Population Employed in Community & Social Service in Whittier
8.4%
16.1%
Zip Codes with the Highest Percentage of Population Employed in Community & Social Service in Whittier, CA
| Zip Code | % Employed | vs State | vs National | |
| 1. | 90603 | 16.1% | 11.5%(+4.64)#306 | 11.2%(+4.91)#3,970 |
| 2. | 90601 | 13.7% | 11.5%(+2.23)#474 | 11.2%(+2.50)#6,455 |
| 3. | 90602 | 11.2% | 11.5%(-0.280)#770 | 11.2%(-0.010)#11,115 |
| 4. | 90604 | 10.3% | 11.5%(-1.14)#876 | 11.2%(-0.873)#13,255 |
| 5. | 90606 | 8.7% | 11.5%(-2.82)#1,089 | 11.2%(-2.55)#17,716 |
| 6. | 90605 | 8.4% | 11.5%(-3.07)#1,117 | 11.2%(-2.80)#18,434 |
1
Common Questions
What are the Top 5 Zip Codes with the Highest Percentage of Population Employed in Community & Social Service in Whittier, CA?
Top 5 Zip Codes with the Highest Percentage of Population Employed in Community & Social Service in Whittier, CA are:
What zip code has the Highest Percentage of Population Employed in Community & Social Service in Whittier, CA?
90603 has the Highest Percentage of Population Employed in Community & Social Service in Whittier, CA with 16.1%.
What is the Percentage of Population Employed in Community & Social Service in Whittier, CA?
Percentage of Population Employed in Community & Social Service in Whittier is 13.3%.
What is the Percentage of Population Employed in Community & Social Service in California?
Percentage of Population Employed in Community & Social Service in California is 11.5%.
What is the Percentage of Population Employed in Community & Social Service in the United States?
Percentage of Population Employed in Community & Social Service in the United States is 11.2%.