Zip Codes with the Highest Percentage of Population with a Degree in Visual and Performing Arts in Whittier, CA
RELATED REPORTS & OPTIONS
Visual and Performing Arts
Whittier
Compare Zip Codes
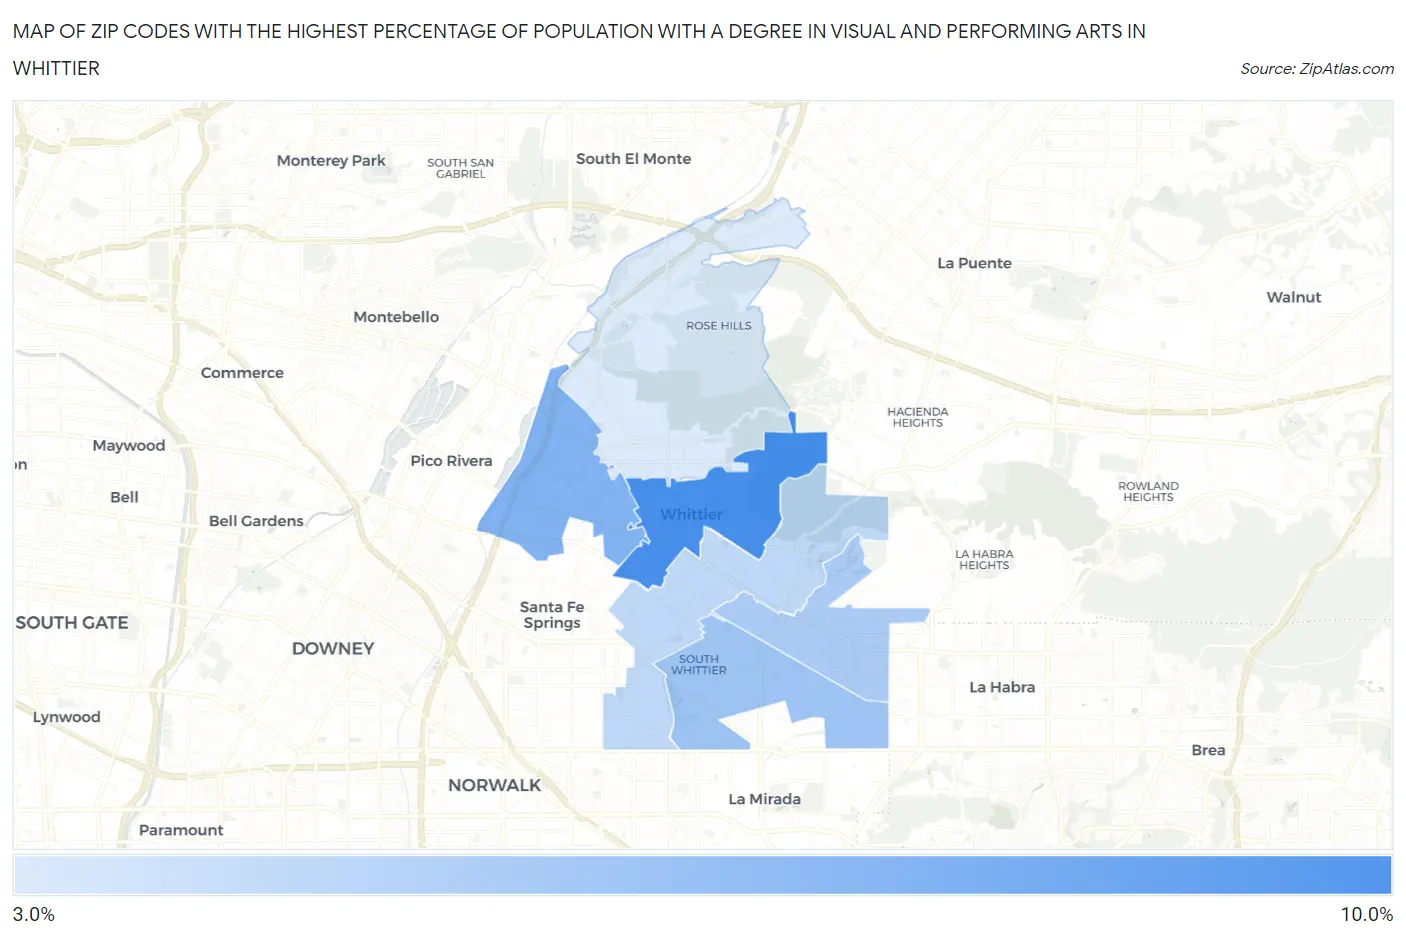
Map of Zip Codes with the Highest Percentage of Population with a Degree in Visual and Performing Arts in Whittier
3.3%
8.6%
Zip Codes with the Highest Percentage of Population with a Degree in Visual and Performing Arts in Whittier, CA
| Zip Code | % Graduates | vs State | vs National | |
| 1. | 90602 | 8.6% | 5.7%(+2.82)#280 | 4.3%(+4.31)#2,488 |
| 2. | 90606 | 6.5% | 5.7%(+0.742)#459 | 4.3%(+2.23)#4,251 |
| 3. | 90604 | 5.5% | 5.7%(-0.272)#585 | 4.3%(+1.22)#5,740 |
| 4. | 90603 | 5.0% | 5.7%(-0.725)#655 | 4.3%(+0.762)#6,594 |
| 5. | 90605 | 4.3% | 5.7%(-1.47)#807 | 4.3%(+0.015)#8,445 |
| 6. | 90601 | 3.3% | 5.7%(-2.48)#1,042 | 4.3%(-0.988)#11,748 |
1
Common Questions
What are the Top 5 Zip Codes with the Highest Percentage of Population with a Degree in Visual and Performing Arts in Whittier, CA?
Top 5 Zip Codes with the Highest Percentage of Population with a Degree in Visual and Performing Arts in Whittier, CA are:
What zip code has the Highest Percentage of Population with a Degree in Visual and Performing Arts in Whittier, CA?
90602 has the Highest Percentage of Population with a Degree in Visual and Performing Arts in Whittier, CA with 8.6%.
What is the Percentage of Population with a Degree in Visual and Performing Arts in Whittier, CA?
Percentage of Population with a Degree in Visual and Performing Arts in Whittier is 6.1%.
What is the Percentage of Population with a Degree in Visual and Performing Arts in California?
Percentage of Population with a Degree in Visual and Performing Arts in California is 5.7%.
What is the Percentage of Population with a Degree in Visual and Performing Arts in the United States?
Percentage of Population with a Degree in Visual and Performing Arts in the United States is 4.3%.