Zip Codes with the Highest Percentage of Population Employed in Administrative & Support Services in Downey, CA
RELATED REPORTS & OPTIONS
Administrative & Support Services
Downey
Compare Zip Codes
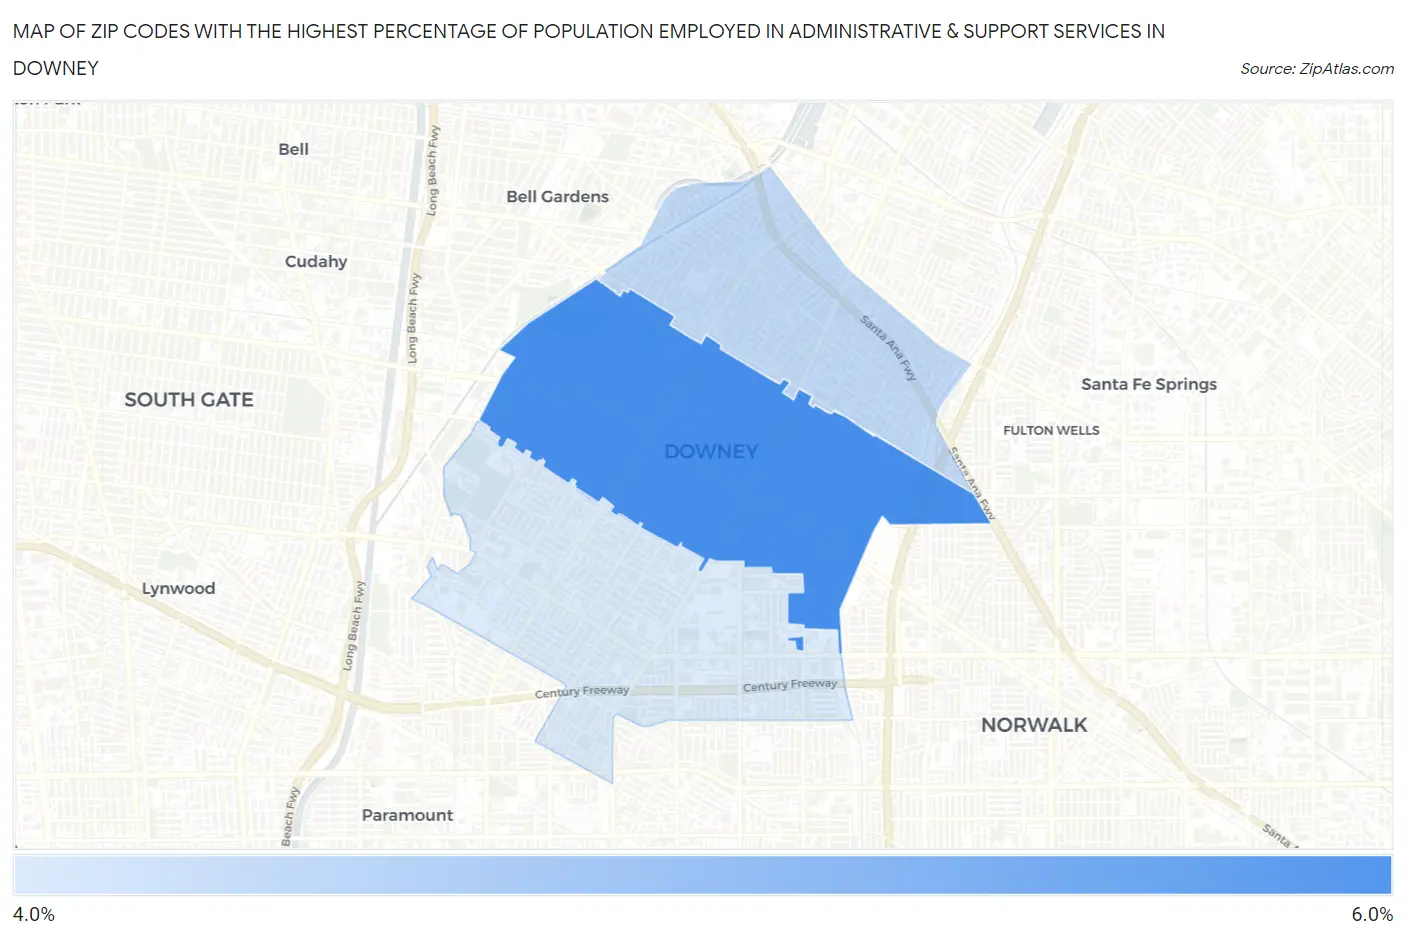
Map of Zip Codes with the Highest Percentage of Population Employed in Administrative & Support Services in Downey
4.9%
5.2%
Zip Codes with the Highest Percentage of Population Employed in Administrative & Support Services in Downey, CA
| Zip Code | % Employed | vs State | vs National | |
| 1. | 90241 | 5.2% | 4.6%(+0.657)#480 | 4.1%(+1.08)#6,538 |
| 2. | 90240 | 5.0% | 4.6%(+0.382)#535 | 4.1%(+0.802)#7,240 |
| 3. | 90242 | 4.9% | 4.6%(+0.318)#562 | 4.1%(+0.738)#7,444 |
1
Common Questions
What are the Top Zip Codes with the Highest Percentage of Population Employed in Administrative & Support Services in Downey, CA?
Top Zip Codes with the Highest Percentage of Population Employed in Administrative & Support Services in Downey, CA are:
What zip code has the Highest Percentage of Population Employed in Administrative & Support Services in Downey, CA?
90241 has the Highest Percentage of Population Employed in Administrative & Support Services in Downey, CA with 5.2%.
What is the Percentage of Population Employed in Administrative & Support Services in Downey, CA?
Percentage of Population Employed in Administrative & Support Services in Downey is 5.0%.
What is the Percentage of Population Employed in Administrative & Support Services in California?
Percentage of Population Employed in Administrative & Support Services in California is 4.6%.
What is the Percentage of Population Employed in Administrative & Support Services in the United States?
Percentage of Population Employed in Administrative & Support Services in the United States is 4.1%.