Zip Codes with the Highest Percentage of Population with a Degree in Literature and Languages in Whittier, CA

RELATED REPORTS & OPTIONS

Literature and Languages
Population
Families and Households
Female Fertility
Female Fertility (Unmarried)
Race (Community Size)
Race (Percentage)
Ancestry (Community Size)
AfricanAmericanApacheArabArgentineanArmenianAustrianBasqueBelgianBhutaneseBlackfeetBolivianBritishBurmeseCanadianCelticCentral AmericanCentral American IndianCherokeeChileanChineseColombianComancheCosta RicanCroatianCubanCzechDanishDominicanDutchEastern EuropeanEcuadorianEgyptianEnglishEuropeanFilipinoFinnishFrenchFrench CanadianGermanGreekGuamanian / ChamorroGuatemalanHonduranHungarianIndian (Asian)IranianIrishIsraeliItalianJapaneseKoreanLaotianLatvianLebaneseLithuanianMalaysianMalteseMexicanMexican American IndianNative HawaiianNavajoNicaraguanNorthern EuropeanNorwegianPakistaniPanamanianPeruvianPolishPortuguesePuebloPuerto RicanRomanianRussianSalvadoranSamoanScandinavianScotch-IrishScottishSiouxSlovakSouth AmericanSpaniardSpanishSri LankanSubsaharan AfricanSwedishSwissThaiUkrainianWelshYaquiYugoslavianYuman
Ancestry (Percentage)
AfricanAmericanApacheArabArgentineanArmenianAustrianBasqueBelgianBhutaneseBlackfeetBolivianBritishBurmeseCanadianCelticCentral AmericanCentral American IndianCherokeeChileanChineseColombianComancheCosta RicanCroatianCubanCzechDanishDominicanDutchEastern EuropeanEcuadorianEgyptianEnglishEuropeanFilipinoFinnishFrenchFrench CanadianGermanGreekGuamanian / ChamorroGuatemalanHonduranHungarianIndian (Asian)IranianIrishIsraeliItalianJapaneseKoreanLaotianLatvianLebaneseLithuanianMalaysianMalteseMexicanMexican American IndianNative HawaiianNavajoNicaraguanNorthern EuropeanNorwegianPakistaniPanamanianPeruvianPolishPortuguesePuebloPuerto RicanRomanianRussianSalvadoranSamoanScandinavianScotch-IrishScottishSiouxSlovakSouth AmericanSpaniardSpanishSri LankanSubsaharan AfricanSwedishSwissThaiUkrainianWelshYaquiYugoslavianYuman
Immigrant Origin (Total)
Immigrant Origin (Percentage)
Income
Income (Families)
Income (Households)
Poverty
Poverty (Families)
Unemployment
Employment Occupations
Employment Industries
Employer Class
Commute Time
Commute Means
School Enrollment
Education by Degree Field
Occupancy
Finances
Physical Characteristics
Whittier
States
California Cities
AlamedaAlhambraAnaheimAntiochApple ValleyArcadiaAuburnBakersfieldBerkeleyBeverly HillsBreaBuena ParkBurbankCamarilloCanoga ParkCanyon CountryCarlsbadCarsonCastro ValleyChicoChinoChula VistaCitrus HeightsClovisComptonConcordCoronaCosta MesaCovinaCulver CityDaly CityDanvilleDavisDesert Hot SpringsDowneyDuarteEl CajonEl MonteElk GroveEncinoEscondidoEurekaFairfieldFontanaFremontFresnoFullertonGarden GroveGardenaGlendaleGlendoraGrass ValleyHaywardHemetHesperiaHuntington BeachIndioInglewoodIrvineLa MesaLa MiradaLa PuenteLake ElsinoreLakewoodLancasterLivermoreLodiLompocLong BeachLos AltosLos AngelesLos GatosMaderaMantecaMenifeeMercedMission ViejoModestoMontereyMonterey ParkMoreno ValleyMountain ViewMurrietaNapaNewport BeachNorth HollywoodNorthridgeNovatoOaklandOceansideOntarioOrangeOrovilleOxnardPalm DesertPalm SpringsPalmdalePalo AltoPasadenaPerrisPetalumaPleasantonPomonaPortervilleRancho CordovaRancho CucamongaRancho Santa FeReddingRedlandsRedondo BeachRedwood CityRialtoRichmondRiversideRocklinRosevilleSacramentoSalinasSan BernardinoSan ClementeSan DiegoSan FranciscoSan GabrielSan JacintoSan JoseSan LeandroSan Luis ObispoSan MarcosSan MateoSan PedroSan RafaelSan RamonSanta AnaSanta BarbaraSanta ClaraSanta ClaritaSanta CruzSanta MariaSanta MonicaSanta RosaSherman OaksSimi ValleySpring ValleyStocktonSunnyvaleTemeculaThousand OaksTorranceTrabuco CanyonTracyTurlockTustinUplandVacavilleValenciaVallejoVan NuysVenturaVictorvilleVisaliaVistaWalnut CreekWest CovinaWest SacramentoWhittierWoodlandWoodland HillsYorba LindaYuba City
Compare Zip Codes
Comparison Subject

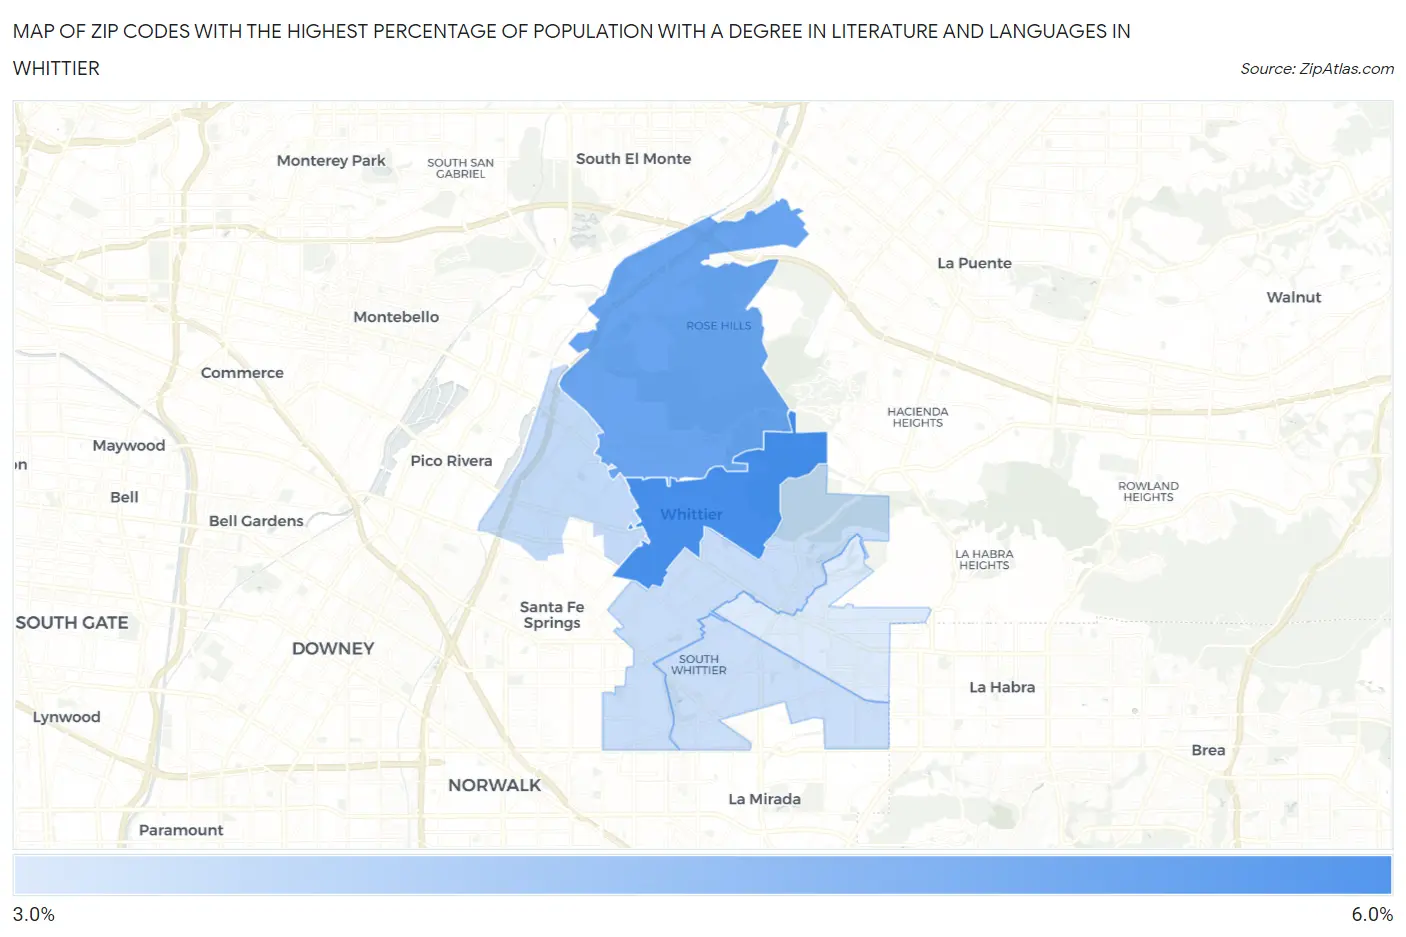
Map of Zip Codes with the Highest Percentage of Population with a Degree in Literature and Languages in Whittier

0.0%
6.0%
Zip Codes with the Highest Percentage of Population with a Degree in Literature and Languages in Whittier Map

Zip Codes with the Highest Percentage of Population with a Degree in Literature and Languages in Whittier, CA

Zip Code % Graduates vs State vs National
1.906025.4%5.1%(+0.286)#6064.4%(+0.960)#6,579
2.906014.9%5.1%(-0.209)#7184.4%(+0.465)#7,688
3.906063.6%5.1%(-1.49)#1,0504.4%(-0.820)#11,538
4.906053.5%5.1%(-1.58)#1,0744.4%(-0.909)#11,847
5.906043.4%5.1%(-1.64)#1,0874.4%(-0.964)#12,033
6.906033.2%5.1%(-1.90)#1,1394.4%(-1.22)#12,951

Common Questions

What are the Top 5 Zip Codes with the Highest Percentage of Population with a Degree in Literature and Languages in Whittier, CA?
Top 5 Zip Codes with the Highest Percentage of Population with a Degree in Literature and Languages in Whittier, CA are:
#1
5.4%
#2
4.9%
#3
3.6%
#4
3.5%
#5
3.4%
What zip code has the Highest Percentage of Population with a Degree in Literature and Languages in Whittier, CA?
90602 has the Highest Percentage of Population with a Degree in Literature and Languages in Whittier, CA with 5.4%.
What is the Percentage of Population with a Degree in Literature and Languages in Whittier, CA?
Percentage of Population with a Degree in Literature and Languages in Whittier is 4.7%.
What is the Percentage of Population with a Degree in Literature and Languages in California?
Percentage of Population with a Degree in Literature and Languages in California is 5.1%.
What is the Percentage of Population with a Degree in Literature and Languages in the United States?
Percentage of Population with a Degree in Literature and Languages in the United States is 4.4%.