Zip Codes with the Highest Percentage of Population Employed in Administrative & Support Services in San Gabriel, CA
RELATED REPORTS & OPTIONS
Administrative & Support Services
San Gabriel
Compare Zip Codes
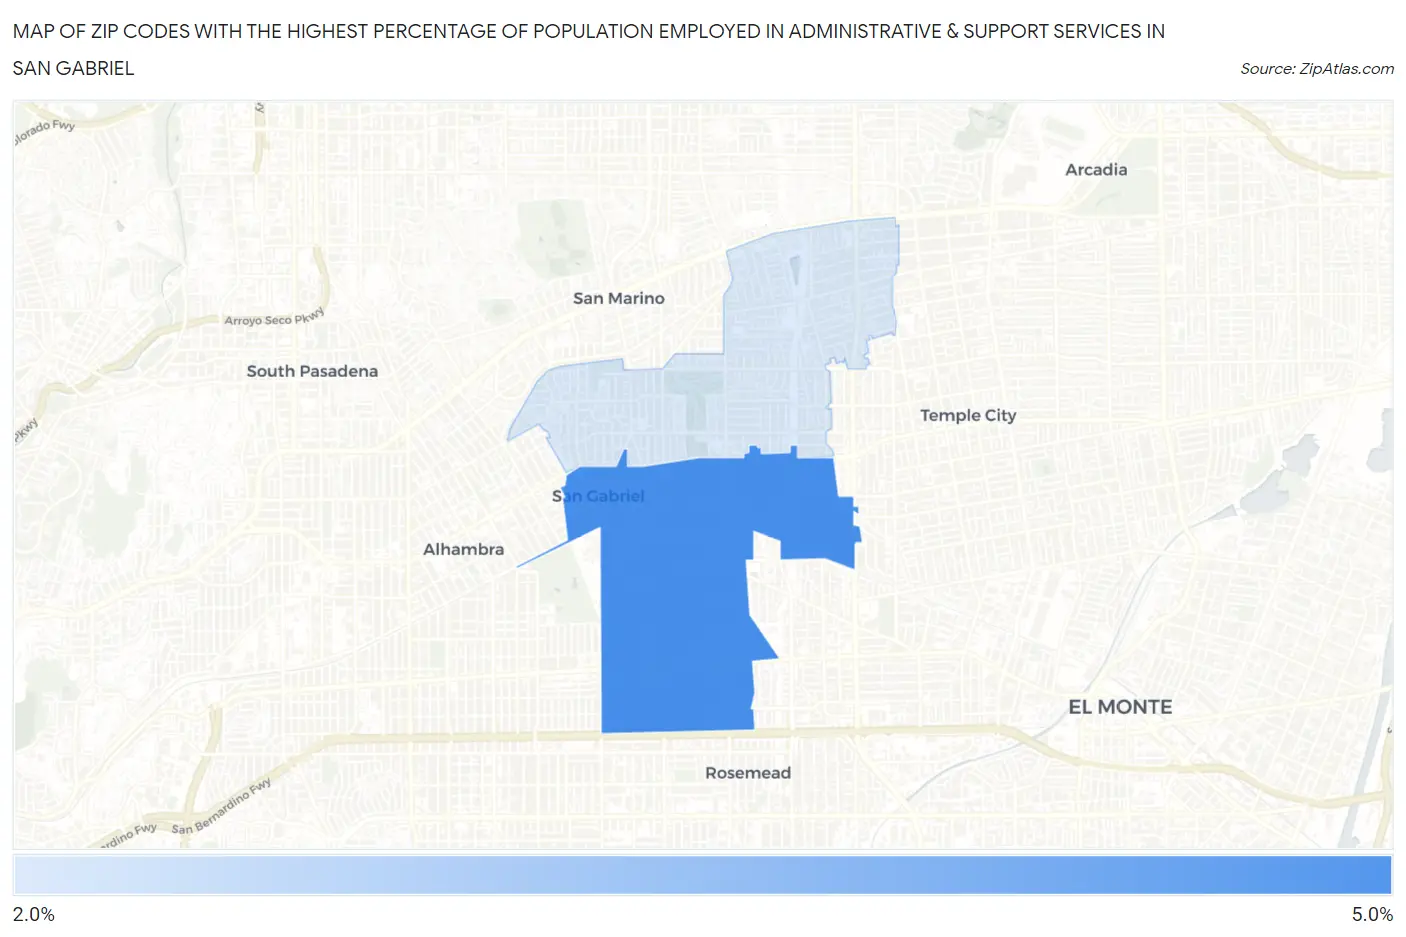
Map of Zip Codes with the Highest Percentage of Population Employed in Administrative & Support Services in San Gabriel
2.6%
4.3%
Zip Codes with the Highest Percentage of Population Employed in Administrative & Support Services in San Gabriel, CA
| Zip Code | % Employed | vs State | vs National | |
| 1. | 91776 | 4.3% | 4.6%(-0.254)#708 | 4.1%(+0.166)#9,387 |
| 2. | 91775 | 2.6% | 4.6%(-2.02)#1,193 | 4.1%(-1.60)#17,876 |
1
Common Questions
What are the Top Zip Codes with the Highest Percentage of Population Employed in Administrative & Support Services in San Gabriel, CA?
Top Zip Codes with the Highest Percentage of Population Employed in Administrative & Support Services in San Gabriel, CA are:
What zip code has the Highest Percentage of Population Employed in Administrative & Support Services in San Gabriel, CA?
91776 has the Highest Percentage of Population Employed in Administrative & Support Services in San Gabriel, CA with 4.3%.
What is the Percentage of Population Employed in Administrative & Support Services in San Gabriel, CA?
Percentage of Population Employed in Administrative & Support Services in San Gabriel is 4.4%.
What is the Percentage of Population Employed in Administrative & Support Services in California?
Percentage of Population Employed in Administrative & Support Services in California is 4.6%.
What is the Percentage of Population Employed in Administrative & Support Services in the United States?
Percentage of Population Employed in Administrative & Support Services in the United States is 4.1%.