Zip Codes with the Highest Percentage of Population Employed in Administrative & Support Services in Pleasanton, CA
RELATED REPORTS & OPTIONS
Administrative & Support Services
Pleasanton
Compare Zip Codes
Map of Zip Codes with the Highest Percentage of Population Employed in Administrative & Support Services in Pleasanton
2.6%
3.0%
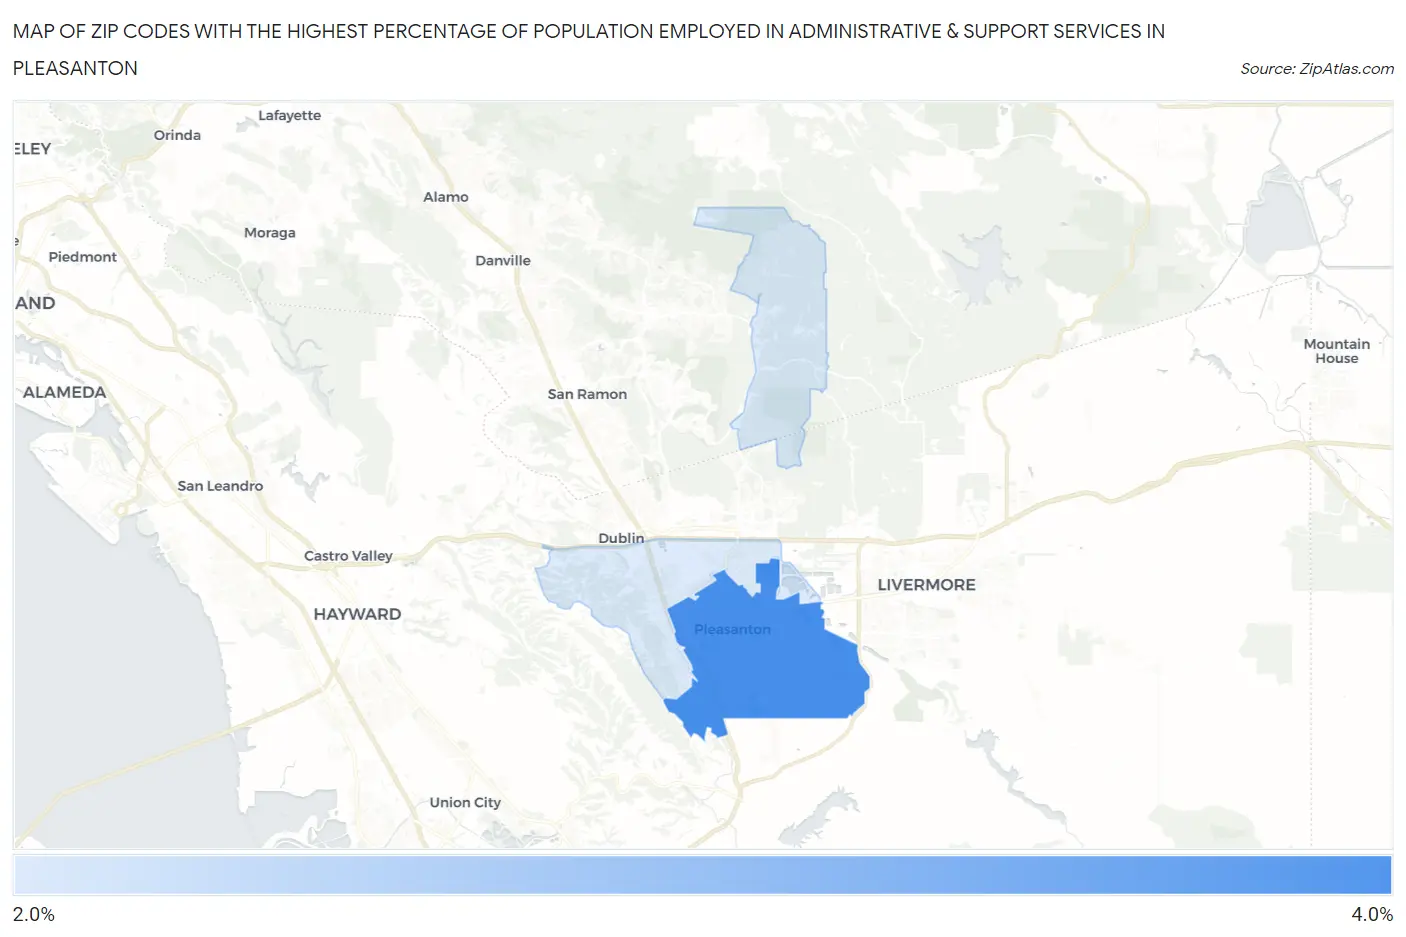
Zip Codes with the Highest Percentage of Population Employed in Administrative & Support Services in Pleasanton, CA
| Zip Code | % Employed | vs State | vs National | |
| 1. | 94566 | 3.0% | 4.6%(-1.55)#1,070 | 4.1%(-1.13)#15,377 |
| 2. | 94588 | 2.6% | 4.6%(-2.01)#1,189 | 4.1%(-1.60)#17,858 |
1
Common Questions
What are the Top Zip Codes with the Highest Percentage of Population Employed in Administrative & Support Services in Pleasanton, CA?
Top Zip Codes with the Highest Percentage of Population Employed in Administrative & Support Services in Pleasanton, CA are:
What zip code has the Highest Percentage of Population Employed in Administrative & Support Services in Pleasanton, CA?
94566 has the Highest Percentage of Population Employed in Administrative & Support Services in Pleasanton, CA with 3.0%.
What is the Percentage of Population Employed in Administrative & Support Services in Pleasanton, CA?
Percentage of Population Employed in Administrative & Support Services in Pleasanton is 2.8%.
What is the Percentage of Population Employed in Administrative & Support Services in California?
Percentage of Population Employed in Administrative & Support Services in California is 4.6%.
What is the Percentage of Population Employed in Administrative & Support Services in the United States?
Percentage of Population Employed in Administrative & Support Services in the United States is 4.1%.