Zip Codes with the Highest Percentage of Population Employed in Legal Services & Support in Whittier, CA
RELATED REPORTS & OPTIONS
Legal Services & Support
Whittier
Compare Zip Codes
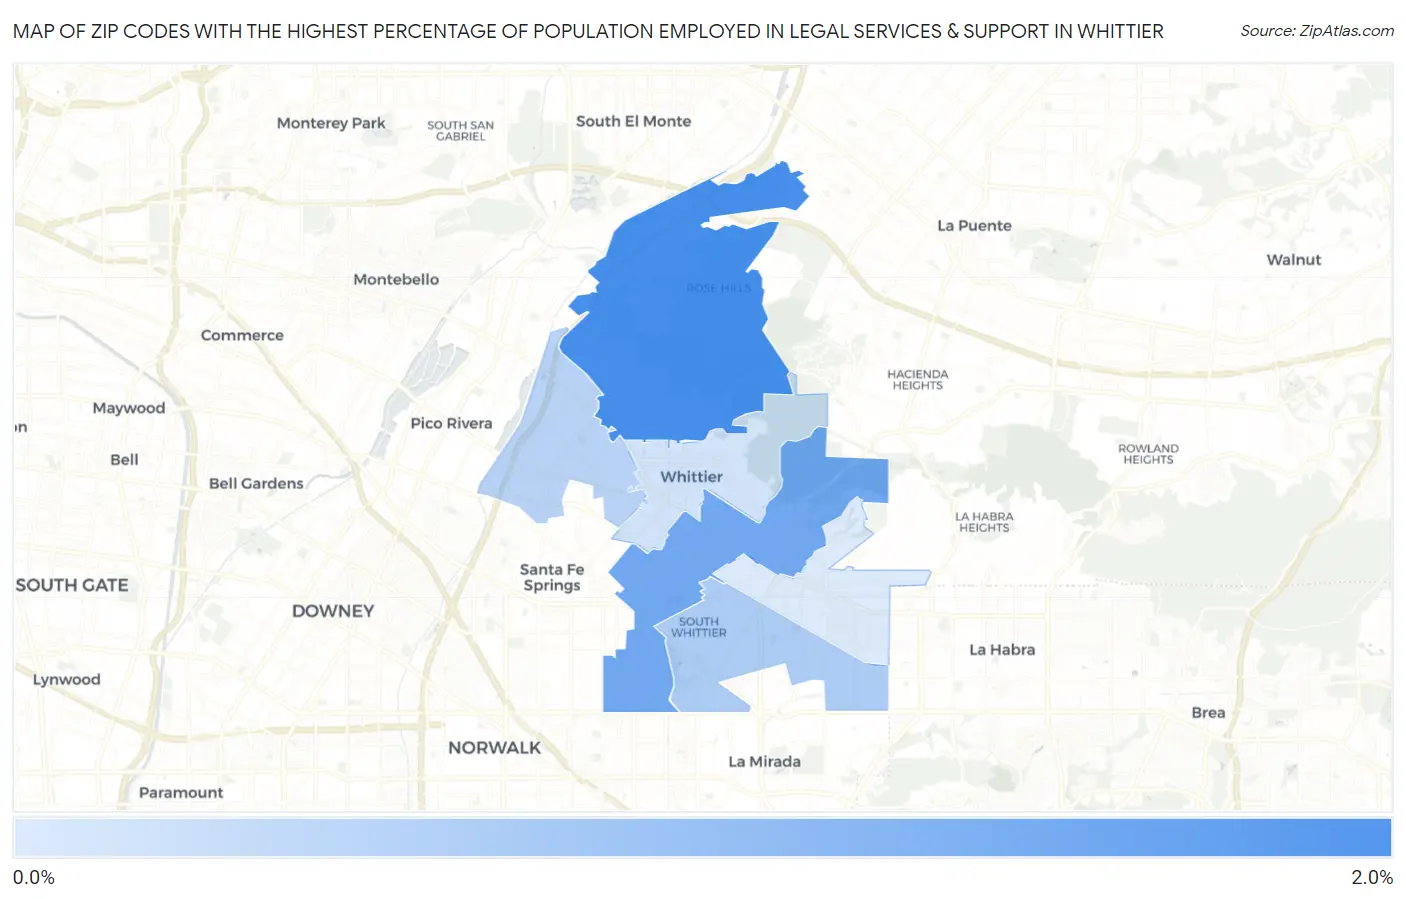
Map of Zip Codes with the Highest Percentage of Population Employed in Legal Services & Support in Whittier
0.55%
1.6%
Zip Codes with the Highest Percentage of Population Employed in Legal Services & Support in Whittier, CA
| Zip Code | % Employed | vs State | vs National | |
| 1. | 90601 | 1.6% | 1.3%(+0.296)#415 | 1.2%(+0.370)#4,831 |
| 2. | 90605 | 1.3% | 1.3%(+0.016)#500 | 1.2%(+0.090)#6,081 |
| 3. | 90604 | 0.88% | 1.3%(-0.380)#694 | 1.2%(-0.306)#8,795 |
| 4. | 90606 | 0.79% | 1.3%(-0.465)#749 | 1.2%(-0.391)#9,516 |
| 5. | 90602 | 0.63% | 1.3%(-0.628)#845 | 1.2%(-0.554)#11,136 |
| 6. | 90603 | 0.55% | 1.3%(-0.706)#899 | 1.2%(-0.631)#12,028 |
1
Common Questions
What are the Top 5 Zip Codes with the Highest Percentage of Population Employed in Legal Services & Support in Whittier, CA?
Top 5 Zip Codes with the Highest Percentage of Population Employed in Legal Services & Support in Whittier, CA are:
What zip code has the Highest Percentage of Population Employed in Legal Services & Support in Whittier, CA?
90601 has the Highest Percentage of Population Employed in Legal Services & Support in Whittier, CA with 1.6%.
What is the Percentage of Population Employed in Legal Services & Support in Whittier, CA?
Percentage of Population Employed in Legal Services & Support in Whittier is 1.2%.
What is the Percentage of Population Employed in Legal Services & Support in California?
Percentage of Population Employed in Legal Services & Support in California is 1.3%.
What is the Percentage of Population Employed in Legal Services & Support in the United States?
Percentage of Population Employed in Legal Services & Support in the United States is 1.2%.