Zip Codes with the Highest Percentage of Population Employed in Administrative & Support Services in San Ramon, CA
RELATED REPORTS & OPTIONS
Administrative & Support Services
San Ramon
Compare Zip Codes
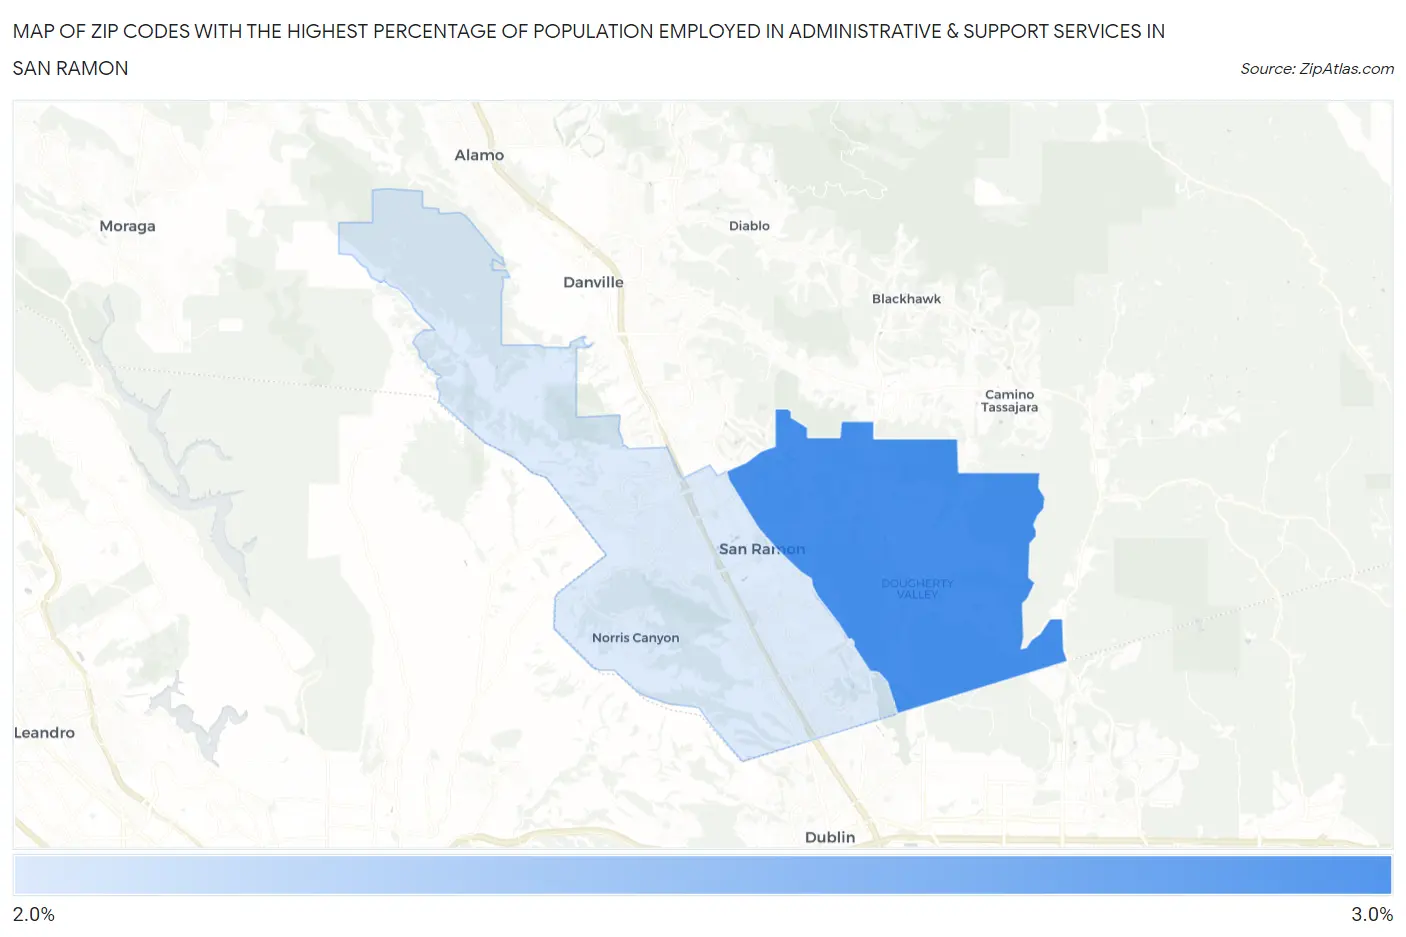
Map of Zip Codes with the Highest Percentage of Population Employed in Administrative & Support Services in San Ramon
2.5%
2.7%
Zip Codes with the Highest Percentage of Population Employed in Administrative & Support Services in San Ramon, CA
| Zip Code | % Employed | vs State | vs National | |
| 1. | 94582 | 2.7% | 4.6%(-1.89)#1,159 | 4.1%(-1.47)#17,189 |
| 2. | 94583 | 2.5% | 4.6%(-2.09)#1,216 | 4.1%(-1.67)#18,262 |
1
Common Questions
What are the Top Zip Codes with the Highest Percentage of Population Employed in Administrative & Support Services in San Ramon, CA?
Top Zip Codes with the Highest Percentage of Population Employed in Administrative & Support Services in San Ramon, CA are:
What zip code has the Highest Percentage of Population Employed in Administrative & Support Services in San Ramon, CA?
94582 has the Highest Percentage of Population Employed in Administrative & Support Services in San Ramon, CA with 2.7%.
What is the Percentage of Population Employed in Administrative & Support Services in San Ramon, CA?
Percentage of Population Employed in Administrative & Support Services in San Ramon is 2.6%.
What is the Percentage of Population Employed in Administrative & Support Services in California?
Percentage of Population Employed in Administrative & Support Services in California is 4.6%.
What is the Percentage of Population Employed in Administrative & Support Services in the United States?
Percentage of Population Employed in Administrative & Support Services in the United States is 4.1%.