Zip Codes with the Highest Percentage of Population Employed in Architecture & Engineering in Whittier, CA
RELATED REPORTS & OPTIONS
Architecture & Engineering
Whittier
Compare Zip Codes
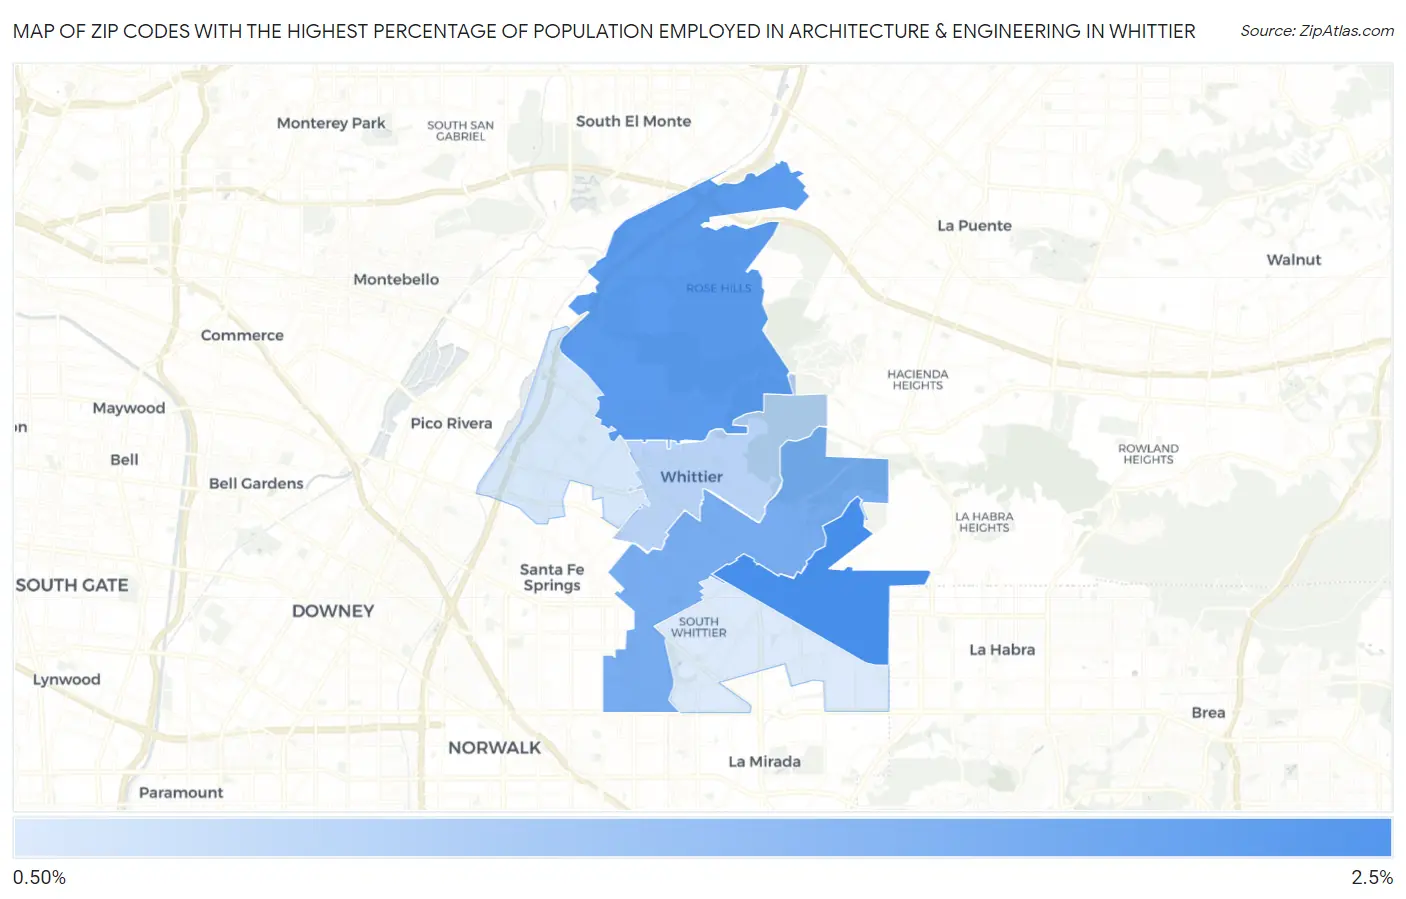
Map of Zip Codes with the Highest Percentage of Population Employed in Architecture & Engineering in Whittier
0.68%
2.5%
Zip Codes with the Highest Percentage of Population Employed in Architecture & Engineering in Whittier, CA
| Zip Code | % Employed | vs State | vs National | |
| 1. | 90603 | 2.5% | 2.6%(-0.098)#537 | 2.1%(+0.307)#7,197 |
| 2. | 90601 | 2.2% | 2.6%(-0.330)#617 | 2.1%(+0.075)#8,348 |
| 3. | 90605 | 1.9% | 2.6%(-0.661)#723 | 2.1%(-0.256)#10,295 |
| 4. | 90602 | 1.1% | 2.6%(-1.44)#991 | 2.1%(-1.04)#15,771 |
| 5. | 90606 | 0.75% | 2.6%(-1.80)#1,138 | 2.1%(-1.40)#18,525 |
| 6. | 90604 | 0.68% | 2.6%(-1.87)#1,153 | 2.1%(-1.47)#19,025 |
1
Common Questions
What are the Top 5 Zip Codes with the Highest Percentage of Population Employed in Architecture & Engineering in Whittier, CA?
Top 5 Zip Codes with the Highest Percentage of Population Employed in Architecture & Engineering in Whittier, CA are:
What zip code has the Highest Percentage of Population Employed in Architecture & Engineering in Whittier, CA?
90603 has the Highest Percentage of Population Employed in Architecture & Engineering in Whittier, CA with 2.5%.
What is the Percentage of Population Employed in Architecture & Engineering in Whittier, CA?
Percentage of Population Employed in Architecture & Engineering in Whittier is 1.9%.
What is the Percentage of Population Employed in Architecture & Engineering in California?
Percentage of Population Employed in Architecture & Engineering in California is 2.6%.
What is the Percentage of Population Employed in Architecture & Engineering in the United States?
Percentage of Population Employed in Architecture & Engineering in the United States is 2.1%.