Zip Codes with the Highest Percentage of Population Employed in Administrative & Support Services in Los Gatos, CA
RELATED REPORTS & OPTIONS
Administrative & Support Services
Los Gatos
Compare Zip Codes
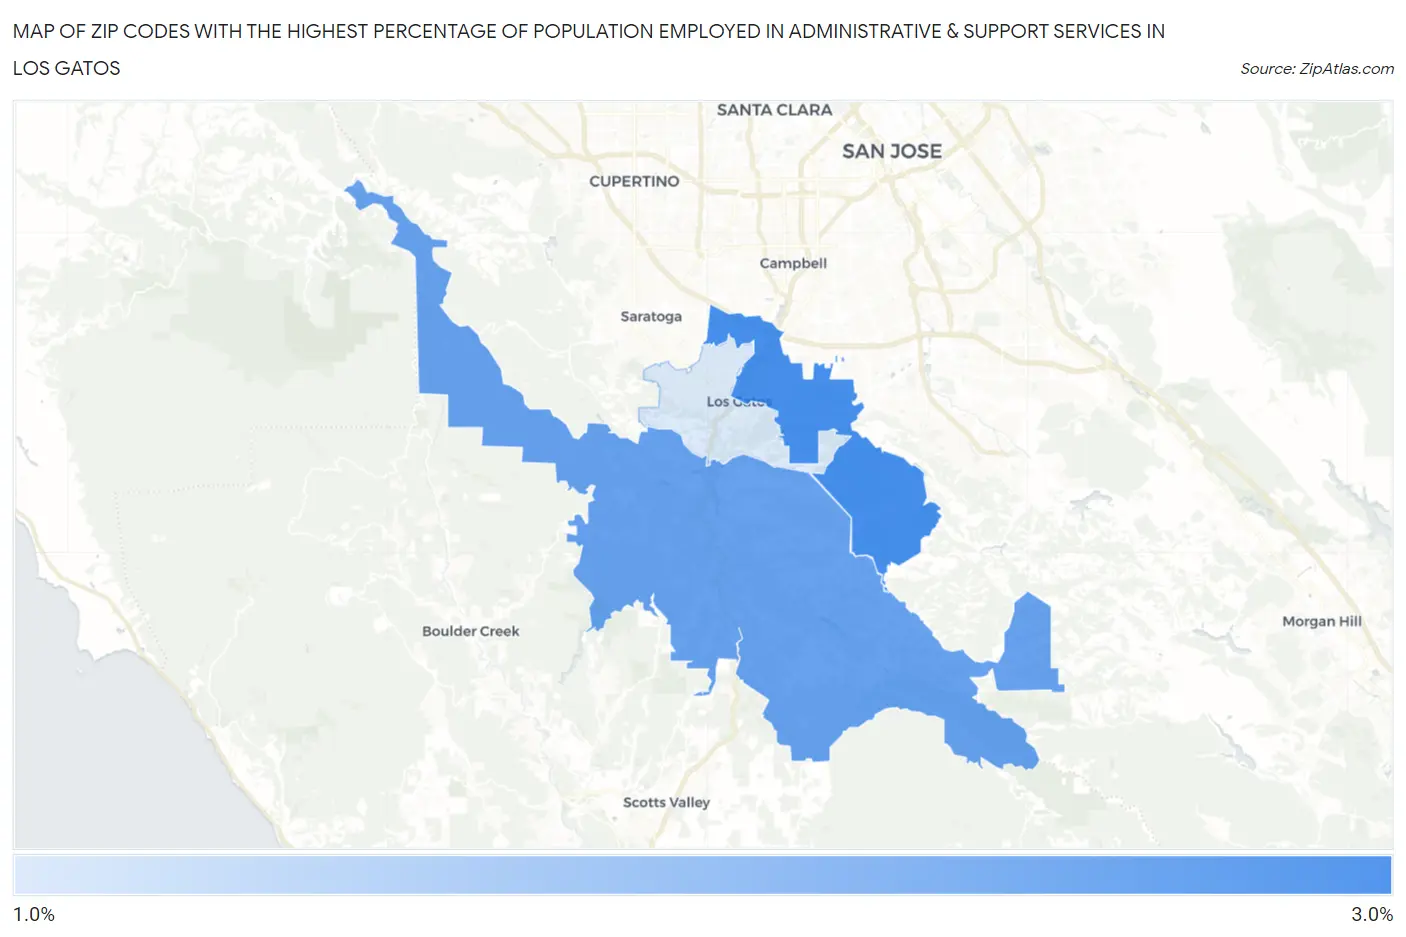
Map of Zip Codes with the Highest Percentage of Population Employed in Administrative & Support Services in Los Gatos
1.0%
2.8%
Zip Codes with the Highest Percentage of Population Employed in Administrative & Support Services in Los Gatos, CA
| Zip Code | % Employed | vs State | vs National | |
| 1. | 95032 | 2.8% | 4.6%(-1.78)#1,137 | 4.1%(-1.36)#16,597 |
| 2. | 95033 | 2.4% | 4.6%(-2.16)#1,231 | 4.1%(-1.74)#18,585 |
| 3. | 95030 | 1.0% | 4.6%(-3.55)#1,451 | 4.1%(-3.13)#24,410 |
1
Common Questions
What are the Top Zip Codes with the Highest Percentage of Population Employed in Administrative & Support Services in Los Gatos, CA?
Top Zip Codes with the Highest Percentage of Population Employed in Administrative & Support Services in Los Gatos, CA are:
What zip code has the Highest Percentage of Population Employed in Administrative & Support Services in Los Gatos, CA?
95032 has the Highest Percentage of Population Employed in Administrative & Support Services in Los Gatos, CA with 2.8%.
What is the Percentage of Population Employed in Administrative & Support Services in Los Gatos, CA?
Percentage of Population Employed in Administrative & Support Services in Los Gatos is 2.0%.
What is the Percentage of Population Employed in Administrative & Support Services in California?
Percentage of Population Employed in Administrative & Support Services in California is 4.6%.
What is the Percentage of Population Employed in Administrative & Support Services in the United States?
Percentage of Population Employed in Administrative & Support Services in the United States is 4.1%.