Zip Codes with the Highest Percentage of Population with a Degree in Physical and Health Sciences in Whittier, CA
RELATED REPORTS & OPTIONS
Physical and Health Sciences
Whittier
Compare Zip Codes
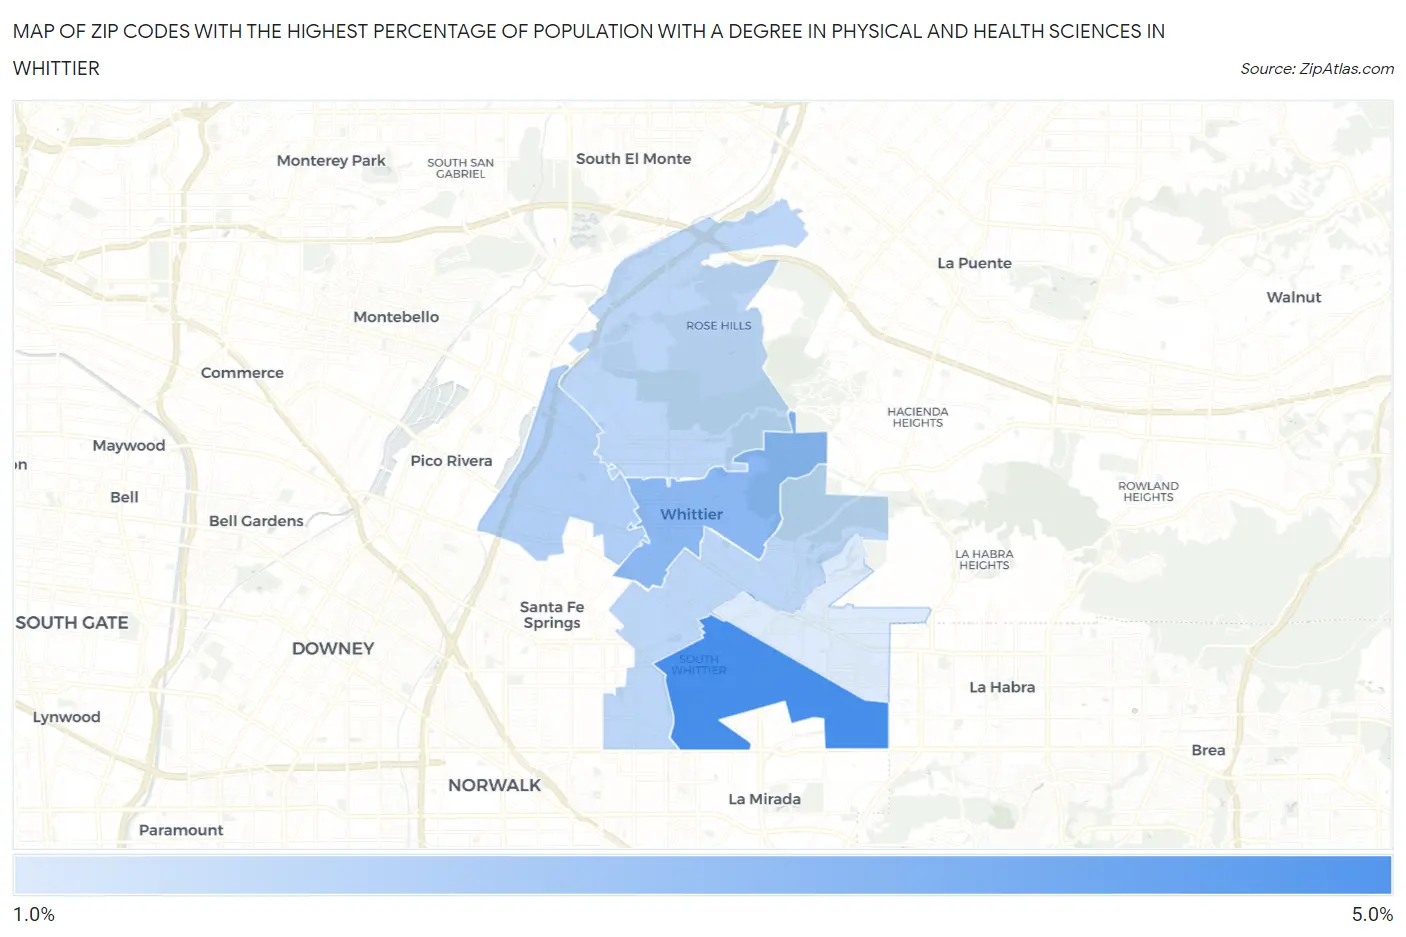
Map of Zip Codes with the Highest Percentage of Population with a Degree in Physical and Health Sciences in Whittier
1.0%
4.0%
Zip Codes with the Highest Percentage of Population with a Degree in Physical and Health Sciences in Whittier, CA
| Zip Code | % Graduates | vs State | vs National | |
| 1. | 90604 | 4.0% | 3.1%(+0.894)#358 | 3.1%(+0.910)#6,716 |
| 2. | 90602 | 2.7% | 3.1%(-0.445)#744 | 3.1%(-0.429)#11,922 |
| 3. | 90606 | 1.9% | 3.1%(-1.22)#1,045 | 3.1%(-1.21)#15,561 |
| 4. | 90605 | 1.7% | 3.1%(-1.44)#1,112 | 3.1%(-1.43)#16,543 |
| 5. | 90601 | 1.7% | 3.1%(-1.46)#1,120 | 3.1%(-1.45)#16,633 |
| 6. | 90603 | 1.0% | 3.1%(-2.08)#1,272 | 3.1%(-2.07)#19,136 |
1
Common Questions
What are the Top 5 Zip Codes with the Highest Percentage of Population with a Degree in Physical and Health Sciences in Whittier, CA?
Top 5 Zip Codes with the Highest Percentage of Population with a Degree in Physical and Health Sciences in Whittier, CA are:
What zip code has the Highest Percentage of Population with a Degree in Physical and Health Sciences in Whittier, CA?
90604 has the Highest Percentage of Population with a Degree in Physical and Health Sciences in Whittier, CA with 4.0%.
What is the Percentage of Population with a Degree in Physical and Health Sciences in Whittier, CA?
Percentage of Population with a Degree in Physical and Health Sciences in Whittier is 1.8%.
What is the Percentage of Population with a Degree in Physical and Health Sciences in California?
Percentage of Population with a Degree in Physical and Health Sciences in California is 3.1%.
What is the Percentage of Population with a Degree in Physical and Health Sciences in the United States?
Percentage of Population with a Degree in Physical and Health Sciences in the United States is 3.1%.