Zip Codes with the Highest Percentage of Population Employed in Administrative & Support Services in Sacramento, CA
RELATED REPORTS & OPTIONS
Administrative & Support Services
Sacramento
Compare Zip Codes
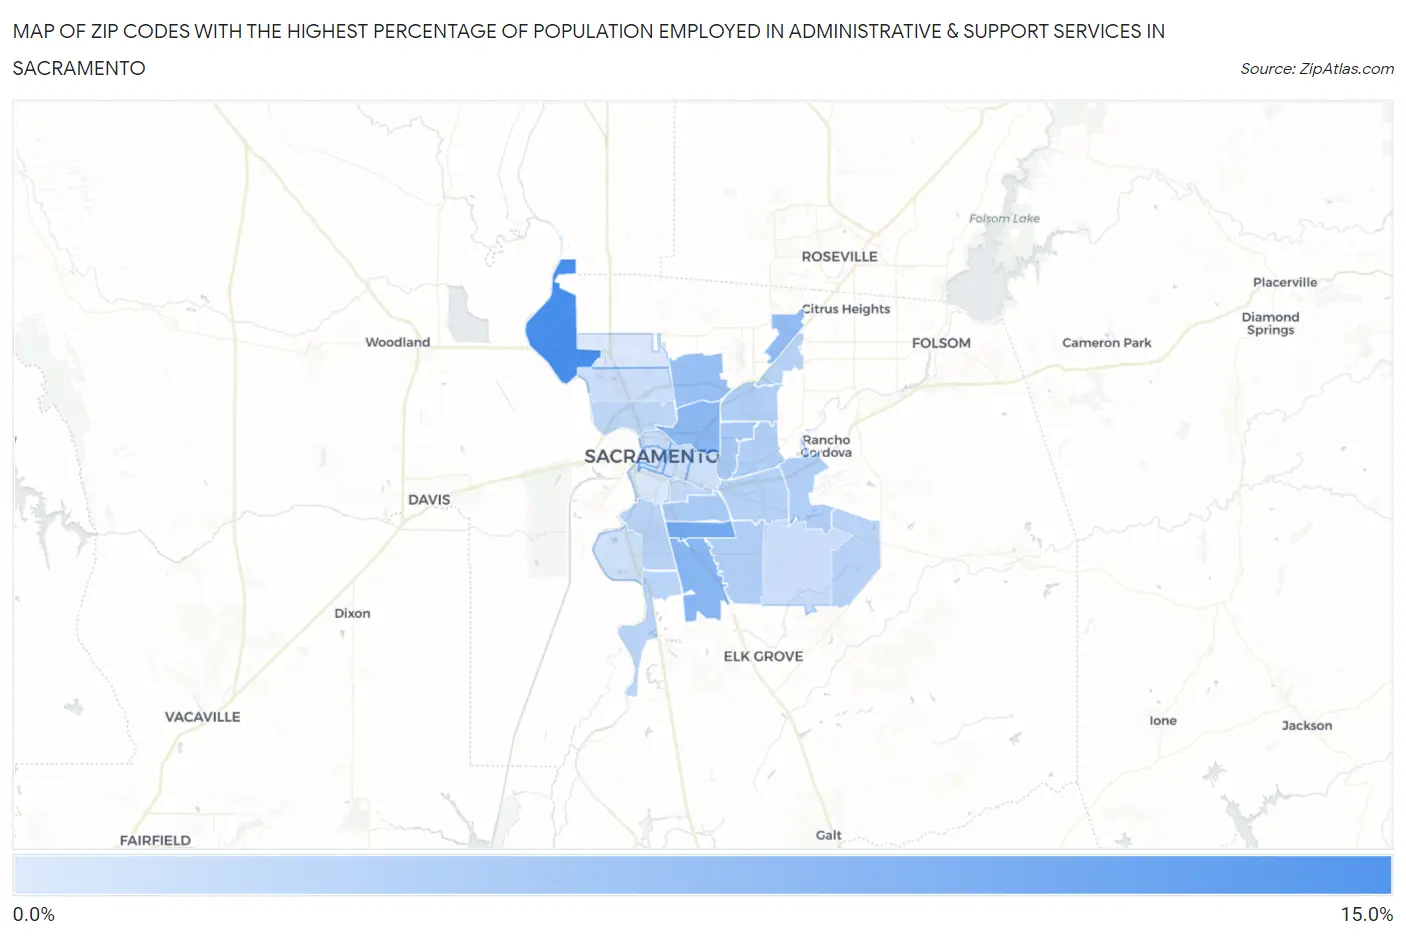
Map of Zip Codes with the Highest Percentage of Population Employed in Administrative & Support Services in Sacramento
2.1%
13.1%
Zip Codes with the Highest Percentage of Population Employed in Administrative & Support Services in Sacramento, CA
| Zip Code | % Employed | vs State | vs National | |
| 1. | 95837 | 13.1% | 4.6%(+8.50)#49 | 4.1%(+8.92)#714 |
| 2. | 95824 | 9.8% | 4.6%(+5.20)#90 | 4.1%(+5.62)#1,370 |
| 3. | 95823 | 8.2% | 4.6%(+3.60)#145 | 4.1%(+4.02)#2,166 |
| 4. | 95815 | 8.0% | 4.6%(+3.42)#153 | 4.1%(+3.84)#2,286 |
| 5. | 95842 | 7.5% | 4.6%(+2.90)#183 | 4.1%(+3.32)#2,718 |
| 6. | 95838 | 7.0% | 4.6%(+2.48)#221 | 4.1%(+2.90)#3,169 |
| 7. | 95825 | 6.0% | 4.6%(+1.42)#346 | 4.1%(+1.84)#4,818 |
| 8. | 95820 | 5.8% | 4.6%(+1.27)#373 | 4.1%(+1.69)#5,073 |
| 9. | 95828 | 5.3% | 4.6%(+0.755)#461 | 4.1%(+1.17)#6,272 |
| 10. | 95864 | 5.2% | 4.6%(+0.672)#477 | 4.1%(+1.09)#6,499 |
| 11. | 95821 | 5.1% | 4.6%(+0.571)#494 | 4.1%(+0.990)#6,737 |
| 12. | 95827 | 5.1% | 4.6%(+0.552)#499 | 4.1%(+0.972)#6,792 |
| 13. | 95826 | 4.9% | 4.6%(+0.307)#566 | 4.1%(+0.726)#7,481 |
| 14. | 95822 | 4.7% | 4.6%(+0.147)#605 | 4.1%(+0.566)#7,979 |
| 15. | 95841 | 4.7% | 4.6%(+0.129)#611 | 4.1%(+0.549)#8,032 |
| 16. | 95830 | 4.6% | 4.6%(+0.057)#624 | 4.1%(+0.477)#8,273 |
| 17. | 95832 | 4.6% | 4.6%(-0.015)#644 | 4.1%(+0.404)#8,526 |
| 18. | 95833 | 4.4% | 4.6%(-0.212)#694 | 4.1%(+0.207)#9,257 |
| 19. | 95817 | 4.1% | 4.6%(-0.451)#755 | 4.1%(-0.032)#10,166 |
| 20. | 95811 | 3.5% | 4.6%(-1.09)#937 | 4.1%(-0.671)#13,079 |
| 21. | 95829 | 3.5% | 4.6%(-1.12)#940 | 4.1%(-0.696)#13,191 |
| 22. | 95834 | 3.3% | 4.6%(-1.23)#969 | 4.1%(-0.812)#13,738 |
| 23. | 95816 | 3.2% | 4.6%(-1.36)#1,010 | 4.1%(-0.941)#14,425 |
| 24. | 95819 | 3.0% | 4.6%(-1.54)#1,066 | 4.1%(-1.12)#15,312 |
| 25. | 95831 | 3.0% | 4.6%(-1.55)#1,069 | 4.1%(-1.13)#15,376 |
| 26. | 95835 | 2.2% | 4.6%(-2.32)#1,273 | 4.1%(-1.90)#19,423 |
| 27. | 95818 | 2.2% | 4.6%(-2.38)#1,291 | 4.1%(-1.96)#19,687 |
| 28. | 95814 | 2.1% | 4.6%(-2.47)#1,308 | 4.1%(-2.05)#20,135 |
1
Common Questions
What are the Top 10 Zip Codes with the Highest Percentage of Population Employed in Administrative & Support Services in Sacramento, CA?
Top 10 Zip Codes with the Highest Percentage of Population Employed in Administrative & Support Services in Sacramento, CA are:
What zip code has the Highest Percentage of Population Employed in Administrative & Support Services in Sacramento, CA?
95837 has the Highest Percentage of Population Employed in Administrative & Support Services in Sacramento, CA with 13.1%.
What is the Percentage of Population Employed in Administrative & Support Services in Sacramento, CA?
Percentage of Population Employed in Administrative & Support Services in Sacramento is 4.5%.
What is the Percentage of Population Employed in Administrative & Support Services in California?
Percentage of Population Employed in Administrative & Support Services in California is 4.6%.
What is the Percentage of Population Employed in Administrative & Support Services in the United States?
Percentage of Population Employed in Administrative & Support Services in the United States is 4.1%.