Zip Codes with the Highest Percentage of Population Employed in Administrative & Support Services in Inglewood, CA
RELATED REPORTS & OPTIONS
Administrative & Support Services
Inglewood
Compare Zip Codes
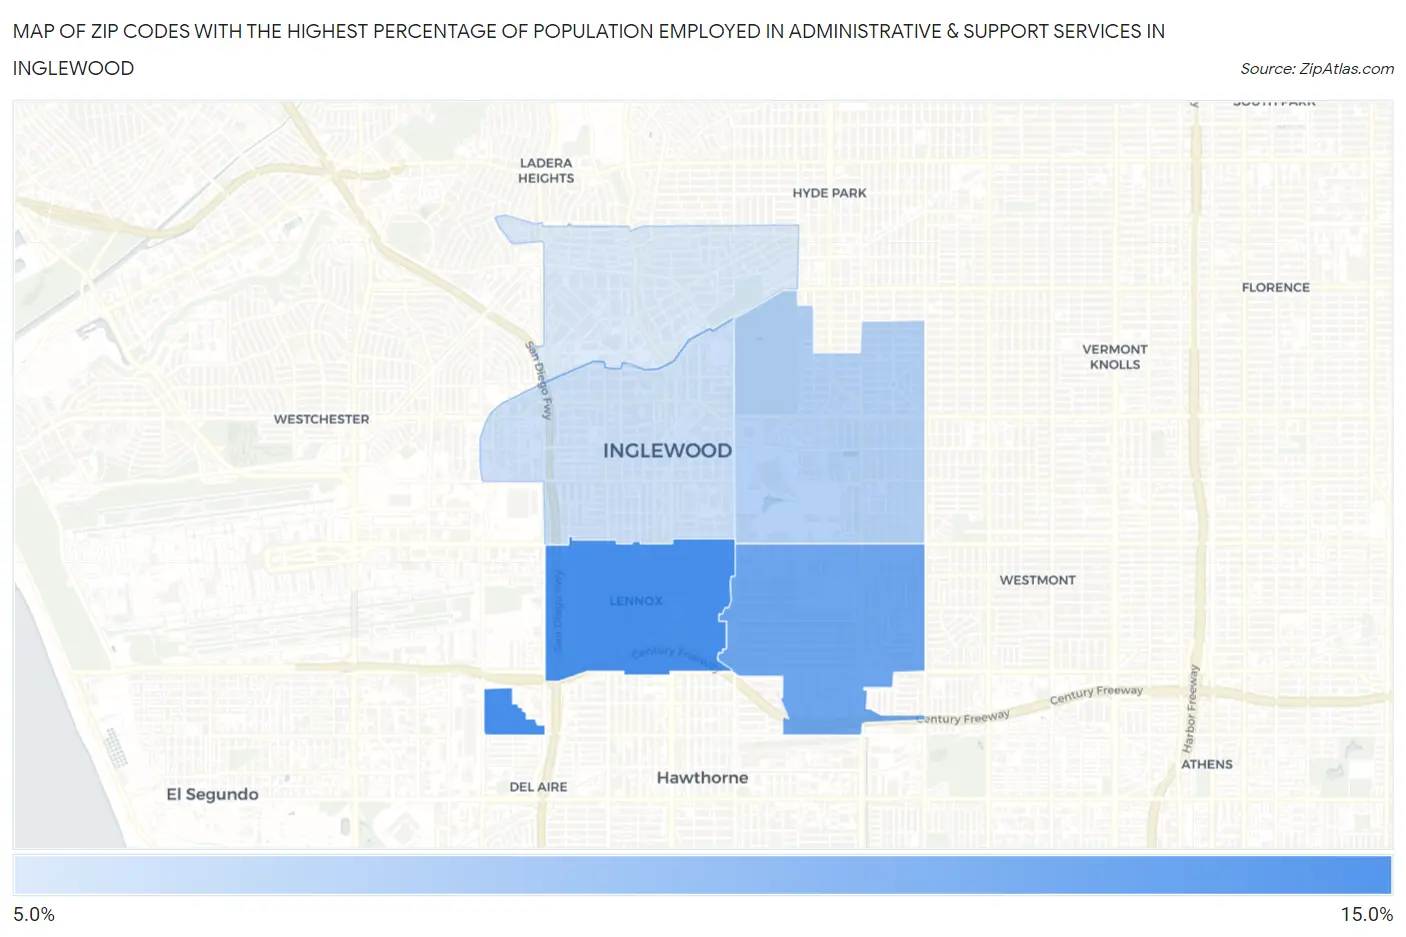
Map of Zip Codes with the Highest Percentage of Population Employed in Administrative & Support Services in Inglewood
6.4%
10.2%
Zip Codes with the Highest Percentage of Population Employed in Administrative & Support Services in Inglewood, CA
| Zip Code | % Employed | vs State | vs National | |
| 1. | 90304 | 10.2% | 4.6%(+5.66)#83 | 4.1%(+6.08)#1,215 |
| 2. | 90303 | 9.2% | 4.6%(+4.63)#106 | 4.1%(+5.05)#1,587 |
| 3. | 90305 | 7.5% | 4.6%(+2.88)#185 | 4.1%(+3.30)#2,740 |
| 4. | 90301 | 6.9% | 4.6%(+2.30)#241 | 4.1%(+2.72)#3,395 |
| 5. | 90302 | 6.4% | 4.6%(+1.87)#292 | 4.1%(+2.29)#4,009 |
1
Common Questions
What are the Top 3 Zip Codes with the Highest Percentage of Population Employed in Administrative & Support Services in Inglewood, CA?
Top 3 Zip Codes with the Highest Percentage of Population Employed in Administrative & Support Services in Inglewood, CA are:
What zip code has the Highest Percentage of Population Employed in Administrative & Support Services in Inglewood, CA?
90304 has the Highest Percentage of Population Employed in Administrative & Support Services in Inglewood, CA with 10.2%.
What is the Percentage of Population Employed in Administrative & Support Services in Inglewood, CA?
Percentage of Population Employed in Administrative & Support Services in Inglewood is 7.4%.
What is the Percentage of Population Employed in Administrative & Support Services in California?
Percentage of Population Employed in Administrative & Support Services in California is 4.6%.
What is the Percentage of Population Employed in Administrative & Support Services in the United States?
Percentage of Population Employed in Administrative & Support Services in the United States is 4.1%.