Zip Codes with the Highest Percentage of Population Employed in Professional & Scientific Services in Los Angeles, CA
RELATED REPORTS & OPTIONS
Professional & Scientific Services
Los Angeles
Compare Zip Codes
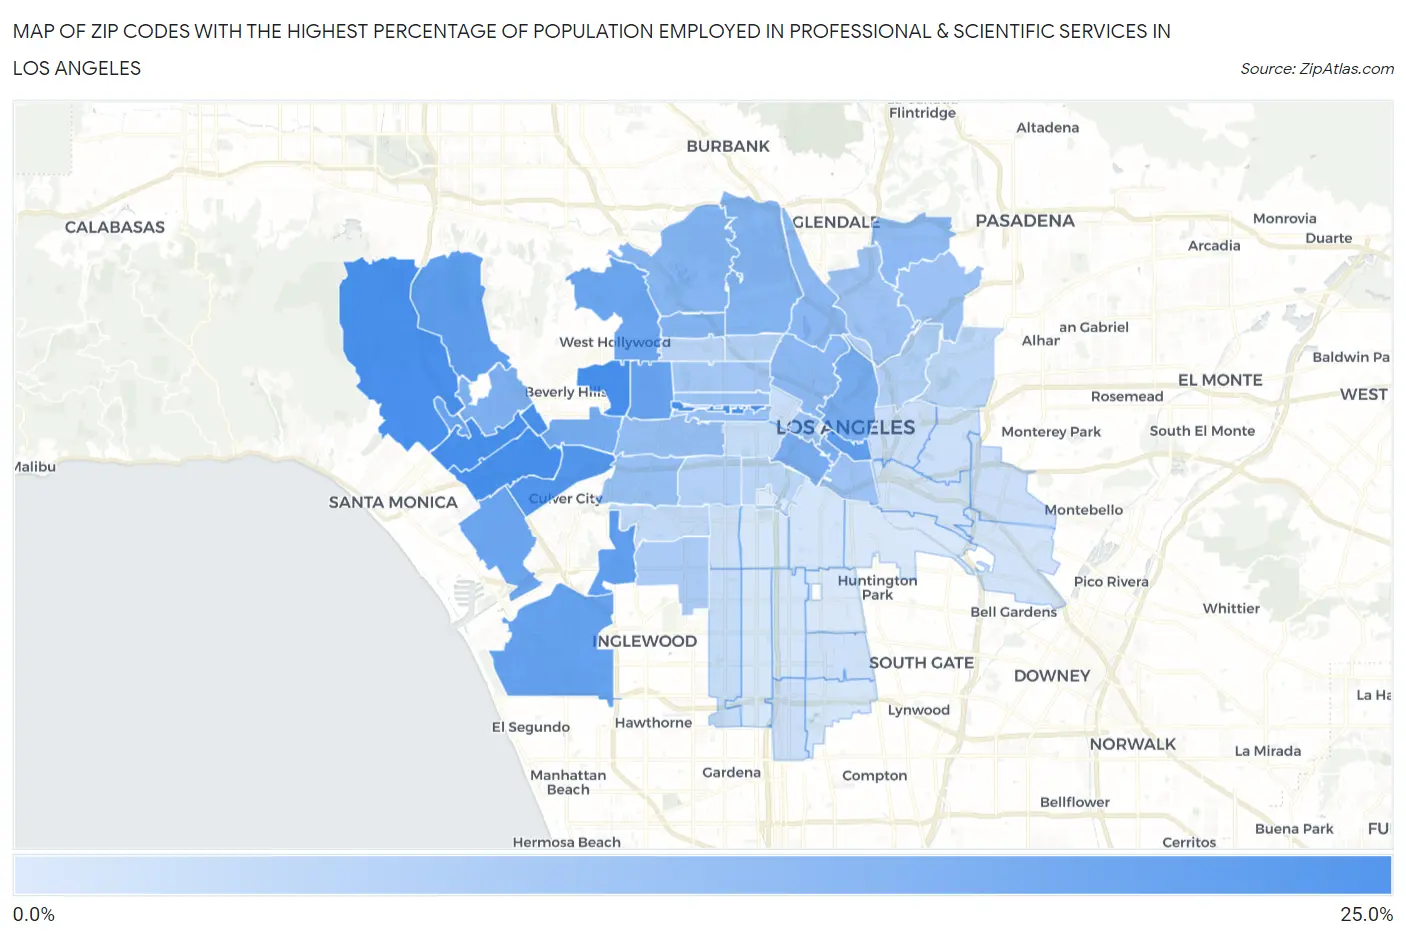
Map of Zip Codes with the Highest Percentage of Population Employed in Professional & Scientific Services in Los Angeles
1.1%
23.3%
Zip Codes with the Highest Percentage of Population Employed in Professional & Scientific Services in Los Angeles, CA
| Zip Code | % Employed | vs State | vs National | |
| 1. | 90064 | 23.3% | 9.4%(+13.9)#86 | 7.8%(+15.5)#541 |
| 2. | 90010 | 23.3% | 9.4%(+13.9)#87 | 7.8%(+15.5)#542 |
| 3. | 90067 | 23.2% | 9.4%(+13.8)#88 | 7.8%(+15.4)#554 |
| 4. | 90048 | 23.2% | 9.4%(+13.8)#90 | 7.8%(+15.3)#560 |
| 5. | 90025 | 23.2% | 9.4%(+13.8)#91 | 7.8%(+15.3)#562 |
| 6. | 90049 | 23.0% | 9.4%(+13.5)#96 | 7.8%(+15.1)#580 |
| 7. | 90034 | 21.5% | 9.4%(+12.0)#118 | 7.8%(+13.6)#725 |
| 8. | 90077 | 19.3% | 9.4%(+9.85)#161 | 7.8%(+11.4)#973 |
| 9. | 90013 | 19.1% | 9.4%(+9.69)#165 | 7.8%(+11.3)#987 |
| 10. | 90056 | 19.1% | 9.4%(+9.67)#166 | 7.8%(+11.3)#989 |
| 11. | 90045 | 18.5% | 9.4%(+9.11)#182 | 7.8%(+10.7)#1,067 |
| 12. | 90036 | 18.2% | 9.4%(+8.75)#193 | 7.8%(+10.3)#1,129 |
| 13. | 90073 | 17.9% | 9.4%(+8.42)#205 | 7.8%(+10.0)#1,184 |
| 14. | 90066 | 17.4% | 9.4%(+8.01)#212 | 7.8%(+9.60)#1,265 |
| 15. | 90046 | 17.3% | 9.4%(+7.89)#217 | 7.8%(+9.47)#1,286 |
| 16. | 90035 | 16.0% | 9.4%(+6.52)#264 | 7.8%(+8.10)#1,627 |
| 17. | 90012 | 15.8% | 9.4%(+6.36)#269 | 7.8%(+7.95)#1,662 |
| 18. | 90015 | 15.6% | 9.4%(+6.12)#274 | 7.8%(+7.71)#1,729 |
| 19. | 90014 | 15.1% | 9.4%(+5.67)#292 | 7.8%(+7.25)#1,867 |
| 20. | 90024 | 14.5% | 9.4%(+5.04)#314 | 7.8%(+6.63)#2,099 |
| 21. | 90027 | 14.1% | 9.4%(+4.66)#326 | 7.8%(+6.24)#2,240 |
| 22. | 90028 | 13.9% | 9.4%(+4.44)#331 | 7.8%(+6.03)#2,322 |
| 23. | 90068 | 13.7% | 9.4%(+4.26)#340 | 7.8%(+5.85)#2,391 |
| 24. | 90026 | 13.0% | 9.4%(+3.58)#370 | 7.8%(+5.17)#2,710 |
| 25. | 90039 | 12.9% | 9.4%(+3.47)#373 | 7.8%(+5.06)#2,751 |
| 26. | 90041 | 12.1% | 9.4%(+2.65)#415 | 7.8%(+4.24)#3,150 |
| 27. | 90019 | 11.7% | 9.4%(+2.24)#432 | 7.8%(+3.82)#3,403 |
| 28. | 90016 | 11.1% | 9.4%(+1.67)#466 | 7.8%(+3.26)#3,780 |
| 29. | 90005 | 11.0% | 9.4%(+1.57)#469 | 7.8%(+3.16)#3,831 |
| 30. | 90017 | 10.9% | 9.4%(+1.51)#475 | 7.8%(+3.10)#3,882 |
| 31. | 90065 | 10.4% | 9.4%(+0.936)#513 | 7.8%(+2.52)#4,302 |
| 32. | 90042 | 10.3% | 9.4%(+0.832)#521 | 7.8%(+2.42)#4,366 |
| 33. | 90021 | 10.3% | 9.4%(+0.830)#522 | 7.8%(+2.42)#4,368 |
| 34. | 90020 | 10.2% | 9.4%(+0.804)#523 | 7.8%(+2.39)#4,394 |
| 35. | 90004 | 9.3% | 9.4%(-0.137)#586 | 7.8%(+1.45)#5,193 |
| 36. | 90043 | 8.1% | 9.4%(-1.37)#685 | 7.8%(+0.220)#6,568 |
| 37. | 90029 | 7.3% | 9.4%(-2.11)#758 | 7.8%(-0.519)#7,615 |
| 38. | 90031 | 7.0% | 9.4%(-2.39)#789 | 7.8%(-0.804)#8,097 |
| 39. | 90018 | 7.0% | 9.4%(-2.47)#796 | 7.8%(-0.879)#8,234 |
| 40. | 90038 | 6.2% | 9.4%(-3.25)#871 | 7.8%(-1.66)#9,603 |
| 41. | 90032 | 5.8% | 9.4%(-3.60)#910 | 7.8%(-2.02)#10,293 |
| 42. | 90007 | 5.7% | 9.4%(-3.70)#918 | 7.8%(-2.11)#10,494 |
| 43. | 90008 | 4.8% | 9.4%(-4.68)#1,052 | 7.8%(-3.09)#12,957 |
| 44. | 90006 | 4.4% | 9.4%(-5.02)#1,096 | 7.8%(-3.44)#13,914 |
| 45. | 90047 | 4.3% | 9.4%(-5.11)#1,105 | 7.8%(-3.52)#14,153 |
| 46. | 90057 | 3.8% | 9.4%(-5.68)#1,174 | 7.8%(-4.09)#15,860 |
| 47. | 90033 | 3.6% | 9.4%(-5.80)#1,194 | 7.8%(-4.22)#16,262 |
| 48. | 90061 | 3.5% | 9.4%(-5.90)#1,205 | 7.8%(-4.31)#16,592 |
| 49. | 90022 | 3.5% | 9.4%(-5.91)#1,207 | 7.8%(-4.33)#16,665 |
| 50. | 90063 | 3.3% | 9.4%(-6.18)#1,233 | 7.8%(-4.59)#17,532 |
| 51. | 90062 | 3.2% | 9.4%(-6.20)#1,236 | 7.8%(-4.61)#17,602 |
| 52. | 90002 | 3.0% | 9.4%(-6.42)#1,269 | 7.8%(-4.83)#18,386 |
| 53. | 90040 | 2.8% | 9.4%(-6.63)#1,286 | 7.8%(-5.04)#19,129 |
| 54. | 90023 | 2.7% | 9.4%(-6.69)#1,291 | 7.8%(-5.10)#19,344 |
| 55. | 90011 | 2.4% | 9.4%(-7.04)#1,329 | 7.8%(-5.45)#20,558 |
| 56. | 90003 | 2.2% | 9.4%(-7.20)#1,360 | 7.8%(-5.62)#21,128 |
| 57. | 90044 | 2.1% | 9.4%(-7.33)#1,373 | 7.8%(-5.74)#21,550 |
| 58. | 90037 | 2.0% | 9.4%(-7.39)#1,383 | 7.8%(-5.80)#21,726 |
| 59. | 90059 | 2.0% | 9.4%(-7.48)#1,391 | 7.8%(-5.89)#22,030 |
| 60. | 90001 | 1.9% | 9.4%(-7.56)#1,403 | 7.8%(-5.97)#22,305 |
| 61. | 90058 | 1.6% | 9.4%(-7.79)#1,427 | 7.8%(-6.21)#23,094 |
| 62. | 90089 | 1.1% | 9.4%(-8.30)#1,463 | 7.8%(-6.71)#24,676 |
1
Common Questions
What are the Top 10 Zip Codes with the Highest Percentage of Population Employed in Professional & Scientific Services in Los Angeles, CA?
Top 10 Zip Codes with the Highest Percentage of Population Employed in Professional & Scientific Services in Los Angeles, CA are:
What zip code has the Highest Percentage of Population Employed in Professional & Scientific Services in Los Angeles, CA?
90064 has the Highest Percentage of Population Employed in Professional & Scientific Services in Los Angeles, CA with 23.3%.
What is the Percentage of Population Employed in Professional & Scientific Services in Los Angeles, CA?
Percentage of Population Employed in Professional & Scientific Services in Los Angeles is 9.7%.
What is the Percentage of Population Employed in Professional & Scientific Services in California?
Percentage of Population Employed in Professional & Scientific Services in California is 9.4%.
What is the Percentage of Population Employed in Professional & Scientific Services in the United States?
Percentage of Population Employed in Professional & Scientific Services in the United States is 7.8%.