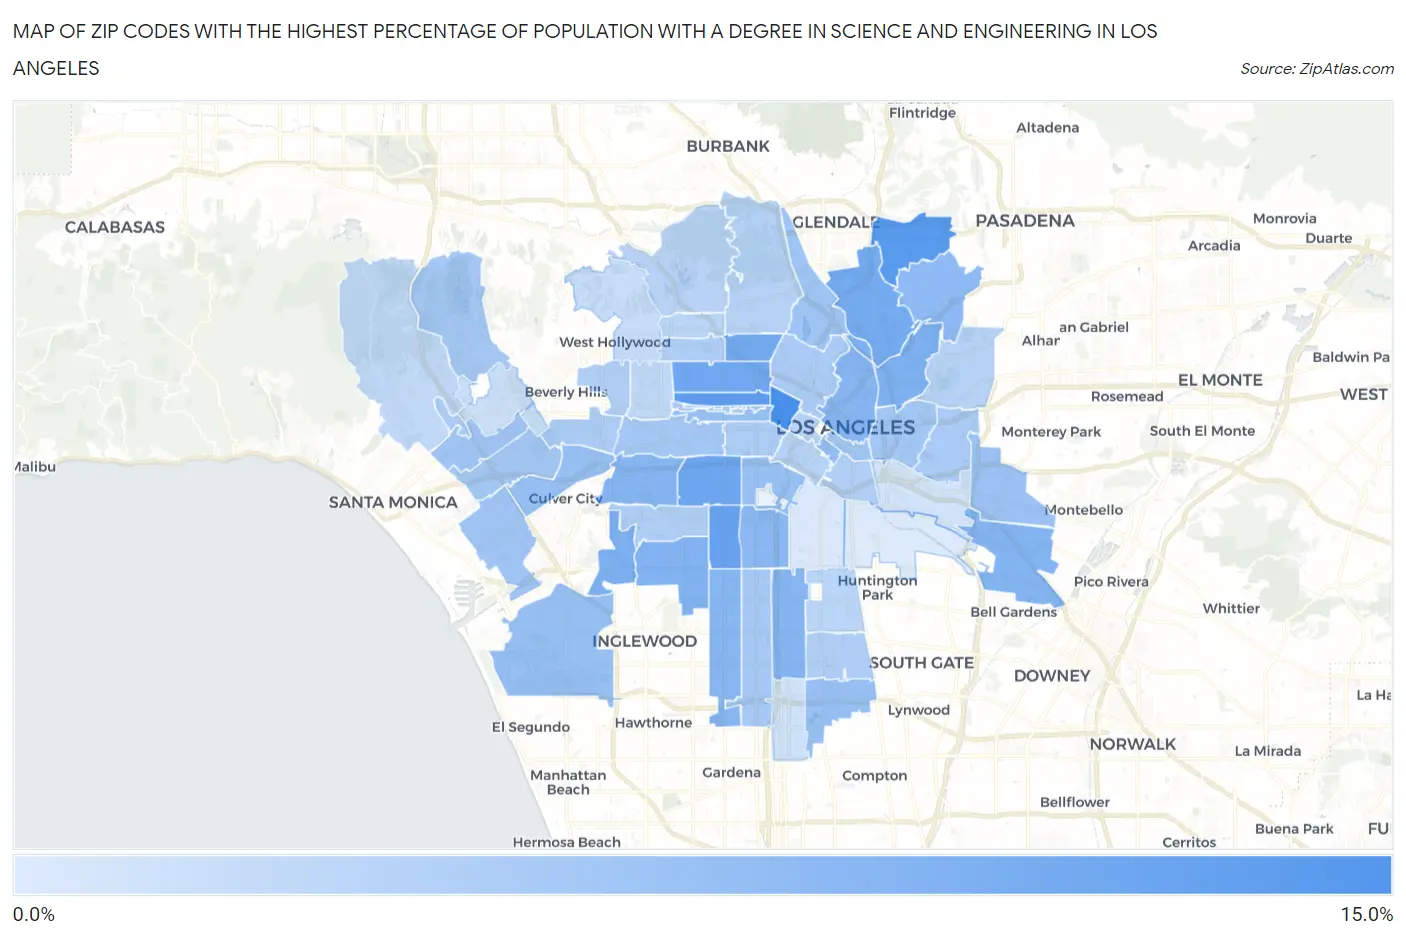
Zip Codes with the Highest Percentage of Population with a Degree in Science and Engineering in Los Angeles, CA
RELATED REPORTS & OPTIONS
Science and Engineering
Los Angeles
Compare Zip Codes
Map of Zip Codes with the Highest Percentage of Population with a Degree in Science and Engineering in Los Angeles
2.9%
12.6%
Zip Codes with the Highest Percentage of Population with a Degree in Science and Engineering in Los Angeles, CA
| Zip Code | % Graduates | vs State | vs National | |
| 1. | 90057 | 12.6% | 8.3%(+4.38)#244 | 9.8%(+2.86)#9,794 |
| 2. | 90041 | 11.6% | 8.3%(+3.30)#319 | 9.8%(+1.78)#11,714 |
| 3. | 90020 | 11.1% | 8.3%(+2.87)#352 | 9.8%(+1.35)#12,566 |
| 4. | 90062 | 10.5% | 8.3%(+2.22)#416 | 9.8%(+0.697)#14,011 |
| 5. | 90018 | 10.1% | 8.3%(+1.79)#465 | 9.8%(+0.271)#14,910 |
| 6. | 90004 | 9.8% | 8.3%(+1.54)#503 | 9.8%(+0.018)#15,474 |
| 7. | 90029 | 9.7% | 8.3%(+1.39)#517 | 9.8%(-0.127)#15,810 |
| 8. | 90065 | 9.6% | 8.3%(+1.35)#529 | 9.8%(-0.169)#15,897 |
| 9. | 90056 | 9.1% | 8.3%(+0.863)#592 | 9.8%(-0.659)#17,029 |
| 10. | 90031 | 8.9% | 8.3%(+0.651)#622 | 9.8%(-0.870)#17,524 |
| 11. | 90043 | 8.7% | 8.3%(+0.462)#657 | 9.8%(-1.06)#17,969 |
| 12. | 90040 | 8.7% | 8.3%(+0.404)#671 | 9.8%(-1.12)#18,125 |
| 13. | 90003 | 8.5% | 8.3%(+0.266)#694 | 9.8%(-1.26)#18,403 |
| 14. | 90016 | 8.4% | 8.3%(+0.188)#708 | 9.8%(-1.33)#18,591 |
| 15. | 90012 | 8.4% | 8.3%(+0.125)#719 | 9.8%(-1.40)#18,729 |
| 16. | 90047 | 8.4% | 8.3%(+0.095)#723 | 9.8%(-1.43)#18,802 |
| 17. | 90037 | 8.1% | 8.3%(-0.134)#767 | 9.8%(-1.66)#19,366 |
| 18. | 90042 | 7.8% | 8.3%(-0.431)#829 | 9.8%(-1.95)#20,030 |
| 19. | 90014 | 7.7% | 8.3%(-0.512)#842 | 9.8%(-2.03)#20,184 |
| 20. | 90005 | 7.5% | 8.3%(-0.773)#886 | 9.8%(-2.29)#20,752 |
| 21. | 90045 | 7.3% | 8.3%(-0.919)#909 | 9.8%(-2.44)#21,056 |
| 22. | 90059 | 7.3% | 8.3%(-0.954)#918 | 9.8%(-2.48)#21,122 |
| 23. | 90034 | 7.3% | 8.3%(-0.966)#922 | 9.8%(-2.49)#21,141 |
| 24. | 90007 | 7.3% | 8.3%(-0.969)#924 | 9.8%(-2.49)#21,151 |
| 25. | 90022 | 6.9% | 8.3%(-1.34)#995 | 9.8%(-2.86)#21,849 |
| 26. | 90039 | 6.8% | 8.3%(-1.47)#1,019 | 9.8%(-2.99)#22,090 |
| 27. | 90066 | 6.7% | 8.3%(-1.53)#1,030 | 9.8%(-3.05)#22,184 |
| 28. | 90025 | 6.7% | 8.3%(-1.56)#1,036 | 9.8%(-3.08)#22,230 |
| 29. | 90013 | 6.7% | 8.3%(-1.59)#1,040 | 9.8%(-3.11)#22,273 |
| 30. | 90019 | 6.6% | 8.3%(-1.66)#1,050 | 9.8%(-3.18)#22,412 |
| 31. | 90033 | 6.5% | 8.3%(-1.72)#1,060 | 9.8%(-3.24)#22,513 |
| 32. | 90064 | 6.5% | 8.3%(-1.75)#1,069 | 9.8%(-3.27)#22,573 |
| 33. | 90044 | 6.5% | 8.3%(-1.80)#1,084 | 9.8%(-3.32)#22,648 |
| 34. | 90077 | 6.4% | 8.3%(-1.88)#1,094 | 9.8%(-3.40)#22,791 |
| 35. | 90073 | 6.2% | 8.3%(-2.11)#1,132 | 9.8%(-3.63)#23,209 |
| 36. | 90010 | 6.1% | 8.3%(-2.15)#1,145 | 9.8%(-3.67)#23,271 |
| 37. | 90063 | 6.1% | 8.3%(-2.19)#1,152 | 9.8%(-3.71)#23,332 |
| 38. | 90026 | 6.0% | 8.3%(-2.23)#1,155 | 9.8%(-3.75)#23,393 |
| 39. | 90035 | 6.0% | 8.3%(-2.30)#1,170 | 9.8%(-3.82)#23,492 |
| 40. | 90006 | 5.9% | 8.3%(-2.37)#1,181 | 9.8%(-3.89)#23,603 |
| 41. | 90002 | 5.8% | 8.3%(-2.43)#1,190 | 9.8%(-3.95)#23,711 |
| 42. | 90038 | 5.8% | 8.3%(-2.46)#1,193 | 9.8%(-3.98)#23,747 |
| 43. | 90008 | 5.8% | 8.3%(-2.50)#1,198 | 9.8%(-4.02)#23,796 |
| 44. | 90021 | 5.7% | 8.3%(-2.53)#1,203 | 9.8%(-4.05)#23,828 |
| 45. | 90048 | 5.7% | 8.3%(-2.60)#1,215 | 9.8%(-4.12)#23,928 |
| 46. | 90032 | 5.4% | 8.3%(-2.83)#1,250 | 9.8%(-4.35)#24,210 |
| 47. | 90027 | 5.4% | 8.3%(-2.84)#1,251 | 9.8%(-4.36)#24,217 |
| 48. | 90015 | 5.4% | 8.3%(-2.88)#1,255 | 9.8%(-4.40)#24,282 |
| 49. | 90068 | 5.3% | 8.3%(-3.00)#1,264 | 9.8%(-4.52)#24,424 |
| 50. | 90017 | 5.2% | 8.3%(-3.02)#1,266 | 9.8%(-4.54)#24,447 |
| 51. | 90001 | 5.1% | 8.3%(-3.13)#1,280 | 9.8%(-4.65)#24,586 |
| 52. | 90028 | 5.1% | 8.3%(-3.16)#1,283 | 9.8%(-4.68)#24,627 |
| 53. | 90036 | 4.8% | 8.3%(-3.44)#1,312 | 9.8%(-4.96)#24,945 |
| 54. | 90049 | 4.6% | 8.3%(-3.63)#1,330 | 9.8%(-5.15)#25,160 |
| 55. | 90067 | 4.3% | 8.3%(-3.98)#1,358 | 9.8%(-5.50)#25,479 |
| 56. | 90046 | 4.2% | 8.3%(-4.01)#1,361 | 9.8%(-5.54)#25,516 |
| 57. | 90024 | 3.9% | 8.3%(-4.34)#1,379 | 9.8%(-5.86)#25,798 |
| 58. | 90061 | 3.8% | 8.3%(-4.50)#1,390 | 9.8%(-6.02)#25,954 |
| 59. | 90023 | 3.6% | 8.3%(-4.68)#1,399 | 9.8%(-6.20)#26,082 |
| 60. | 90011 | 3.1% | 8.3%(-5.20)#1,416 | 9.8%(-6.72)#26,427 |
| 61. | 90058 | 2.9% | 8.3%(-5.35)#1,421 | 9.8%(-6.87)#26,527 |
1
Common Questions
What are the Top 10 Zip Codes with the Highest Percentage of Population with a Degree in Science and Engineering in Los Angeles, CA?
Top 10 Zip Codes with the Highest Percentage of Population with a Degree in Science and Engineering in Los Angeles, CA are:
What zip code has the Highest Percentage of Population with a Degree in Science and Engineering in Los Angeles, CA?
90057 has the Highest Percentage of Population with a Degree in Science and Engineering in Los Angeles, CA with 12.6%.
What is the Percentage of Population with a Degree in Science and Engineering in Los Angeles, CA?
Percentage of Population with a Degree in Science and Engineering in Los Angeles is 7.2%.
What is the Percentage of Population with a Degree in Science and Engineering in California?
Percentage of Population with a Degree in Science and Engineering in California is 8.3%.
What is the Percentage of Population with a Degree in Science and Engineering in the United States?
Percentage of Population with a Degree in Science and Engineering in the United States is 9.8%.