Zip Codes with the Highest Percentage of Population Employed in Accommodation & Food Services in Los Angeles, CA
RELATED REPORTS & OPTIONS
Accommodation & Food Services
Los Angeles
Compare Zip Codes
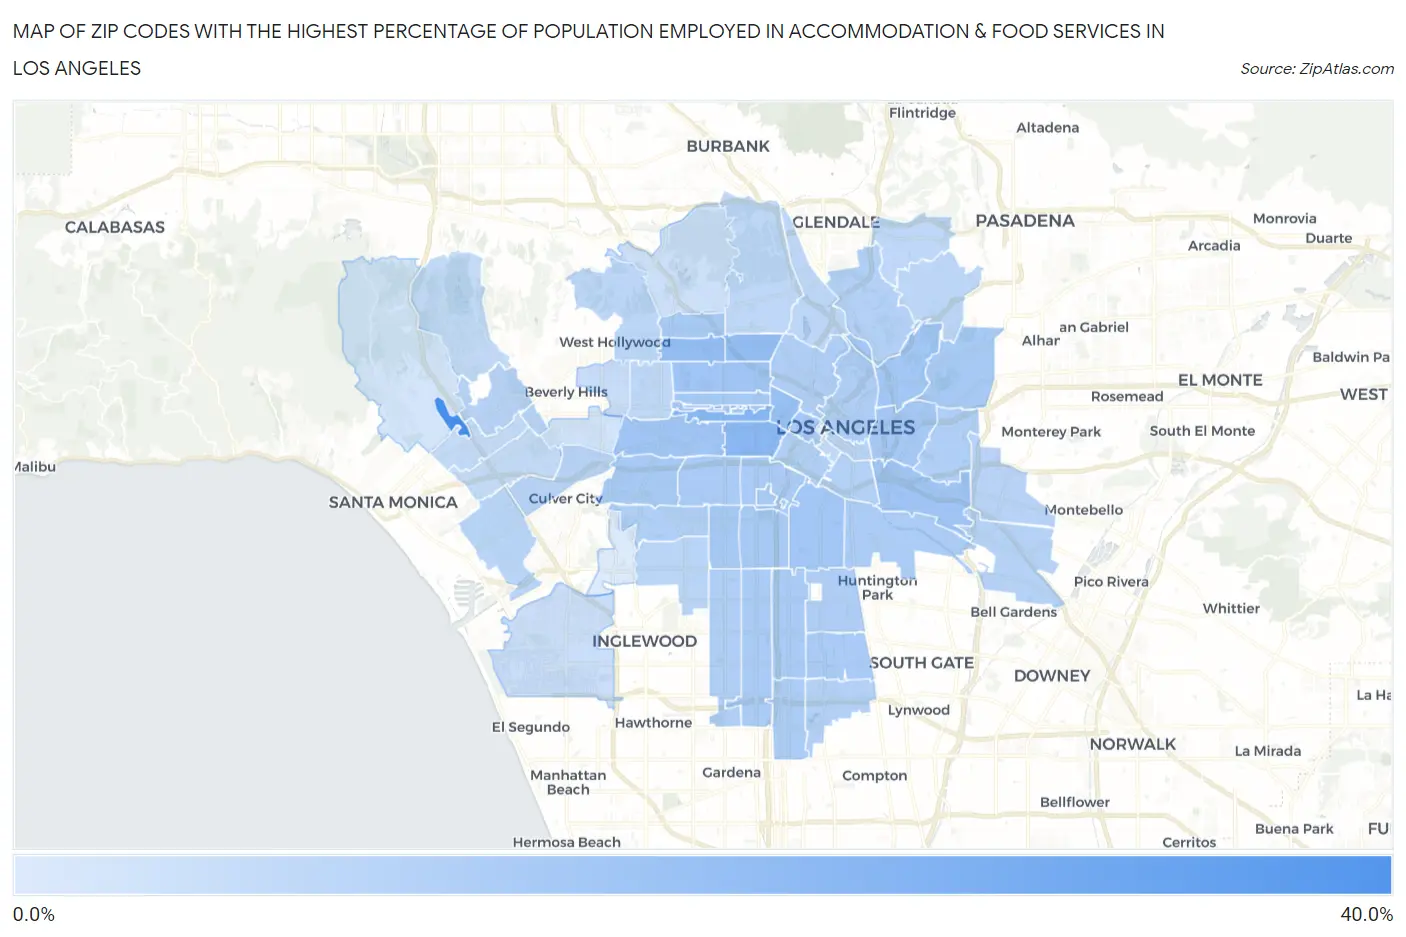
Map of Zip Codes with the Highest Percentage of Population Employed in Accommodation & Food Services in Los Angeles
0.33%
32.1%
Zip Codes with the Highest Percentage of Population Employed in Accommodation & Food Services in Los Angeles, CA
| Zip Code | % Employed | vs State | vs National | |
| 1. | 90073 | 32.1% | 7.2%(+25.0)#27 | 6.9%(+25.3)#278 |
| 2. | 90005 | 17.4% | 7.2%(+10.2)#83 | 6.9%(+10.5)#1,197 |
| 3. | 90006 | 17.0% | 7.2%(+9.81)#94 | 6.9%(+10.1)#1,273 |
| 4. | 90029 | 15.1% | 7.2%(+7.95)#111 | 6.9%(+8.24)#1,641 |
| 5. | 90038 | 14.7% | 7.2%(+7.50)#120 | 6.9%(+7.79)#1,763 |
| 6. | 90057 | 14.0% | 7.2%(+6.80)#134 | 6.9%(+7.09)#1,980 |
| 7. | 90004 | 12.2% | 7.2%(+5.02)#169 | 6.9%(+5.31)#2,721 |
| 8. | 90023 | 12.1% | 7.2%(+4.96)#173 | 6.9%(+5.25)#2,759 |
| 9. | 90019 | 12.0% | 7.2%(+4.87)#176 | 6.9%(+5.16)#2,811 |
| 10. | 90011 | 11.7% | 7.2%(+4.56)#191 | 6.9%(+4.85)#3,003 |
| 11. | 90031 | 11.5% | 7.2%(+4.29)#204 | 6.9%(+4.58)#3,185 |
| 12. | 90010 | 11.0% | 7.2%(+3.85)#219 | 6.9%(+4.14)#3,537 |
| 13. | 90017 | 11.0% | 7.2%(+3.83)#221 | 6.9%(+4.12)#3,553 |
| 14. | 90033 | 10.9% | 7.2%(+3.74)#228 | 6.9%(+4.03)#3,631 |
| 15. | 90028 | 10.8% | 7.2%(+3.67)#232 | 6.9%(+3.96)#3,691 |
| 16. | 90016 | 10.8% | 7.2%(+3.66)#233 | 6.9%(+3.95)#3,699 |
| 17. | 90037 | 10.7% | 7.2%(+3.57)#236 | 6.9%(+3.86)#3,760 |
| 18. | 90089 | 10.7% | 7.2%(+3.56)#238 | 6.9%(+3.85)#3,777 |
| 19. | 90020 | 10.7% | 7.2%(+3.51)#245 | 6.9%(+3.80)#3,815 |
| 20. | 90062 | 10.6% | 7.2%(+3.41)#254 | 6.9%(+3.70)#3,907 |
| 21. | 90032 | 10.4% | 7.2%(+3.25)#262 | 6.9%(+3.54)#4,077 |
| 22. | 90003 | 10.3% | 7.2%(+3.10)#269 | 6.9%(+3.39)#4,218 |
| 23. | 90002 | 10.2% | 7.2%(+3.06)#272 | 6.9%(+3.35)#4,272 |
| 24. | 90007 | 10.1% | 7.2%(+2.92)#284 | 6.9%(+3.21)#4,422 |
| 25. | 90044 | 10.0% | 7.2%(+2.87)#288 | 6.9%(+3.16)#4,480 |
| 26. | 90018 | 9.9% | 7.2%(+2.76)#299 | 6.9%(+3.05)#4,629 |
| 27. | 90058 | 9.5% | 7.2%(+2.35)#338 | 6.9%(+2.64)#5,188 |
| 28. | 90061 | 9.5% | 7.2%(+2.32)#344 | 6.9%(+2.61)#5,228 |
| 29. | 90012 | 9.3% | 7.2%(+2.17)#364 | 6.9%(+2.46)#5,441 |
| 30. | 90001 | 9.3% | 7.2%(+2.12)#371 | 6.9%(+2.41)#5,522 |
| 31. | 90026 | 9.0% | 7.2%(+1.87)#394 | 6.9%(+2.16)#5,894 |
| 32. | 90063 | 8.9% | 7.2%(+1.76)#404 | 6.9%(+2.05)#6,067 |
| 33. | 90008 | 8.7% | 7.2%(+1.55)#418 | 6.9%(+1.84)#6,438 |
| 34. | 90015 | 8.7% | 7.2%(+1.51)#425 | 6.9%(+1.80)#6,510 |
| 35. | 90047 | 8.6% | 7.2%(+1.48)#426 | 6.9%(+1.77)#6,553 |
| 36. | 90059 | 8.5% | 7.2%(+1.32)#450 | 6.9%(+1.61)#6,829 |
| 37. | 90021 | 8.4% | 7.2%(+1.25)#467 | 6.9%(+1.54)#6,958 |
| 38. | 90065 | 8.2% | 7.2%(+0.989)#502 | 6.9%(+1.28)#7,514 |
| 39. | 90040 | 8.0% | 7.2%(+0.849)#521 | 6.9%(+1.14)#7,782 |
| 40. | 90067 | 7.7% | 7.2%(+0.488)#590 | 6.9%(+0.778)#8,603 |
| 41. | 90013 | 7.5% | 7.2%(+0.328)#615 | 6.9%(+0.618)#8,998 |
| 42. | 90034 | 7.4% | 7.2%(+0.189)#636 | 6.9%(+0.479)#9,351 |
| 43. | 90022 | 7.3% | 7.2%(+0.143)#645 | 6.9%(+0.433)#9,473 |
| 44. | 90024 | 7.2% | 7.2%(+0.042)#677 | 6.9%(+0.332)#9,773 |
| 45. | 90066 | 6.8% | 7.2%(-0.349)#748 | 6.9%(-0.059)#10,825 |
| 46. | 90043 | 6.7% | 7.2%(-0.424)#763 | 6.9%(-0.134)#11,051 |
| 47. | 90042 | 6.6% | 7.2%(-0.552)#795 | 6.9%(-0.262)#11,455 |
| 48. | 90046 | 6.5% | 7.2%(-0.626)#818 | 6.9%(-0.336)#11,696 |
| 49. | 90039 | 6.4% | 7.2%(-0.804)#859 | 6.9%(-0.514)#12,269 |
| 50. | 90027 | 6.1% | 7.2%(-1.08)#915 | 6.9%(-0.793)#13,182 |
| 51. | 90041 | 5.9% | 7.2%(-1.24)#944 | 6.9%(-0.950)#13,673 |
| 52. | 90036 | 5.8% | 7.2%(-1.37)#958 | 6.9%(-1.08)#14,070 |
| 53. | 90014 | 5.5% | 7.2%(-1.72)#1,025 | 6.9%(-1.43)#15,207 |
| 54. | 90077 | 5.1% | 7.2%(-2.07)#1,097 | 6.9%(-1.78)#16,448 |
| 55. | 90064 | 5.0% | 7.2%(-2.21)#1,123 | 6.9%(-1.92)#16,951 |
| 56. | 90025 | 4.9% | 7.2%(-2.23)#1,126 | 6.9%(-1.94)#17,009 |
| 57. | 90048 | 4.3% | 7.2%(-2.84)#1,241 | 6.9%(-2.55)#19,088 |
| 58. | 90045 | 3.7% | 7.2%(-3.42)#1,320 | 6.9%(-3.13)#20,958 |
| 59. | 90068 | 3.4% | 7.2%(-3.73)#1,359 | 6.9%(-3.44)#21,962 |
| 60. | 90035 | 2.5% | 7.2%(-4.71)#1,455 | 6.9%(-4.42)#24,570 |
| 61. | 90049 | 1.9% | 7.2%(-5.25)#1,486 | 6.9%(-4.96)#25,721 |
| 62. | 90056 | 0.33% | 7.2%(-6.84)#1,544 | 6.9%(-6.55)#27,973 |
1
Common Questions
What are the Top 10 Zip Codes with the Highest Percentage of Population Employed in Accommodation & Food Services in Los Angeles, CA?
Top 10 Zip Codes with the Highest Percentage of Population Employed in Accommodation & Food Services in Los Angeles, CA are:
What zip code has the Highest Percentage of Population Employed in Accommodation & Food Services in Los Angeles, CA?
90073 has the Highest Percentage of Population Employed in Accommodation & Food Services in Los Angeles, CA with 32.1%.
What is the Percentage of Population Employed in Accommodation & Food Services in Los Angeles, CA?
Percentage of Population Employed in Accommodation & Food Services in Los Angeles is 8.2%.
What is the Percentage of Population Employed in Accommodation & Food Services in California?
Percentage of Population Employed in Accommodation & Food Services in California is 7.2%.
What is the Percentage of Population Employed in Accommodation & Food Services in the United States?
Percentage of Population Employed in Accommodation & Food Services in the United States is 6.9%.