Zip Codes with the Lowest Poverty Level Among Children Under the Age of 5 in Los Angeles, CA

RELATED REPORTS & OPTIONS

Lowest Poverty | Child 0-5
Population
Families and Households
Female Fertility
Female Fertility (Unmarried)
Race (Community Size)
Race (Percentage)
Ancestry (Community Size)
AfghanAfricanAlaska NativeAlaskan AthabascanAlbanianAlsatianAmericanApacheArabArgentineanArmenianAssyrian / Chaldean / SyriacAustralianAustrianBahamianBangladeshiBarbadianBasqueBelgianBelizeanBhutaneseBlackfeetBolivianBrazilianBritishBritish West IndianBulgarianBurmeseCajunCambodianCanadianCape VerdeanCarpatho RusynCelticCentral AmericanCentral American IndianCherokeeCheyenneChickasawChileanChineseChippewaChoctawColombianColvilleComancheCosta RicanCreeCreekCroatianCubanCypriotCzechCzechoslovakianDanishDelawareDominicanDutchEastern EuropeanEcuadorianEgyptianEnglishEstonianEthiopianEuropeanFilipinoFinnishFrenchFrench American IndianFrench CanadianGermanGerman RussianGhanaianGreekGuamanian / ChamorroGuatemalanGuyaneseHaitianHonduranHopiHungarianIcelanderIndian (Asian)IndonesianIranianIraqiIrishIroquoisIsraeliItalianJamaicanJapaneseJordanianKenyanKiowaKoreanLaotianLatvianLebaneseLiberianLithuanianLumbeeLuxembourgerMacedonianMalaysianMalteseMexicanMexican American IndianMongolianMoroccanNative HawaiianNavajoNew ZealanderNicaraguanNigerianNorthern EuropeanNorwegianOkinawanOsagePaiutePakistaniPalestinianPanamanianParaguayanPennsylvania GermanPeruvianPimaPolishPortuguesePotawatomiPuebloPuerto RicanPuget Sound SalishRomanianRussianSalvadoranSamoanScandinavianScotch-IrishScottishSeminoleSenegaleseSerbianShoshoneSierra LeoneanSiouxSlavicSlovakSloveneSomaliSouth AfricanSouth AmericanSouth American IndianSoviet UnionSpaniardSpanishSpanish AmericanSpanish American IndianSri LankanSubsaharan AfricanSudaneseSwedishSwissSyrianTaiwaneseThaiTlingit-HaidaTohono O'OdhamTonganTrinidadian and TobagonianTurkishU.S. Virgin IslanderUkrainianUruguayanUteVenezuelanVietnameseWelshWest IndianYaquiYugoslavianYumanZimbabwean
Ancestry (Percentage)
AfghanAfricanAlaska NativeAlaskan AthabascanAlbanianAlsatianAmericanApacheArabArgentineanArmenianAssyrian / Chaldean / SyriacAustralianAustrianBahamianBangladeshiBarbadianBasqueBelgianBelizeanBhutaneseBlackfeetBolivianBrazilianBritishBritish West IndianBulgarianBurmeseCajunCambodianCanadianCape VerdeanCarpatho RusynCelticCentral AmericanCentral American IndianCherokeeCheyenneChickasawChileanChineseChippewaChoctawColombianColvilleComancheCosta RicanCreeCreekCroatianCubanCypriotCzechCzechoslovakianDanishDelawareDominicanDutchEastern EuropeanEcuadorianEgyptianEnglishEstonianEthiopianEuropeanFilipinoFinnishFrenchFrench American IndianFrench CanadianGermanGerman RussianGhanaianGreekGuamanian / ChamorroGuatemalanGuyaneseHaitianHonduranHopiHungarianIcelanderIndian (Asian)IndonesianIranianIraqiIrishIroquoisIsraeliItalianJamaicanJapaneseJordanianKenyanKiowaKoreanLaotianLatvianLebaneseLiberianLithuanianLumbeeLuxembourgerMacedonianMalaysianMalteseMexicanMexican American IndianMongolianMoroccanNative HawaiianNavajoNew ZealanderNicaraguanNigerianNorthern EuropeanNorwegianOkinawanOsagePaiutePakistaniPalestinianPanamanianParaguayanPennsylvania GermanPeruvianPimaPolishPortuguesePotawatomiPuebloPuerto RicanPuget Sound SalishRomanianRussianSalvadoranSamoanScandinavianScotch-IrishScottishSeminoleSenegaleseSerbianShoshoneSierra LeoneanSiouxSlavicSlovakSloveneSomaliSouth AfricanSouth AmericanSouth American IndianSoviet UnionSpaniardSpanishSpanish AmericanSpanish American IndianSri LankanSubsaharan AfricanSudaneseSwedishSwissSyrianTaiwaneseThaiTlingit-HaidaTohono O'OdhamTonganTrinidadian and TobagonianTurkishU.S. Virgin IslanderUkrainianUruguayanUteVenezuelanVietnameseWelshWest IndianYaquiYugoslavianYumanZimbabwean
Immigrant Origin (Total)
AfghanistanAfricaArgentinaArmeniaAsiaAustraliaAustriaAzoresBahamasBangladeshBarbadosBelarusBelgiumBelizeBoliviaBosnia and HerzegovinaBrazilBulgariaBurma / MyanmarCambodiaCameroonCanadaCaribbeanCentral AmericaChileChinaColombiaCongoCosta RicaCroatiaCubaCzechoslovakiaDenmarkDominicaDominican RepublicEastern AfricaEastern AsiaEastern EuropeEcuadorEgyptEl SalvadorEnglandEritreaEthiopiaEuropeFijiFranceGermanyGhanaGreeceGrenadaGuatemalaGuyanaHaitiHondurasHong KongHungaryIndiaIndonesiaIranIraqIrelandIsraelItalyJamaicaJapanJordanKazakhstanKenyaKoreaKuwaitLaosLatin AmericaLatviaLebanonLiberiaLithuaniaMalaysiaMexicoMicronesiaMiddle AfricaMoldovaMoroccoNepalNetherlandsNicaraguaNigeriaNorthern AfricaNorthern EuropeNorwayOceaniaPakistanPanamaPeruPhilippinesPolandPortugalRomaniaRussiaSaudi ArabiaScotlandSenegalSerbiaSierra LeoneSingaporeSouth AfricaSouth AmericaSouth Central AsiaSouth Eastern AsiaSouthern EuropeSpainSri LankaSt. Vincent and the GrenadinesSudanSwedenSwitzerlandSyriaTaiwanThailandTrinidad and TobagoTurkeyUgandaUkraineUruguayUzbekistanVenezuelaVietnamWest IndiesWestern AfricaWestern AsiaWestern EuropeZaireZimbabwe
Immigrant Origin (Percentage)
AfghanistanAfricaArgentinaArmeniaAsiaAustraliaAustriaAzoresBahamasBangladeshBarbadosBelarusBelgiumBelizeBoliviaBosnia and HerzegovinaBrazilBulgariaBurma / MyanmarCambodiaCameroonCanadaCaribbeanCentral AmericaChileChinaColombiaCongoCosta RicaCroatiaCubaCzechoslovakiaDenmarkDominicaDominican RepublicEastern AfricaEastern AsiaEastern EuropeEcuadorEgyptEl SalvadorEnglandEritreaEthiopiaEuropeFijiFranceGermanyGhanaGreeceGrenadaGuatemalaGuyanaHaitiHondurasHong KongHungaryIndiaIndonesiaIranIraqIrelandIsraelItalyJamaicaJapanJordanKazakhstanKenyaKoreaKuwaitLaosLatin AmericaLatviaLebanonLiberiaLithuaniaMalaysiaMexicoMicronesiaMiddle AfricaMoldovaMoroccoNepalNetherlandsNicaraguaNigeriaNorthern AfricaNorthern EuropeNorwayOceaniaPakistanPanamaPeruPhilippinesPolandPortugalRomaniaRussiaSaudi ArabiaScotlandSenegalSerbiaSierra LeoneSingaporeSouth AfricaSouth AmericaSouth Central AsiaSouth Eastern AsiaSouthern EuropeSpainSri LankaSt. Vincent and the GrenadinesSudanSwedenSwitzerlandSyriaTaiwanThailandTrinidad and TobagoTurkeyUgandaUkraineUruguayUzbekistanVenezuelaVietnamWest IndiesWestern AfricaWestern AsiaWestern EuropeZaireZimbabwe
Income
Income (Families)
Income (Households)
Poverty
Poverty (Families)
Unemployment
Employment Occupations
Employment Industries
Employer Class
Commute Time
Commute Means
School Enrollment
Education by Degree Field
Occupancy
Finances
Physical Characteristics
Los Angeles
States
California Cities
AlhambraAnaheimAntiochApple ValleyArcadiaAuburnBakersfieldBerkeleyBreaBuena ParkBurbankCamarilloCanoga ParkCanyon CountryCarlsbadCarsonChicoChinoChula VistaCitrus HeightsClovisComptonConcordCoronaCosta MesaCovinaDaly CityDavisDesert Hot SpringsDowneyEl CajonEl MonteElk GroveEscondidoEurekaFairfieldFontanaFremontFresnoFullertonGarden GroveGardenaGlendaleGlendoraGrass ValleyHaywardHemetHesperiaHuntington BeachIndioInglewoodIrvineLa MesaLa PuenteLake ElsinoreLakewoodLancasterLivermoreLodiLompocLong BeachLos AngelesLos GatosMaderaMantecaMenifeeMercedMission ViejoModestoMonterey ParkMoreno ValleyMountain ViewMurrietaNapaNewport BeachNorth HollywoodNorthridgeNovatoOaklandOceansideOntarioOrangeOrovilleOxnardPalm DesertPalm SpringsPalmdalePalo AltoPasadenaPerrisPetalumaPleasantonPomonaPortervilleRancho CordovaRancho CucamongaReddingRedlandsRedondo BeachRedwood CityRichmondRiversideRosevilleSacramentoSalinasSan BernardinoSan DiegoSan FranciscoSan GabrielSan JacintoSan JoseSan LeandroSan Luis ObispoSan MarcosSan MateoSan PedroSan RafaelSanta AnaSanta BarbaraSanta ClaraSanta ClaritaSanta CruzSanta MariaSanta MonicaSanta RosaSherman OaksSimi ValleySpring ValleyStocktonSunnyvaleTemeculaThousand OaksTorranceTrabuco CanyonTracyTurlockTustinUplandVacavilleValenciaVallejoVan NuysVenturaVictorvilleVisaliaVistaWalnut CreekWest CovinaWest SacramentoWhittierWoodlandWoodland HillsYuba City
Compare Zip Codes
Comparison Subject

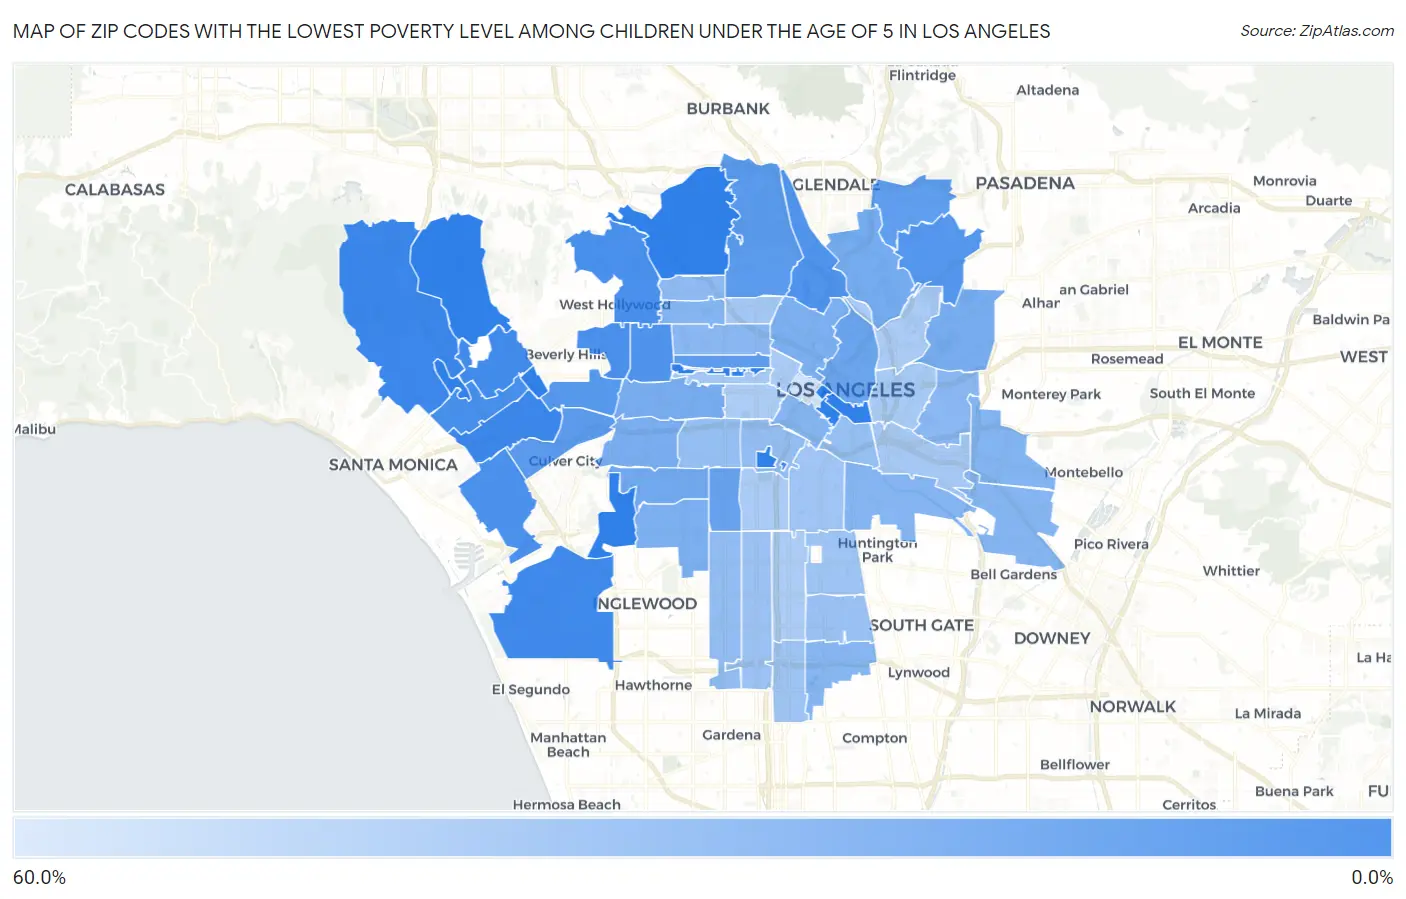
Map of Zip Codes with the Lowest Poverty Level Among Children Under the Age of 5 in Los Angeles

60.0%
0.0%
Zip Codes with the Lowest Poverty Level Among Children Under the Age of 5 in Los Angeles Map

Zip Codes with the Lowest Poverty Level Among Children Under the Age of 5 in Los Angeles, CA

Zip Code Child Poverty vs State vs National
1.900640.85%15.6%(-14.8)#1918.1%(-17.2)#202
2.900491.0%15.6%(-14.6)#3018.1%(-17.0)#291
3.900452.1%15.6%(-13.5)#7718.1%(-16.0)#900
4.900243.1%15.6%(-12.5)#11718.1%(-14.9)#1,606
5.900254.1%15.6%(-11.5)#16918.1%(-13.9)#2,268
6.900485.0%15.6%(-10.6)#22018.1%(-13.1)#2,886
7.900465.2%15.6%(-10.4)#23218.1%(-12.9)#3,036
8.900665.4%15.6%(-10.2)#24618.1%(-12.6)#3,179
9.900366.3%15.6%(-9.29)#28318.1%(-11.7)#3,832
10.900396.6%15.6%(-8.99)#29118.1%(-11.4)#4,011
11.900428.5%15.6%(-7.11)#39018.1%(-9.56)#5,256
12.900359.2%15.6%(-6.39)#42818.1%(-8.84)#5,765
13.9003410.9%15.6%(-4.75)#49718.1%(-7.20)#6,751
14.9002711.1%15.6%(-4.54)#50518.1%(-6.99)#6,876
15.9002011.8%15.6%(-3.81)#52818.1%(-6.26)#7,336
16.9004111.9%15.6%(-3.73)#52918.1%(-6.19)#7,387
17.9006214.3%15.6%(-1.35)#62118.1%(-3.80)#8,770
18.9001216.3%15.6%(+0.666)#68718.1%(-1.79)#9,894
19.9000818.4%15.6%(+2.78)#74218.1%(+0.331)#10,902
20.9006518.9%15.6%(+3.29)#76118.1%(+0.842)#11,128
21.9001919.8%15.6%(+4.17)#78718.1%(+1.72)#11,527
22.9003220.2%15.6%(+4.63)#79818.1%(+2.18)#11,755
23.9001620.7%15.6%(+5.09)#81218.1%(+2.64)#11,954
24.9004321.7%15.6%(+6.06)#83518.1%(+3.61)#12,349
25.9002622.4%15.6%(+6.78)#85518.1%(+4.33)#12,664
26.9002224.0%15.6%(+8.42)#89218.1%(+5.97)#13,336
27.9004024.7%15.6%(+9.08)#90218.1%(+6.62)#13,554
28.9003824.8%15.6%(+9.23)#90418.1%(+6.78)#13,596
29.9005825.0%15.6%(+9.39)#90818.1%(+6.94)#13,636
30.9001525.3%15.6%(+9.65)#91518.1%(+7.20)#13,774
31.9005925.4%15.6%(+9.84)#91618.1%(+7.39)#13,833
32.9000426.3%15.6%(+10.6)#93418.1%(+8.19)#14,109
33.9006326.6%15.6%(+11.0)#94418.1%(+8.55)#14,236
34.9002827.8%15.6%(+12.2)#96918.1%(+9.79)#14,664
35.9000730.0%15.6%(+14.4)#1,00118.1%(+11.9)#15,305
36.9004730.2%15.6%(+14.6)#1,00318.1%(+12.1)#15,373
37.9001831.0%15.6%(+15.4)#1,01418.1%(+13.0)#15,594
38.9002131.0%15.6%(+15.4)#1,01518.1%(+13.0)#15,596
39.9000232.6%15.6%(+17.0)#1,03218.1%(+14.5)#15,969
40.9004433.2%15.6%(+17.6)#1,04018.1%(+15.2)#16,127
41.9006134.4%15.6%(+18.8)#1,05318.1%(+16.3)#16,467
42.9000134.5%15.6%(+18.9)#1,05418.1%(+16.4)#16,476
43.9001135.4%15.6%(+19.8)#1,06218.1%(+17.3)#16,687
44.9002936.5%15.6%(+20.9)#1,07318.1%(+18.5)#16,981
45.9000536.9%15.6%(+21.3)#1,07618.1%(+18.9)#17,061
46.9002337.2%15.6%(+21.6)#1,07918.1%(+19.1)#17,111
47.9003337.8%15.6%(+22.2)#1,08518.1%(+19.7)#17,220
48.9005738.7%15.6%(+23.1)#1,09218.1%(+20.7)#17,413
49.9003738.9%15.6%(+23.3)#1,09318.1%(+20.8)#17,434
50.9003139.4%15.6%(+23.8)#1,09918.1%(+21.4)#17,541
51.9000340.2%15.6%(+24.6)#1,10118.1%(+22.1)#17,687
52.9000640.3%15.6%(+24.7)#1,10318.1%(+22.2)#17,707
53.9001755.7%15.6%(+40.1)#1,16218.1%(+37.6)#19,659

Common Questions

What are the Top 10 Zip Codes with the Lowest Poverty Level Among Children Under the Age of 5 in Los Angeles, CA?
Top 10 Zip Codes with the Lowest Poverty Level Among Children Under the Age of 5 in Los Angeles, CA are:
#1
0.0%
#2
0.0%
#3
0.0%
#4
0.0%
#5
0.0%
#6
0.0%
#7
0.0%
#8
0.0%
#9
0.0%
#10
0.0%
What zip code has the Lowest Poverty Level Among Children Under the Age of 5 in Los Angeles, CA?
90064 has the Lowest Poverty Level Among Children Under the Age of 5 in Los Angeles, CA with 0.85%.
What is the Poverty Level Among Children Under the Age of 5 in Los Angeles, CA?
Poverty Level Among Children Under the Age of 5 in Los Angeles is 20.6%.
What is the Poverty Level Among Children Under the Age of 5 in California?
Poverty Level Among Children Under the Age of 5 in California is 15.6%.
What is the Poverty Level Among Children Under the Age of 5 in the United States?
Poverty Level Among Children Under the Age of 5 in the United States is 18.1%.