Zip Codes with the Highest Percentage of Population with a Degree in Visual and Performing Arts in Los Angeles, CA
RELATED REPORTS & OPTIONS
Visual and Performing Arts
Los Angeles
Compare Zip Codes
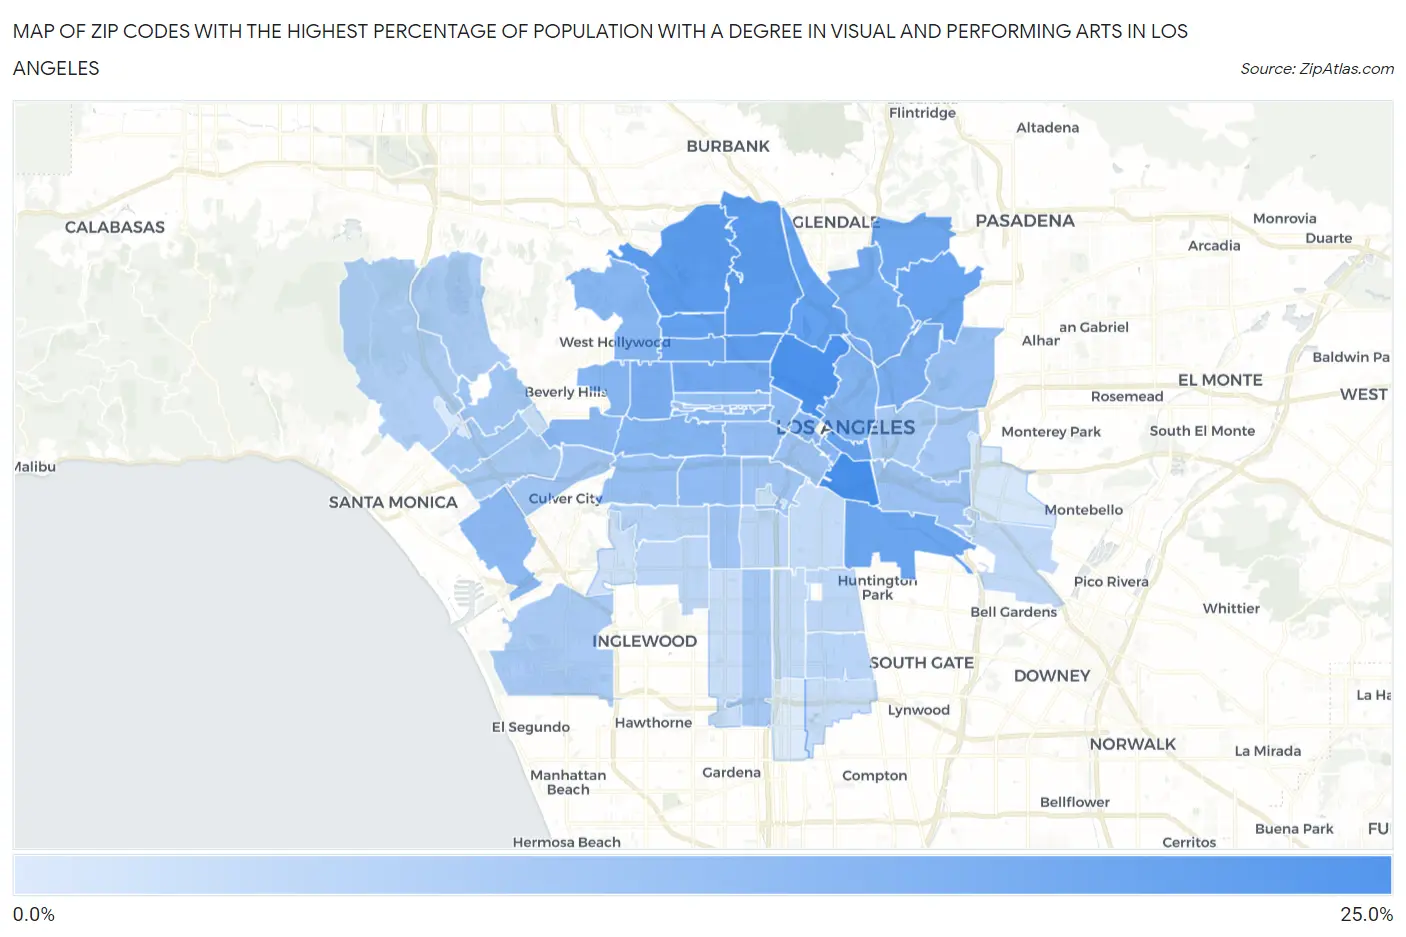
Map of Zip Codes with the Highest Percentage of Population with a Degree in Visual and Performing Arts in Los Angeles
1.3%
24.6%
Zip Codes with the Highest Percentage of Population with a Degree in Visual and Performing Arts in Los Angeles, CA
| Zip Code | % Graduates | vs State | vs National | |
| 1. | 90021 | 24.6% | 5.7%(+18.8)#19 | 4.3%(+20.3)#324 |
| 2. | 90026 | 23.8% | 5.7%(+18.1)#21 | 4.3%(+19.6)#340 |
| 3. | 90068 | 21.3% | 5.7%(+15.6)#35 | 4.3%(+17.1)#420 |
| 4. | 90027 | 21.0% | 5.7%(+15.3)#36 | 4.3%(+16.8)#430 |
| 5. | 90029 | 20.8% | 5.7%(+15.1)#37 | 4.3%(+16.6)#438 |
| 6. | 90039 | 20.1% | 5.7%(+14.3)#42 | 4.3%(+15.8)#471 |
| 7. | 90028 | 19.8% | 5.7%(+14.1)#44 | 4.3%(+15.5)#480 |
| 8. | 90013 | 19.2% | 5.7%(+13.5)#47 | 4.3%(+15.0)#502 |
| 9. | 90042 | 18.6% | 5.7%(+12.9)#49 | 4.3%(+14.4)#538 |
| 10. | 90058 | 18.5% | 5.7%(+12.8)#50 | 4.3%(+14.3)#546 |
| 11. | 90041 | 18.2% | 5.7%(+12.4)#53 | 4.3%(+13.9)#571 |
| 12. | 90038 | 18.1% | 5.7%(+12.4)#54 | 4.3%(+13.9)#573 |
| 13. | 90004 | 17.5% | 5.7%(+11.7)#60 | 4.3%(+13.2)#605 |
| 14. | 90065 | 16.8% | 5.7%(+11.1)#62 | 4.3%(+12.5)#657 |
| 15. | 90036 | 16.3% | 5.7%(+10.5)#64 | 4.3%(+12.0)#686 |
| 16. | 90031 | 16.1% | 5.7%(+10.4)#67 | 4.3%(+11.9)#693 |
| 17. | 90012 | 14.7% | 5.7%(+8.98)#88 | 4.3%(+10.5)#847 |
| 18. | 90019 | 14.6% | 5.7%(+8.83)#90 | 4.3%(+10.3)#873 |
| 19. | 90014 | 14.3% | 5.7%(+8.57)#96 | 4.3%(+10.1)#900 |
| 20. | 90005 | 14.0% | 5.7%(+8.24)#103 | 4.3%(+9.73)#960 |
| 21. | 90048 | 13.9% | 5.7%(+8.19)#104 | 4.3%(+9.67)#966 |
| 22. | 90046 | 13.8% | 5.7%(+8.10)#106 | 4.3%(+9.59)#973 |
| 23. | 90017 | 13.8% | 5.7%(+8.03)#108 | 4.3%(+9.52)#985 |
| 24. | 90035 | 13.1% | 5.7%(+7.35)#114 | 4.3%(+8.84)#1,089 |
| 25. | 90066 | 13.1% | 5.7%(+7.34)#115 | 4.3%(+8.83)#1,091 |
| 26. | 90057 | 12.9% | 5.7%(+7.20)#116 | 4.3%(+8.69)#1,114 |
| 27. | 90018 | 12.6% | 5.7%(+6.87)#122 | 4.3%(+8.35)#1,171 |
| 28. | 90006 | 12.3% | 5.7%(+6.61)#129 | 4.3%(+8.10)#1,226 |
| 29. | 90020 | 11.9% | 5.7%(+6.20)#138 | 4.3%(+7.69)#1,298 |
| 30. | 90032 | 11.6% | 5.7%(+5.83)#146 | 4.3%(+7.32)#1,383 |
| 31. | 90016 | 11.5% | 5.7%(+5.80)#149 | 4.3%(+7.29)#1,387 |
| 32. | 90010 | 11.1% | 5.7%(+5.38)#161 | 4.3%(+6.87)#1,484 |
| 33. | 90023 | 11.1% | 5.7%(+5.35)#162 | 4.3%(+6.83)#1,515 |
| 34. | 90015 | 10.6% | 5.7%(+4.89)#175 | 4.3%(+6.38)#1,646 |
| 35. | 90007 | 10.0% | 5.7%(+4.28)#196 | 4.3%(+5.77)#1,816 |
| 36. | 90034 | 10.0% | 5.7%(+4.26)#199 | 4.3%(+5.75)#1,825 |
| 37. | 90062 | 10.0% | 5.7%(+4.25)#202 | 4.3%(+5.74)#1,846 |
| 38. | 90025 | 9.8% | 5.7%(+4.05)#210 | 4.3%(+5.54)#1,913 |
| 39. | 90024 | 9.7% | 5.7%(+3.92)#215 | 4.3%(+5.41)#1,958 |
| 40. | 90063 | 9.4% | 5.7%(+3.69)#221 | 4.3%(+5.18)#2,050 |
| 41. | 90044 | 9.2% | 5.7%(+3.43)#237 | 4.3%(+4.92)#2,184 |
| 42. | 90033 | 9.0% | 5.7%(+3.30)#245 | 4.3%(+4.79)#2,246 |
| 43. | 90064 | 8.9% | 5.7%(+3.17)#251 | 4.3%(+4.66)#2,303 |
| 44. | 90045 | 8.6% | 5.7%(+2.90)#277 | 4.3%(+4.39)#2,453 |
| 45. | 90077 | 8.2% | 5.7%(+2.42)#311 | 4.3%(+3.91)#2,745 |
| 46. | 90049 | 7.5% | 5.7%(+1.78)#362 | 4.3%(+3.27)#3,198 |
| 47. | 90008 | 7.0% | 5.7%(+1.22)#413 | 4.3%(+2.70)#3,706 |
| 48. | 90002 | 6.1% | 5.7%(+0.365)#506 | 4.3%(+1.85)#4,726 |
| 49. | 90037 | 6.0% | 5.7%(+0.284)#510 | 4.3%(+1.77)#4,834 |
| 50. | 90043 | 6.0% | 5.7%(+0.216)#516 | 4.3%(+1.70)#4,935 |
| 51. | 90001 | 5.8% | 5.7%(+0.081)#533 | 4.3%(+1.57)#5,145 |
| 52. | 90040 | 5.6% | 5.7%(-0.102)#557 | 4.3%(+1.38)#5,431 |
| 53. | 90011 | 5.0% | 5.7%(-0.786)#668 | 4.3%(+0.701)#6,754 |
| 54. | 90003 | 4.9% | 5.7%(-0.837)#673 | 4.3%(+0.650)#6,857 |
| 55. | 90059 | 4.3% | 5.7%(-1.42)#793 | 4.3%(+0.068)#8,298 |
| 56. | 90067 | 4.2% | 5.7%(-1.53)#821 | 4.3%(-0.044)#8,603 |
| 57. | 90089 | 4.1% | 5.7%(-1.61)#840 | 4.3%(-0.120)#8,829 |
| 58. | 90047 | 4.1% | 5.7%(-1.64)#851 | 4.3%(-0.150)#8,935 |
| 59. | 90056 | 3.7% | 5.7%(-2.08)#959 | 4.3%(-0.598)#10,321 |
| 60. | 90022 | 2.1% | 5.7%(-3.62)#1,264 | 4.3%(-2.14)#16,014 |
| 61. | 90073 | 1.5% | 5.7%(-4.20)#1,331 | 4.3%(-2.71)#18,044 |
| 62. | 90061 | 1.3% | 5.7%(-4.49)#1,352 | 4.3%(-3.00)#18,914 |
1
Common Questions
What are the Top 10 Zip Codes with the Highest Percentage of Population with a Degree in Visual and Performing Arts in Los Angeles, CA?
Top 10 Zip Codes with the Highest Percentage of Population with a Degree in Visual and Performing Arts in Los Angeles, CA are:
What zip code has the Highest Percentage of Population with a Degree in Visual and Performing Arts in Los Angeles, CA?
90021 has the Highest Percentage of Population with a Degree in Visual and Performing Arts in Los Angeles, CA with 24.6%.
What is the Percentage of Population with a Degree in Visual and Performing Arts in Los Angeles, CA?
Percentage of Population with a Degree in Visual and Performing Arts in Los Angeles is 12.5%.
What is the Percentage of Population with a Degree in Visual and Performing Arts in California?
Percentage of Population with a Degree in Visual and Performing Arts in California is 5.7%.
What is the Percentage of Population with a Degree in Visual and Performing Arts in the United States?
Percentage of Population with a Degree in Visual and Performing Arts in the United States is 4.3%.