Zip Codes with the Highest Percentage of Households with Income Below $10,000 in Sun City, AZ
RELATED REPORTS & OPTIONS
Household Income | $0-10k
Sun City
Compare Zip Codes
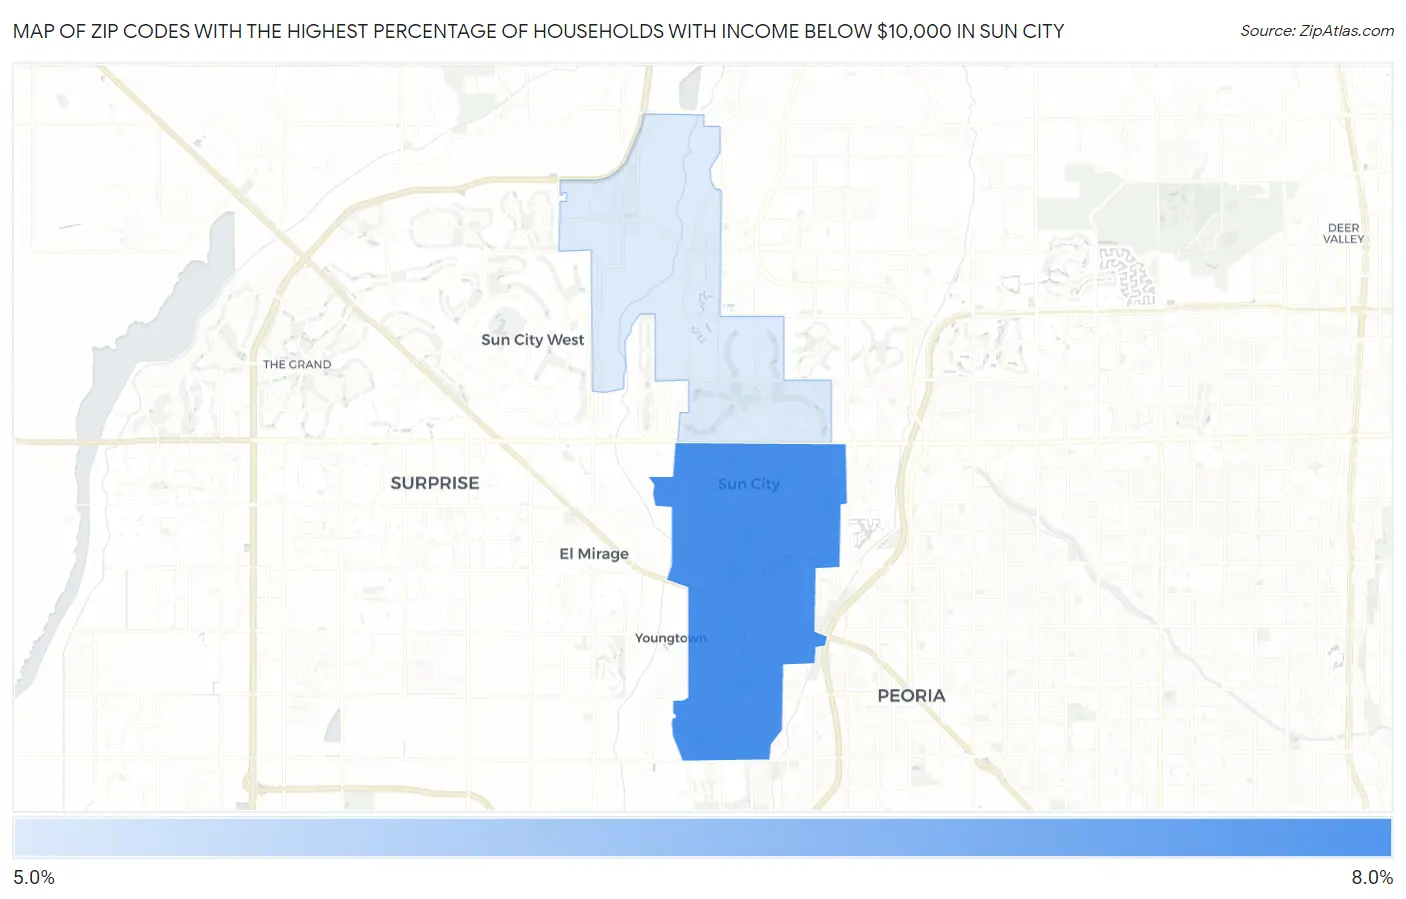
Map of Zip Codes with the Highest Percentage of Households with Income Below $10,000 in Sun City
5.1%
6.4%
Zip Codes with the Highest Percentage of Households with Income Below $10,000 in Sun City, AZ
| Zip Code | Households with Income < $10k | vs State | vs National | |
| 1. | 85351 | 6.4% | 4.9%(+1.50)#141 | 4.9%(+1.50)#8,117 |
| 2. | 85373 | 5.1% | 4.9%(+0.200)#188 | 4.9%(+0.200)#11,399 |
1
Common Questions
What are the Top Zip Codes with the Highest Percentage of Households with Income Below $10,000 in Sun City, AZ?
Top Zip Codes with the Highest Percentage of Households with Income Below $10,000 in Sun City, AZ are:
What zip code has the Highest Percentage of Households with Income Below $10,000 in Sun City, AZ?
85351 has the Highest Percentage of Households with Income Below $10,000 in Sun City, AZ with 6.4%.
What is the Percentage of Households with Income Below $10,000 in Sun City, AZ?
Percentage of Households with Income Below $10,000 in Sun City is 6.5%.
What is the Percentage of Households with Income Below $10,000 in Arizona?
Percentage of Households with Income Below $10,000 in Arizona is 4.9%.
What is the Percentage of Households with Income Below $10,000 in the United States?
Percentage of Households with Income Below $10,000 in the United States is 4.9%.