Zip Codes with the Highest Percentage of Households with Income Above $200,000 in Phoenix, AZ
RELATED REPORTS & OPTIONS
Household Income | $200k+
Phoenix
Compare Zip Codes
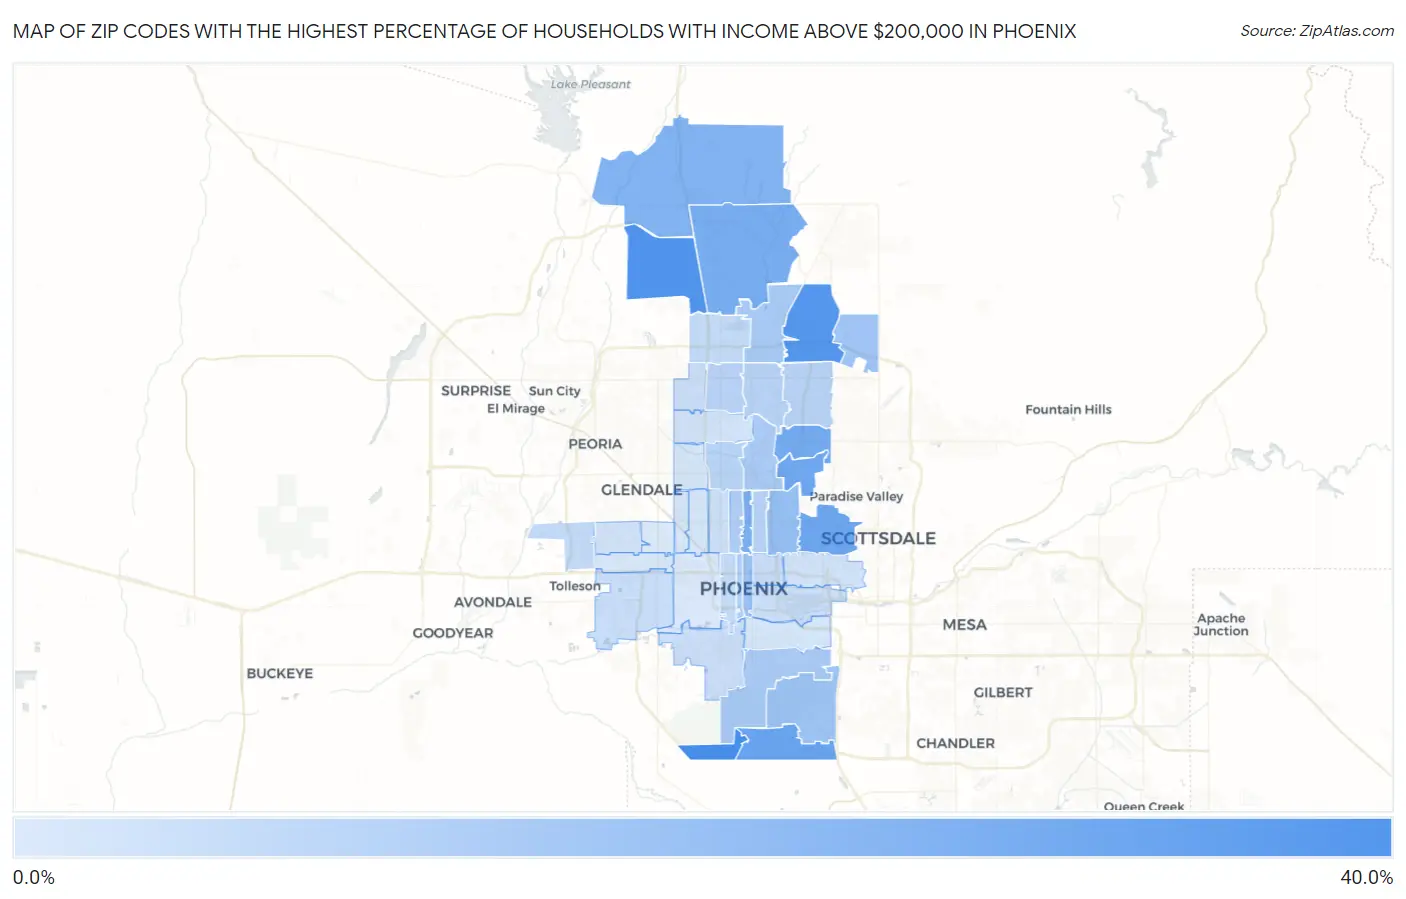
Map of Zip Codes with the Highest Percentage of Households with Income Above $200,000 in Phoenix
1.3%
31.3%
Zip Codes with the Highest Percentage of Households with Income Above $200,000 in Phoenix, AZ
| Zip Code | Households with Income > $200k | vs State | vs National | |
| 1. | 85045 | 31.3% | 9.2%(+22.1)#7 | 11.4%(+19.9)#1,318 |
| 2. | 85083 | 29.2% | 9.2%(+20.0)#10 | 11.4%(+17.8)#1,555 |
| 3. | 85050 | 28.3% | 9.2%(+19.1)#11 | 11.4%(+16.9)#1,679 |
| 4. | 85048 | 23.5% | 9.2%(+14.3)#20 | 11.4%(+12.1)#2,461 |
| 5. | 85018 | 22.5% | 9.2%(+13.3)#21 | 11.4%(+11.1)#2,678 |
| 6. | 85028 | 21.4% | 9.2%(+12.2)#27 | 11.4%(+10.00)#2,905 |
| 7. | 85085 | 20.9% | 9.2%(+11.7)#28 | 11.4%(+9.50)#3,053 |
| 8. | 85012 | 20.0% | 9.2%(+10.8)#31 | 11.4%(+8.60)#3,287 |
| 9. | 85086 | 18.8% | 9.2%(+9.60)#34 | 11.4%(+7.40)#3,609 |
| 10. | 85016 | 14.6% | 9.2%(+5.40)#48 | 11.4%(+3.20)#5,174 |
| 11. | 85004 | 13.3% | 9.2%(+4.10)#56 | 11.4%(+1.90)#5,853 |
| 12. | 85044 | 12.8% | 9.2%(+3.60)#60 | 11.4%(+1.40)#6,120 |
| 13. | 85054 | 12.3% | 9.2%(+3.10)#63 | 11.4%(+0.900)#6,484 |
| 14. | 85024 | 10.9% | 9.2%(+1.70)#71 | 11.4%(-0.500)#7,485 |
| 15. | 85042 | 10.6% | 9.2%(+1.40)#75 | 11.4%(-0.800)#7,694 |
| 16. | 85020 | 10.4% | 9.2%(+1.20)#78 | 11.4%(-1.000)#7,867 |
| 17. | 85013 | 9.9% | 9.2%(+0.700)#87 | 11.4%(-1.50)#8,357 |
| 18. | 85003 | 9.3% | 9.2%(+0.100)#92 | 11.4%(-2.10)#8,953 |
| 19. | 85032 | 8.1% | 9.2%(-1.10)#110 | 11.4%(-3.30)#10,209 |
| 20. | 85022 | 8.1% | 9.2%(-1.10)#111 | 11.4%(-3.30)#10,216 |
| 21. | 85023 | 8.0% | 9.2%(-1.20)#112 | 11.4%(-3.40)#10,362 |
| 22. | 85014 | 7.8% | 9.2%(-1.40)#113 | 11.4%(-3.60)#10,621 |
| 23. | 85021 | 7.7% | 9.2%(-1.50)#115 | 11.4%(-3.70)#10,746 |
| 24. | 85027 | 5.9% | 9.2%(-3.30)#148 | 11.4%(-5.50)#13,628 |
| 25. | 85037 | 5.8% | 9.2%(-3.40)#150 | 11.4%(-5.60)#13,822 |
| 26. | 85007 | 5.7% | 9.2%(-3.50)#151 | 11.4%(-5.70)#14,105 |
| 27. | 85043 | 5.0% | 9.2%(-4.20)#164 | 11.4%(-6.40)#15,566 |
| 28. | 85006 | 4.9% | 9.2%(-4.30)#167 | 11.4%(-6.50)#15,840 |
| 29. | 85041 | 4.7% | 9.2%(-4.50)#170 | 11.4%(-6.70)#16,251 |
| 30. | 85053 | 4.6% | 9.2%(-4.60)#173 | 11.4%(-6.80)#16,526 |
| 31. | 85034 | 4.6% | 9.2%(-4.60)#174 | 11.4%(-6.80)#16,617 |
| 32. | 85015 | 4.1% | 9.2%(-5.10)#194 | 11.4%(-7.30)#17,804 |
| 33. | 85008 | 3.5% | 9.2%(-5.70)#218 | 11.4%(-7.90)#19,416 |
| 34. | 85033 | 3.4% | 9.2%(-5.80)#222 | 11.4%(-8.00)#19,675 |
| 35. | 85029 | 3.3% | 9.2%(-5.90)#228 | 11.4%(-8.10)#19,997 |
| 36. | 85051 | 2.6% | 9.2%(-6.60)#255 | 11.4%(-8.80)#21,997 |
| 37. | 85019 | 2.6% | 9.2%(-6.60)#259 | 11.4%(-8.80)#22,017 |
| 38. | 85017 | 2.5% | 9.2%(-6.70)#265 | 11.4%(-8.90)#22,315 |
| 39. | 85040 | 2.4% | 9.2%(-6.80)#270 | 11.4%(-9.00)#22,620 |
| 40. | 85035 | 2.0% | 9.2%(-7.20)#283 | 11.4%(-9.40)#23,733 |
| 41. | 85009 | 1.7% | 9.2%(-7.50)#293 | 11.4%(-9.70)#24,534 |
| 42. | 85031 | 1.3% | 9.2%(-7.90)#310 | 11.4%(-10.1)#25,521 |
1
Common Questions
What are the Top 10 Zip Codes with the Highest Percentage of Households with Income Above $200,000 in Phoenix, AZ?
Top 10 Zip Codes with the Highest Percentage of Households with Income Above $200,000 in Phoenix, AZ are:
What zip code has the Highest Percentage of Households with Income Above $200,000 in Phoenix, AZ?
85045 has the Highest Percentage of Households with Income Above $200,000 in Phoenix, AZ with 31.3%.
What is the Percentage of Households with Income Above $200,000 in Phoenix, AZ?
Percentage of Households with Income Above $200,000 in Phoenix is 9.8%.
What is the Percentage of Households with Income Above $200,000 in Arizona?
Percentage of Households with Income Above $200,000 in Arizona is 9.2%.
What is the Percentage of Households with Income Above $200,000 in the United States?
Percentage of Households with Income Above $200,000 in the United States is 11.4%.