Zip Codes with the Highest Percentage of Population with a Degree in Liberal Arts and History in Phoenix, AZ

RELATED REPORTS & OPTIONS

Liberal Arts and History
Population
Families and Households
Female Fertility
Female Fertility (Unmarried)
Race (Community Size)
Race (Percentage)
Ancestry (Community Size)
AfghanAfricanAlaska NativeAlaskan AthabascanAlbanianAmericanApacheArabArgentineanArmenianAssyrian / Chaldean / SyriacAustralianAustrianBahamianBangladeshiBarbadianBasqueBelgianBelizeanBhutaneseBlackfeetBolivianBrazilianBritishBritish West IndianBulgarianBurmeseCajunCanadianCape VerdeanCarpatho RusynCelticCentral AmericanCentral American IndianCherokeeCheyenneChickasawChileanChippewaChoctawColombianColvilleComancheCosta RicanCreeCreekCroatianCubanCypriotCzechCzechoslovakianDanishDelawareDominicanDutchEastern EuropeanEcuadorianEgyptianEnglishEstonianEthiopianEuropeanFijianFilipinoFinnishFrenchFrench American IndianFrench CanadianGermanGerman RussianGhanaianGreekGuamanian / ChamorroGuatemalanGuyaneseHaitianHonduranHopiHungarianIcelanderIndian (Asian)IndonesianInupiatIranianIraqiIrishIroquoisIsraeliItalianJamaicanJapaneseJordanianKenyanKiowaKoreanLaotianLatvianLebaneseLiberianLithuanianLuxembourgerMacedonianMalaysianMalteseMexicanMexican American IndianMongolianMoroccanNative HawaiianNavajoNew ZealanderNicaraguanNigerianNorthern EuropeanNorwegianOsagePaiutePakistaniPalestinianPanamanianParaguayanPennsylvania GermanPeruvianPimaPolishPortuguesePotawatomiPuebloPuerto RicanPuget Sound SalishRomanianRussianSalvadoranSamoanScandinavianScotch-IrishScottishSeminoleSenegaleseSerbianShoshoneSierra LeoneanSiouxSlavicSlovakSloveneSomaliSouth AfricanSouth AmericanSouth American IndianSoviet UnionSpaniardSpanishSpanish AmericanSpanish American IndianSri LankanSubsaharan AfricanSudaneseSwedishSwissSyrianThaiTlingit-HaidaTohono O'OdhamTonganTrinidadian and TobagonianTurkishUgandanUkrainianUruguayanUteVenezuelanVietnameseWelshWest IndianYakamaYaquiYugoslavianYumanZimbabwean
Ancestry (Percentage)
AfghanAfricanAlaska NativeAlaskan AthabascanAlbanianAmericanApacheArabArgentineanArmenianAssyrian / Chaldean / SyriacAustralianAustrianBahamianBangladeshiBarbadianBasqueBelgianBelizeanBhutaneseBlackfeetBolivianBrazilianBritishBritish West IndianBulgarianBurmeseCajunCanadianCape VerdeanCarpatho RusynCelticCentral AmericanCentral American IndianCherokeeCheyenneChickasawChileanChippewaChoctawColombianColvilleComancheCosta RicanCreeCreekCroatianCubanCypriotCzechCzechoslovakianDanishDelawareDominicanDutchEastern EuropeanEcuadorianEgyptianEnglishEstonianEthiopianEuropeanFijianFilipinoFinnishFrenchFrench American IndianFrench CanadianGermanGerman RussianGhanaianGreekGuamanian / ChamorroGuatemalanGuyaneseHaitianHonduranHopiHungarianIcelanderIndian (Asian)IndonesianInupiatIranianIraqiIrishIroquoisIsraeliItalianJamaicanJapaneseJordanianKenyanKiowaKoreanLaotianLatvianLebaneseLiberianLithuanianLuxembourgerMacedonianMalaysianMalteseMexicanMexican American IndianMongolianMoroccanNative HawaiianNavajoNew ZealanderNicaraguanNigerianNorthern EuropeanNorwegianOsagePaiutePakistaniPalestinianPanamanianParaguayanPennsylvania GermanPeruvianPimaPolishPortuguesePotawatomiPuebloPuerto RicanPuget Sound SalishRomanianRussianSalvadoranSamoanScandinavianScotch-IrishScottishSeminoleSenegaleseSerbianShoshoneSierra LeoneanSiouxSlavicSlovakSloveneSomaliSouth AfricanSouth AmericanSouth American IndianSoviet UnionSpaniardSpanishSpanish AmericanSpanish American IndianSri LankanSubsaharan AfricanSudaneseSwedishSwissSyrianThaiTlingit-HaidaTohono O'OdhamTonganTrinidadian and TobagonianTurkishUgandanUkrainianUruguayanUteVenezuelanVietnameseWelshWest IndianYakamaYaquiYugoslavianYumanZimbabwean
Immigrant Origin (Total)
AfghanistanAfricaAlbaniaArgentinaArmeniaAsiaAustraliaAustriaBahamasBangladeshBarbadosBelarusBelgiumBelizeBoliviaBosnia and HerzegovinaBrazilBulgariaBurma / MyanmarCambodiaCameroonCanadaCaribbeanCentral AmericaChileChinaColombiaCongoCosta RicaCroatiaCubaCzechoslovakiaDenmarkDominicaDominican RepublicEastern AfricaEastern AsiaEastern EuropeEcuadorEgyptEl SalvadorEnglandEritreaEthiopiaEuropeFranceGermanyGhanaGreeceGuatemalaGuyanaHaitiHondurasHong KongHungaryIndiaIndonesiaIranIraqIrelandIsraelItalyJamaicaJapanJordanKazakhstanKenyaKoreaKuwaitLaosLatin AmericaLebanonLiberiaLithuaniaMalaysiaMexicoMicronesiaMiddle AfricaMoldovaMoroccoNepalNetherlandsNicaraguaNigeriaNorthern AfricaNorthern EuropeNorwayOceaniaPakistanPanamaPeruPhilippinesPolandPortugalRomaniaRussiaSaudi ArabiaScotlandSerbiaSierra LeoneSingaporeSomaliaSouth AfricaSouth AmericaSouth Central AsiaSouth Eastern AsiaSouthern EuropeSpainSri LankaSudanSwedenSwitzerlandSyriaTaiwanThailandTrinidad and TobagoTurkeyUgandaUkraineUruguayUzbekistanVenezuelaVietnamWestern AfricaWestern AsiaWestern EuropeZaireZimbabwe
Immigrant Origin (Percentage)
AfghanistanAfricaAlbaniaArgentinaArmeniaAsiaAustraliaAustriaBahamasBangladeshBarbadosBelarusBelgiumBelizeBoliviaBosnia and HerzegovinaBrazilBulgariaBurma / MyanmarCambodiaCameroonCanadaCaribbeanCentral AmericaChileChinaColombiaCongoCosta RicaCroatiaCubaCzechoslovakiaDenmarkDominicaDominican RepublicEastern AfricaEastern AsiaEastern EuropeEcuadorEgyptEl SalvadorEnglandEritreaEthiopiaEuropeFranceGermanyGhanaGreeceGuatemalaGuyanaHaitiHondurasHong KongHungaryIndiaIndonesiaIranIraqIrelandIsraelItalyJamaicaJapanJordanKazakhstanKenyaKoreaKuwaitLaosLatin AmericaLebanonLiberiaLithuaniaMalaysiaMexicoMicronesiaMiddle AfricaMoldovaMoroccoNepalNetherlandsNicaraguaNigeriaNorthern AfricaNorthern EuropeNorwayOceaniaPakistanPanamaPeruPhilippinesPolandPortugalRomaniaRussiaSaudi ArabiaScotlandSerbiaSierra LeoneSingaporeSomaliaSouth AfricaSouth AmericaSouth Central AsiaSouth Eastern AsiaSouthern EuropeSpainSri LankaSudanSwedenSwitzerlandSyriaTaiwanThailandTrinidad and TobagoTurkeyUgandaUkraineUruguayUzbekistanVenezuelaVietnamWestern AfricaWestern AsiaWestern EuropeZaireZimbabwe
Income
Income (Families)
Income (Households)
Poverty
Poverty (Families)
Unemployment
Employment Occupations
Employment Industries
Employer Class
Commute Time
Commute Means
School Enrollment
Education by Degree Field
Occupancy
Finances
Physical Characteristics
Phoenix
Compare Zip Codes
Comparison Subject

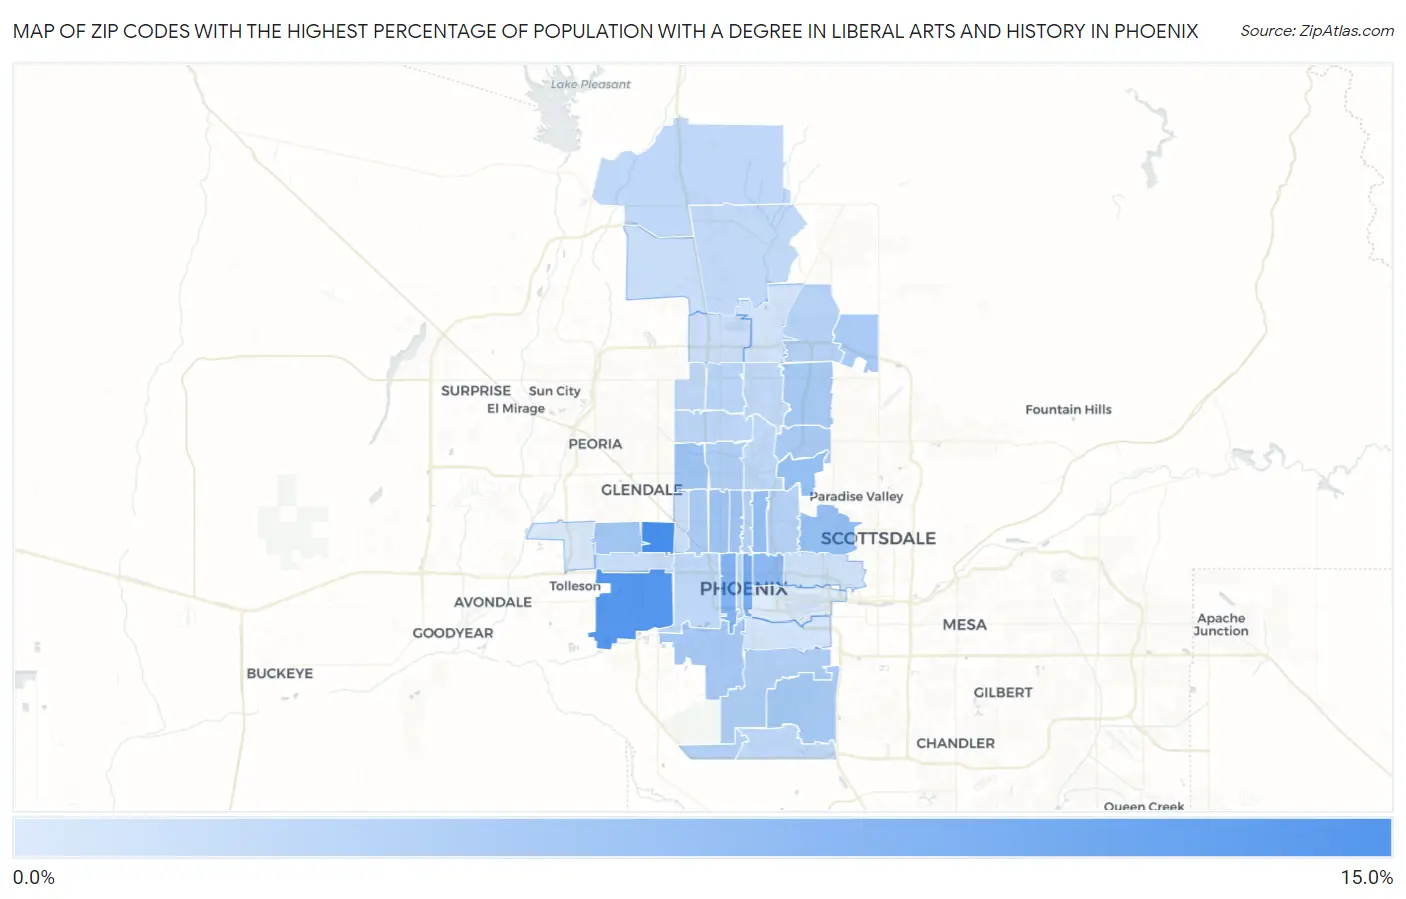
Map of Zip Codes with the Highest Percentage of Population with a Degree in Liberal Arts and History in Phoenix

0.0%
15.0%
Zip Codes with the Highest Percentage of Population with a Degree in Liberal Arts and History in Phoenix Map

Zip Codes with the Highest Percentage of Population with a Degree in Liberal Arts and History in Phoenix, AZ

Zip Code % Graduates vs State vs National
1.8503111.9%4.3%(+7.62)#294.9%(+7.00)#2,245
2.8504310.9%4.3%(+6.66)#344.9%(+6.04)#2,603
3.850048.4%4.3%(+4.17)#474.9%(+3.55)#4,423
4.850077.6%4.3%(+3.38)#564.9%(+2.77)#5,386
5.850066.7%4.3%(+2.46)#674.9%(+1.85)#6,904
6.850146.3%4.3%(+2.05)#784.9%(+1.43)#7,776
7.850186.3%4.3%(+2.01)#794.9%(+1.39)#7,876
8.850155.6%4.3%(+1.33)#924.9%(+0.715)#9,603
9.850515.6%4.3%(+1.31)#964.9%(+0.689)#9,668
10.850135.5%4.3%(+1.29)#984.9%(+0.676)#9,724
11.850335.3%4.3%(+1.02)#1124.9%(+0.406)#10,506
12.850415.2%4.3%(+0.927)#1174.9%(+0.308)#10,781
13.850325.0%4.3%(+0.738)#1244.9%(+0.119)#11,381
14.850445.0%4.3%(+0.733)#1254.9%(+0.114)#11,396
15.850544.8%4.3%(+0.591)#1354.9%(-0.028)#11,838
16.850174.8%4.3%(+0.534)#1374.9%(-0.085)#12,011
17.850284.7%4.3%(+0.486)#1394.9%(-0.133)#12,197
18.850214.4%4.3%(+0.158)#1534.9%(-0.461)#13,258
19.850424.3%4.3%(+0.053)#1604.9%(-0.566)#13,617
20.850124.2%4.3%(-0.063)#1714.9%(-0.682)#14,052
21.850454.2%4.3%(-0.094)#1734.9%(-0.713)#14,178
22.850504.0%4.3%(-0.221)#1784.9%(-0.840)#14,655
23.850164.0%4.3%(-0.245)#1814.9%(-0.864)#14,746
24.850033.8%4.3%(-0.449)#1944.9%(-1.07)#15,507
25.850233.7%4.3%(-0.507)#1984.9%(-1.13)#15,721
26.850293.5%4.3%(-0.740)#2054.9%(-1.36)#16,541
27.850203.4%4.3%(-0.814)#2134.9%(-1.43)#16,848
28.850093.4%4.3%(-0.819)#2144.9%(-1.44)#16,860
29.850533.4%4.3%(-0.839)#2154.9%(-1.46)#16,929
30.850483.3%4.3%(-0.945)#2224.9%(-1.56)#17,292
31.850863.3%4.3%(-0.961)#2244.9%(-1.58)#17,340
32.850223.2%4.3%(-1.04)#2294.9%(-1.66)#17,594
33.850853.2%4.3%(-1.05)#2314.9%(-1.67)#17,651
34.850832.8%4.3%(-1.44)#2474.9%(-2.06)#18,987
35.850352.7%4.3%(-1.54)#2514.9%(-2.16)#19,260
36.850272.6%4.3%(-1.61)#2534.9%(-2.23)#19,516
37.850192.6%4.3%(-1.67)#2554.9%(-2.29)#19,700
38.850082.3%4.3%(-1.99)#2644.9%(-2.61)#20,642
39.850242.1%4.3%(-2.11)#2694.9%(-2.73)#20,973
40.850402.0%4.3%(-2.27)#2704.9%(-2.88)#21,405
41.850371.6%4.3%(-2.62)#2834.9%(-3.24)#22,230
42.850341.3%4.3%(-2.92)#2894.9%(-3.53)#22,796

Common Questions

What are the Top 10 Zip Codes with the Highest Percentage of Population with a Degree in Liberal Arts and History in Phoenix, AZ?
Top 10 Zip Codes with the Highest Percentage of Population with a Degree in Liberal Arts and History in Phoenix, AZ are:
#1
11.9%
#2
10.9%
#3
8.4%
#4
7.6%
#5
6.7%
#6
6.3%
#7
6.3%
#8
5.6%
#9
5.6%
#10
5.5%
What zip code has the Highest Percentage of Population with a Degree in Liberal Arts and History in Phoenix, AZ?
85031 has the Highest Percentage of Population with a Degree in Liberal Arts and History in Phoenix, AZ with 11.9%.
What is the Percentage of Population with a Degree in Liberal Arts and History in Phoenix, AZ?
Percentage of Population with a Degree in Liberal Arts and History in Phoenix is 4.3%.
What is the Percentage of Population with a Degree in Liberal Arts and History in Arizona?
Percentage of Population with a Degree in Liberal Arts and History in Arizona is 4.3%.
What is the Percentage of Population with a Degree in Liberal Arts and History in the United States?
Percentage of Population with a Degree in Liberal Arts and History in the United States is 4.9%.