Zip Codes with the Highest Percentage of Population Employed in Arts, Media & Entertainment in Phoenix, AZ
RELATED REPORTS & OPTIONS
Arts, Media & Entertainment
Phoenix
Compare Zip Codes
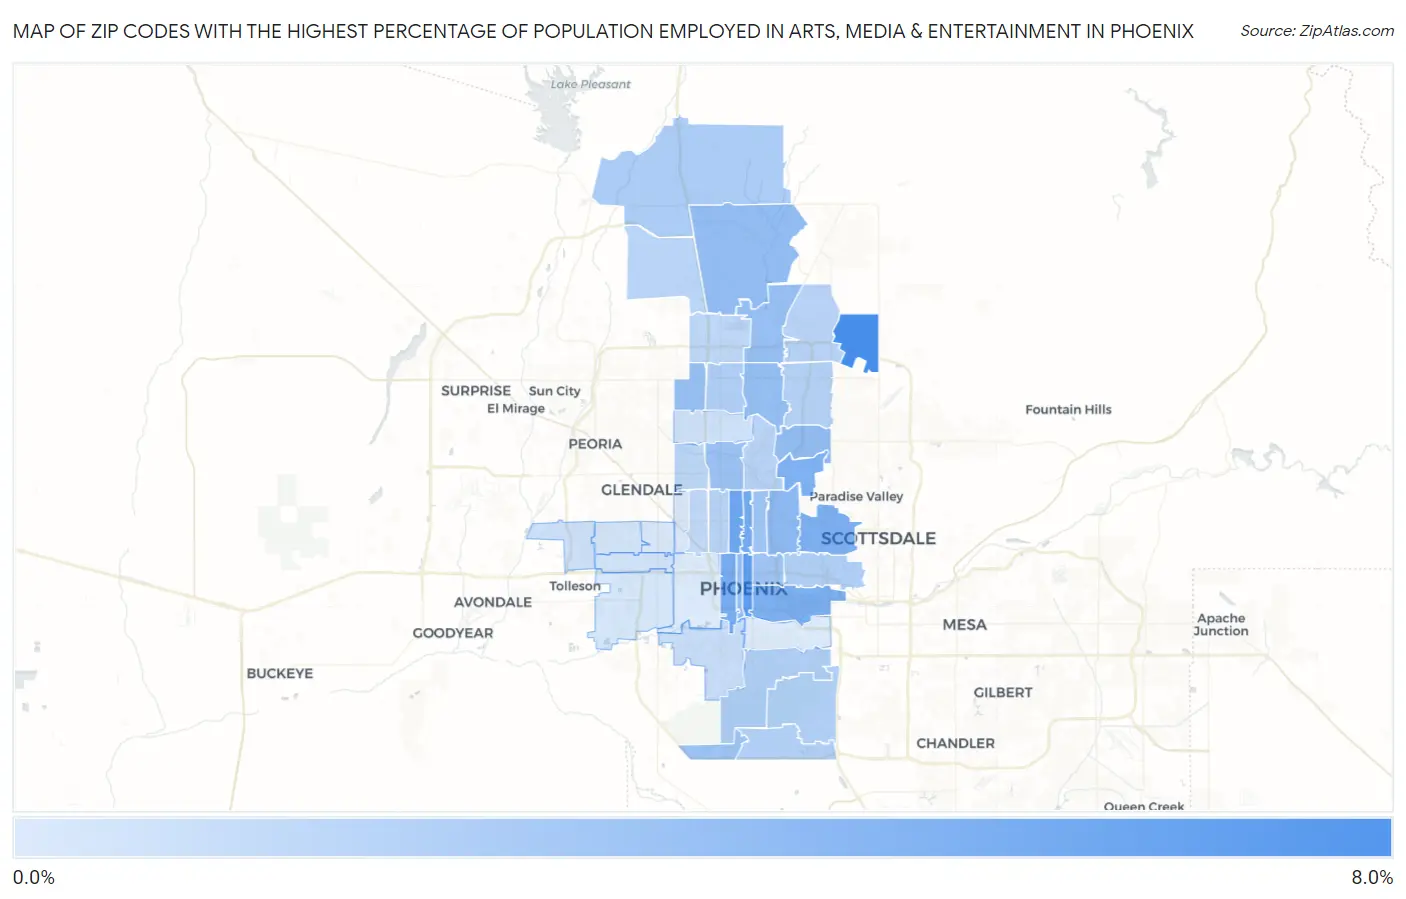
Map of Zip Codes with the Highest Percentage of Population Employed in Arts, Media & Entertainment in Phoenix
0.49%
6.2%
Zip Codes with the Highest Percentage of Population Employed in Arts, Media & Entertainment in Phoenix, AZ
| Zip Code | % Employed | vs State | vs National | |
| 1. | 85054 | 6.2% | 1.8%(+4.36)#12 | 2.1%(+4.12)#982 |
| 2. | 85004 | 5.3% | 1.8%(+3.45)#17 | 2.1%(+3.21)#1,359 |
| 3. | 85013 | 4.7% | 1.8%(+2.83)#20 | 2.1%(+2.60)#1,720 |
| 4. | 85012 | 4.4% | 1.8%(+2.60)#24 | 2.1%(+2.37)#1,917 |
| 5. | 85007 | 4.3% | 1.8%(+2.48)#26 | 2.1%(+2.24)#2,034 |
| 6. | 85018 | 4.0% | 1.8%(+2.21)#27 | 2.1%(+1.98)#2,326 |
| 7. | 85034 | 4.0% | 1.8%(+2.18)#28 | 2.1%(+1.95)#2,356 |
| 8. | 85016 | 3.4% | 1.8%(+1.59)#43 | 2.1%(+1.35)#3,206 |
| 9. | 85028 | 3.3% | 1.8%(+1.45)#48 | 2.1%(+1.22)#3,468 |
| 10. | 85085 | 3.2% | 1.8%(+1.39)#51 | 2.1%(+1.16)#3,571 |
| 11. | 85022 | 3.2% | 1.8%(+1.35)#52 | 2.1%(+1.12)#3,657 |
| 12. | 85003 | 3.1% | 1.8%(+1.32)#54 | 2.1%(+1.09)#3,744 |
| 13. | 85053 | 3.1% | 1.8%(+1.29)#55 | 2.1%(+1.06)#3,800 |
| 14. | 85024 | 3.1% | 1.8%(+1.24)#57 | 2.1%(+1.01)#3,914 |
| 15. | 85021 | 2.9% | 1.8%(+1.10)#60 | 2.1%(+0.871)#4,258 |
| 16. | 85045 | 2.8% | 1.8%(+0.954)#69 | 2.1%(+0.722)#4,664 |
| 17. | 85006 | 2.7% | 1.8%(+0.914)#70 | 2.1%(+0.682)#4,782 |
| 18. | 85014 | 2.7% | 1.8%(+0.877)#72 | 2.1%(+0.645)#4,885 |
| 19. | 85086 | 2.3% | 1.8%(+0.484)#95 | 2.1%(+0.251)#6,332 |
| 20. | 85023 | 2.2% | 1.8%(+0.356)#102 | 2.1%(+0.123)#6,902 |
| 21. | 85008 | 2.1% | 1.8%(+0.300)#106 | 2.1%(+0.067)#7,130 |
| 22. | 85042 | 2.1% | 1.8%(+0.279)#108 | 2.1%(+0.046)#7,239 |
| 23. | 85048 | 2.1% | 1.8%(+0.247)#111 | 2.1%(+0.015)#7,406 |
| 24. | 85044 | 2.0% | 1.8%(+0.205)#114 | 2.1%(-0.028)#7,637 |
| 25. | 85032 | 2.0% | 1.8%(+0.163)#119 | 2.1%(-0.070)#7,857 |
| 26. | 85050 | 1.9% | 1.8%(+0.072)#128 | 2.1%(-0.160)#8,369 |
| 27. | 85015 | 1.9% | 1.8%(+0.029)#133 | 2.1%(-0.204)#8,631 |
| 28. | 85020 | 1.8% | 1.8%(+0.010)#138 | 2.1%(-0.223)#8,749 |
| 29. | 85083 | 1.7% | 1.8%(-0.081)#142 | 2.1%(-0.314)#9,288 |
| 30. | 85051 | 1.7% | 1.8%(-0.157)#149 | 2.1%(-0.390)#9,842 |
| 31. | 85027 | 1.6% | 1.8%(-0.203)#152 | 2.1%(-0.435)#10,159 |
| 32. | 85017 | 1.5% | 1.8%(-0.352)#170 | 2.1%(-0.585)#11,145 |
| 33. | 85041 | 1.2% | 1.8%(-0.588)#192 | 2.1%(-0.821)#12,939 |
| 34. | 85037 | 1.0% | 1.8%(-0.783)#210 | 2.1%(-1.02)#14,453 |
| 35. | 85029 | 0.98% | 1.8%(-0.849)#219 | 2.1%(-1.08)#14,986 |
| 36. | 85035 | 0.95% | 1.8%(-0.882)#223 | 2.1%(-1.11)#15,266 |
| 37. | 85033 | 0.84% | 1.8%(-0.988)#237 | 2.1%(-1.22)#16,103 |
| 38. | 85043 | 0.72% | 1.8%(-1.11)#245 | 2.1%(-1.34)#17,073 |
| 39. | 85031 | 0.60% | 1.8%(-1.23)#254 | 2.1%(-1.46)#18,047 |
| 40. | 85019 | 0.56% | 1.8%(-1.26)#260 | 2.1%(-1.50)#18,343 |
| 41. | 85009 | 0.53% | 1.8%(-1.30)#264 | 2.1%(-1.53)#18,630 |
| 42. | 85040 | 0.49% | 1.8%(-1.34)#270 | 2.1%(-1.57)#18,947 |
1
Common Questions
What are the Top 10 Zip Codes with the Highest Percentage of Population Employed in Arts, Media & Entertainment in Phoenix, AZ?
Top 10 Zip Codes with the Highest Percentage of Population Employed in Arts, Media & Entertainment in Phoenix, AZ are:
What zip code has the Highest Percentage of Population Employed in Arts, Media & Entertainment in Phoenix, AZ?
85054 has the Highest Percentage of Population Employed in Arts, Media & Entertainment in Phoenix, AZ with 6.2%.
What is the Percentage of Population Employed in Arts, Media & Entertainment in Phoenix, AZ?
Percentage of Population Employed in Arts, Media & Entertainment in Phoenix is 2.0%.
What is the Percentage of Population Employed in Arts, Media & Entertainment in Arizona?
Percentage of Population Employed in Arts, Media & Entertainment in Arizona is 1.8%.
What is the Percentage of Population Employed in Arts, Media & Entertainment in the United States?
Percentage of Population Employed in Arts, Media & Entertainment in the United States is 2.1%.