Hormigueros Municipio, PR Map & Demographics
Hormigueros Municipio Map
Hormigueros Municipio Overview
$14,338
PER CAPITA INCOME
$27,144
AVG FAMILY INCOME
$22,542
AVG HOUSEHOLD INCOME
4.6%
WAGE / INCOME GAP [ % ]
95.4¢/ $1
WAGE / INCOME GAP [ $ ]
$9,034
FAMILY INCOME DEFICIT
0.48
INEQUALITY / GINI INDEX
15,571
TOTAL POPULATION
7,199
MALE POPULATION
8,372
FEMALE POPULATION
85.99
MALES / 100 FEMALES
116.29
FEMALES / 100 MALES
49.0
MEDIAN AGE
3.1
AVG FAMILY SIZE
2.5
AVG HOUSEHOLD SIZE
6,023
LABOR FORCE [ PEOPLE ]
44.1%
PERCENT IN LABOR FORCE
16.5%
UNEMPLOYMENT RATE
Hormigueros Municipio Area Codes
Income in Hormigueros Municipio
Income Overview in Hormigueros Municipio
Per Capita Income in Hormigueros Municipio is $14,338, while median incomes of families and households are $27,144 and $22,542 respectively.
| Characteristic | Number | Measure |
| Per Capita Income | 15,571 | $14,338 |
| Median Family Income | 4,100 | $27,144 |
| Mean Family Income | 4,100 | $39,018 |
| Median Household Income | 6,139 | $22,542 |
| Mean Household Income | 6,139 | $34,257 |
| Income Deficit | 4,100 | $9,034 |
| Wage / Income Gap (%) | 15,571 | 4.57% |
| Wage / Income Gap ($) | 15,571 | 95.43¢ per $1 |
| Gini / Inequality Index | 15,571 | 0.48 |
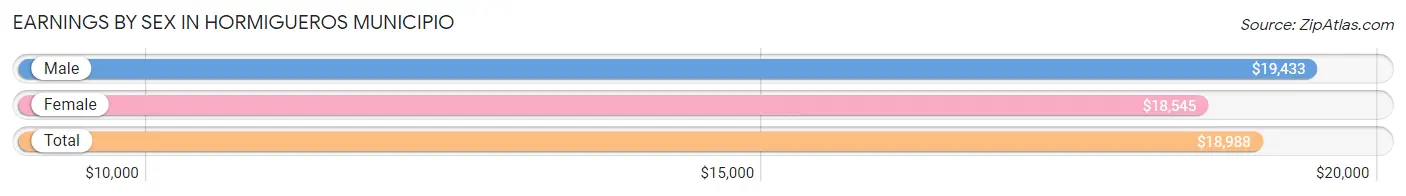
Earnings by Sex in Hormigueros Municipio
Average Earnings in Hormigueros Municipio are $18,988, $19,433 for men and $18,545 for women, a difference of 4.6%.
| Sex | Number | Average Earnings |
| Male | 2,628 (48.9%) | $19,433 |
| Female | 2,751 (51.1%) | $18,545 |
| Total | 5,379 (100.0%) | $18,988 |
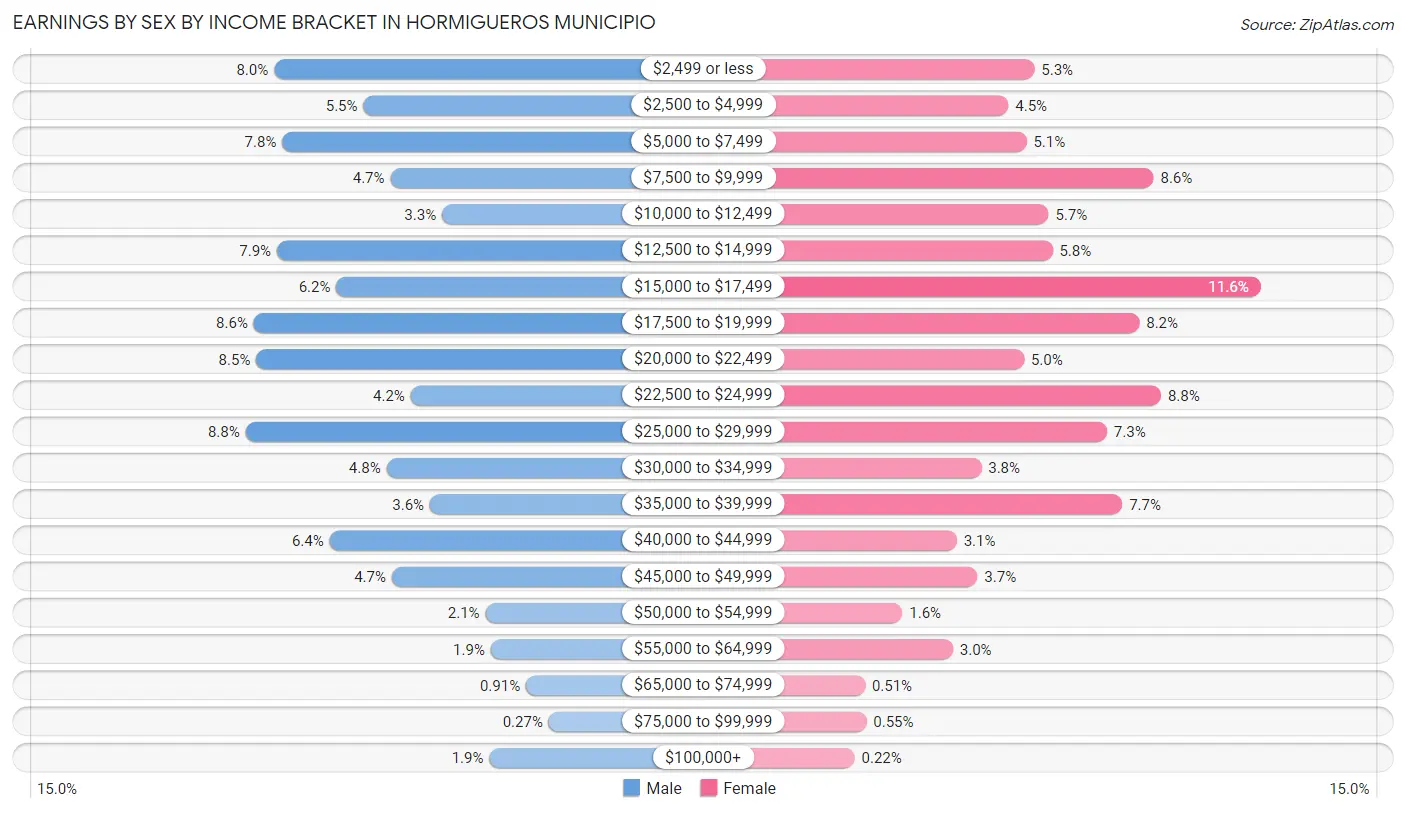
Earnings by Sex by Income Bracket in Hormigueros Municipio
The most common earnings brackets in Hormigueros Municipio are $25,000 to $29,999 for men (231 | 8.8%) and $15,000 to $17,499 for women (320 | 11.6%).
| Income | Male | Female |
| $2,499 or less | 210 (8.0%) | 145 (5.3%) |
| $2,500 to $4,999 | 144 (5.5%) | 125 (4.5%) |
| $5,000 to $7,499 | 204 (7.8%) | 139 (5.1%) |
| $7,500 to $9,999 | 124 (4.7%) | 237 (8.6%) |
| $10,000 to $12,499 | 86 (3.3%) | 156 (5.7%) |
| $12,500 to $14,999 | 208 (7.9%) | 159 (5.8%) |
| $15,000 to $17,499 | 164 (6.2%) | 320 (11.6%) |
| $17,500 to $19,999 | 225 (8.6%) | 226 (8.2%) |
| $20,000 to $22,499 | 223 (8.5%) | 137 (5.0%) |
| $22,500 to $24,999 | 109 (4.2%) | 243 (8.8%) |
| $25,000 to $29,999 | 231 (8.8%) | 201 (7.3%) |
| $30,000 to $34,999 | 127 (4.8%) | 104 (3.8%) |
| $35,000 to $39,999 | 95 (3.6%) | 213 (7.7%) |
| $40,000 to $44,999 | 169 (6.4%) | 85 (3.1%) |
| $45,000 to $49,999 | 123 (4.7%) | 101 (3.7%) |
| $50,000 to $54,999 | 54 (2.1%) | 43 (1.6%) |
| $55,000 to $64,999 | 50 (1.9%) | 82 (3.0%) |
| $65,000 to $74,999 | 24 (0.9%) | 14 (0.5%) |
| $75,000 to $99,999 | 7 (0.3%) | 15 (0.5%) |
| $100,000+ | 51 (1.9%) | 6 (0.2%) |
| Total | 2,628 (100.0%) | 2,751 (100.0%) |
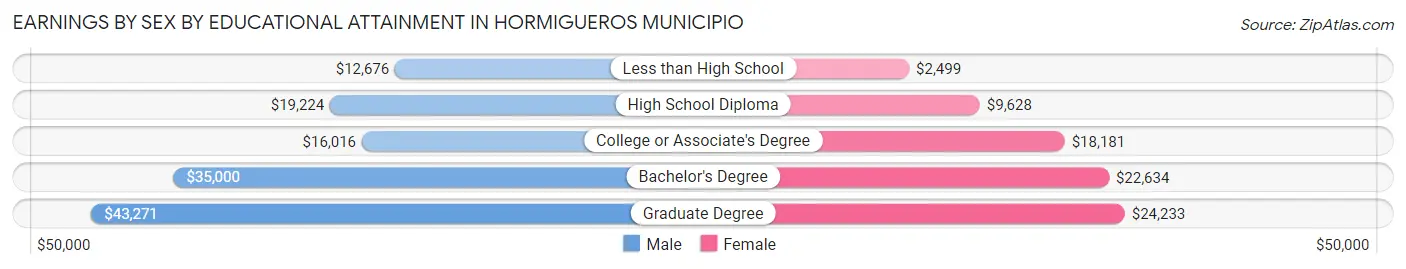
Earnings by Sex by Educational Attainment in Hormigueros Municipio
Average earnings in Hormigueros Municipio are $19,944 for men and $19,646 for women, a difference of 1.5%. Men with an educational attainment of graduate degree enjoy the highest average annual earnings of $43,271, while those with less than high school education earn the least with $12,676. Women with an educational attainment of graduate degree earn the most with the average annual earnings of $24,233, while those with less than high school education have the smallest earnings of $2,499.
| Educational Attainment | Male Income | Female Income |
| Less than High School | $12,676 | $2,499 |
| High School Diploma | $19,224 | $9,628 |
| College or Associate's Degree | $16,016 | $18,181 |
| Bachelor's Degree | $35,000 | $22,634 |
| Graduate Degree | $43,271 | $24,233 |
| Total | $19,944 | $19,646 |
Family Income in Hormigueros Municipio
Family Income Brackets in Hormigueros Municipio
According to the Hormigueros Municipio family income data, there are 980 families falling into the $15,000 to $24,999 income range, which is the most common income bracket and makes up 23.9% of all families.
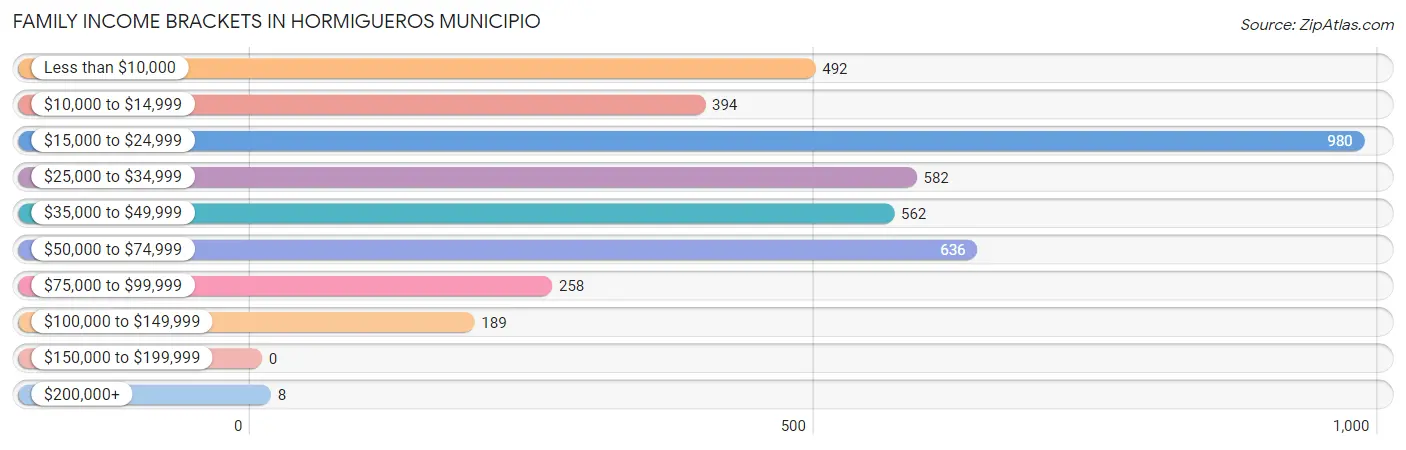
| Income Bracket | # Families | % Families |
| Less than $10,000 | 492 | 12.0% |
| $10,000 to $14,999 | 394 | 9.6% |
| $15,000 to $24,999 | 980 | 23.9% |
| $25,000 to $34,999 | 582 | 14.2% |
| $35,000 to $49,999 | 562 | 13.7% |
| $50,000 to $74,999 | 636 | 15.5% |
| $75,000 to $99,999 | 258 | 6.3% |
| $100,000 to $149,999 | 189 | 4.6% |
| $150,000 to $199,999 | 0 | 0.0% |
| $200,000+ | 8 | 0.2% |
Family Income by Famaliy Size in Hormigueros Municipio
4-person families (611 | 14.9%) account for the highest median family income in Hormigueros Municipio with $42,591 per family, while 2-person families (1,897 | 46.3%) have the highest median income of $13,085 per family member.
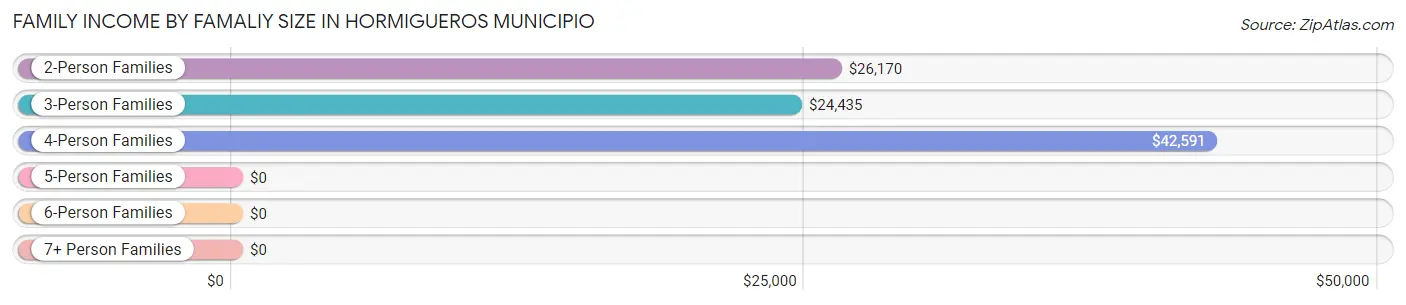
| Income Bracket | # Families | Median Income |
| 2-Person Families | 1,897 (46.3%) | $26,170 |
| 3-Person Families | 1,429 (34.8%) | $24,435 |
| 4-Person Families | 611 (14.9%) | $42,591 |
| 5-Person Families | 139 (3.4%) | $0 |
| 6-Person Families | 20 (0.5%) | $0 |
| 7+ Person Families | 4 (0.1%) | $0 |
| Total | 4,100 (100.0%) | $27,144 |
Family Income by Number of Earners in Hormigueros Municipio
The median family income in Hormigueros Municipio is $27,144, with families comprising 3+ earners (215) having the highest median family income of $68,813, while families with no earners (1,525) have the lowest median family income of $20,620, accounting for 5.2% and 37.2% of families, respectively.
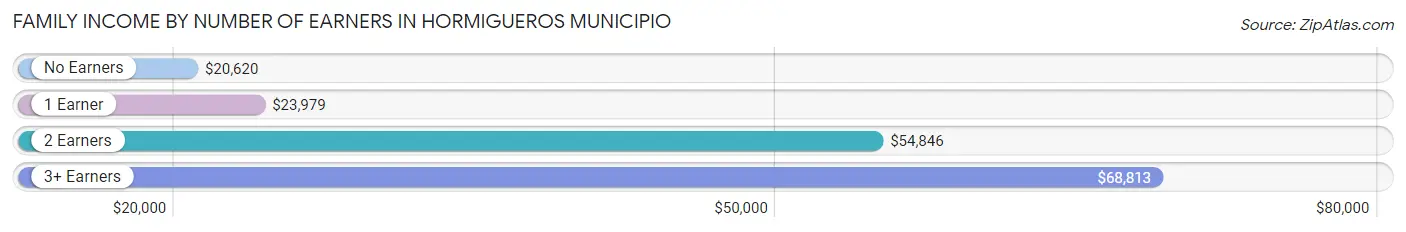
| Number of Earners | # Families | Median Income |
| No Earners | 1,525 (37.2%) | $20,620 |
| 1 Earner | 1,446 (35.3%) | $23,979 |
| 2 Earners | 914 (22.3%) | $54,846 |
| 3+ Earners | 215 (5.2%) | $68,813 |
| Total | 4,100 (100.0%) | $27,144 |
Household Income in Hormigueros Municipio
Household Income Brackets in Hormigueros Municipio
With 1,473 households falling in the category, the $15,000 to $24,999 income range is the most frequent in Hormigueros Municipio, accounting for 24.0% of all households. In contrast, only 12 households (0.2%) fall into the $150,000 to $199,999 income bracket, making it the least populous group.
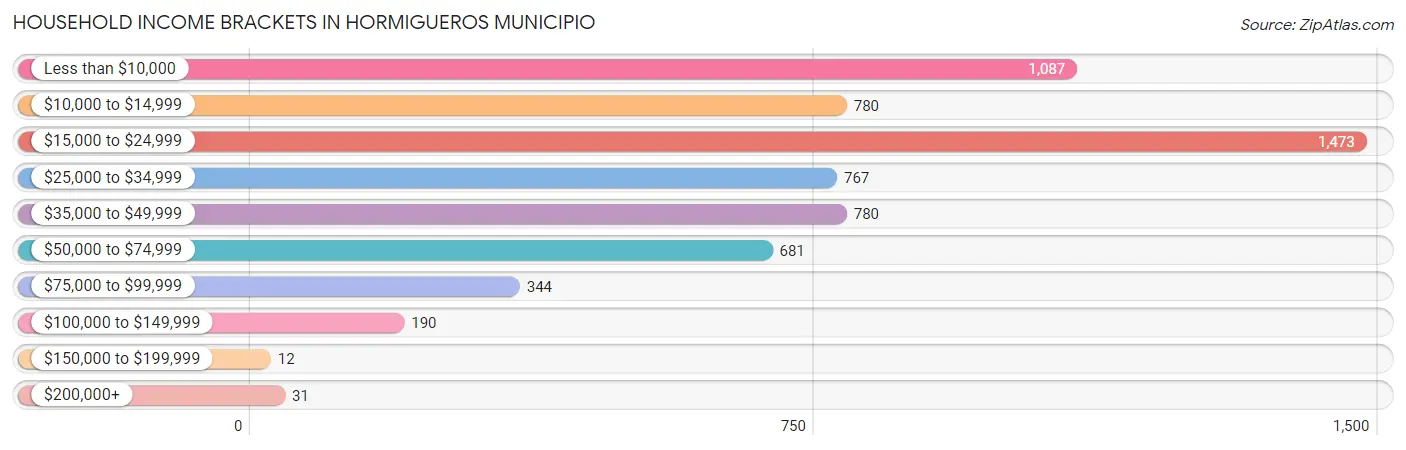
| Income Bracket | # Households | % Households |
| Less than $10,000 | 1,087 | 17.7% |
| $10,000 to $14,999 | 780 | 12.7% |
| $15,000 to $24,999 | 1,473 | 24.0% |
| $25,000 to $34,999 | 767 | 12.5% |
| $35,000 to $49,999 | 780 | 12.7% |
| $50,000 to $74,999 | 681 | 11.1% |
| $75,000 to $99,999 | 344 | 5.6% |
| $100,000 to $149,999 | 190 | 3.1% |
| $150,000 to $199,999 | 12 | 0.2% |
| $200,000+ | 31 | 0.5% |
Household Income by Householder Age in Hormigueros Municipio
The median household income in Hormigueros Municipio is $22,542, with the highest median household income of $30,615 found in the 45 to 64 years age bracket for the primary householder. A total of 2,244 households (36.5%) fall into this category. Meanwhile, the 15 to 24 years age bracket for the primary householder has the lowest median household income of $2,499, with 62 households (1.0%) in this group.
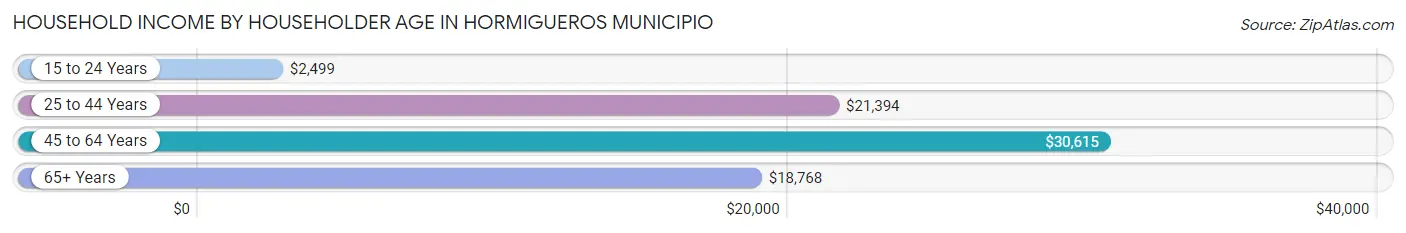
| Income Bracket | # Households | Median Income |
| 15 to 24 Years | 62 (1.0%) | $2,499 |
| 25 to 44 Years | 1,148 (18.7%) | $21,394 |
| 45 to 64 Years | 2,244 (36.5%) | $30,615 |
| 65+ Years | 2,685 (43.7%) | $18,768 |
| Total | 6,139 (100.0%) | $22,542 |
Poverty in Hormigueros Municipio
Income Below Poverty by Sex and Age in Hormigueros Municipio
With 41.7% poverty level for males and 40.7% for females among the residents of Hormigueros Municipio, under 5 year old males and 6 to 11 year old females are the most vulnerable to poverty, with 207 males (76.7%) and 272 females (72.0%) in their respective age groups living below the poverty level.
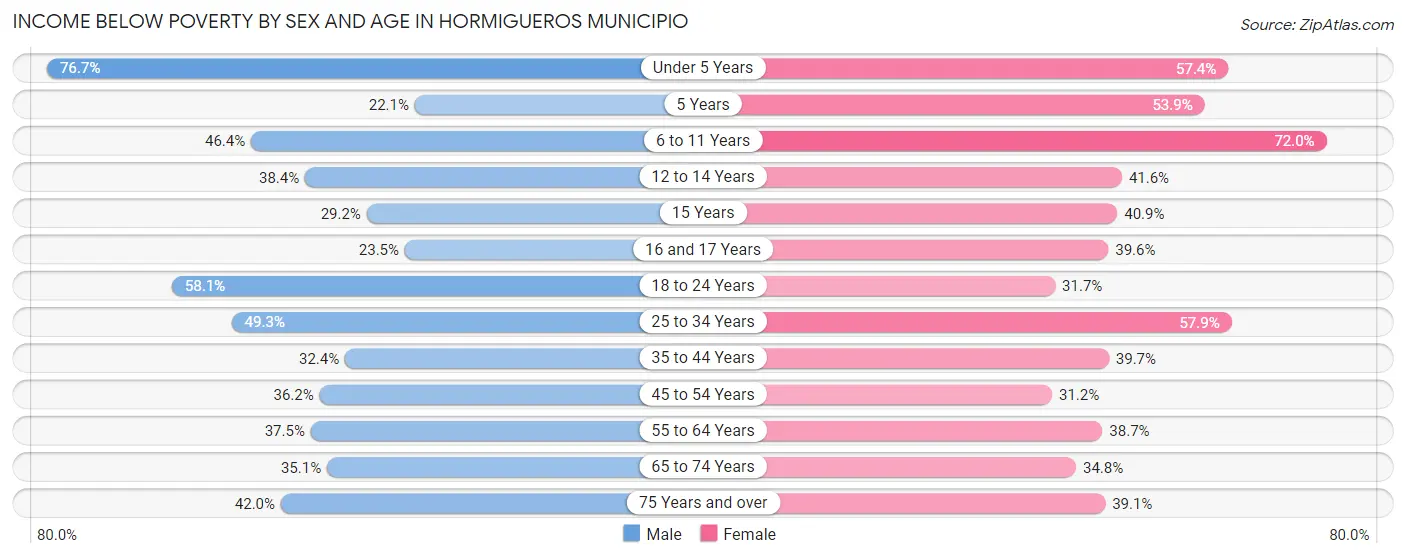
| Age Bracket | Male | Female |
| Under 5 Years | 207 (76.7%) | 74 (57.4%) |
| 5 Years | 15 (22.1%) | 28 (53.8%) |
| 6 to 11 Years | 166 (46.4%) | 272 (72.0%) |
| 12 to 14 Years | 102 (38.4%) | 99 (41.6%) |
| 15 Years | 33 (29.2%) | 9 (40.9%) |
| 16 and 17 Years | 32 (23.5%) | 93 (39.6%) |
| 18 to 24 Years | 390 (58.1%) | 204 (31.7%) |
| 25 to 34 Years | 398 (49.3%) | 482 (57.9%) |
| 35 to 44 Years | 259 (32.4%) | 353 (39.7%) |
| 45 to 54 Years | 333 (36.2%) | 364 (31.2%) |
| 55 to 64 Years | 338 (37.5%) | 430 (38.7%) |
| 65 to 74 Years | 325 (35.1%) | 409 (34.8%) |
| 75 Years and over | 388 (41.9%) | 564 (39.1%) |
| Total | 2,986 (41.7%) | 3,381 (40.7%) |
Income Above Poverty by Sex and Age in Hormigueros Municipio
According to the poverty statistics in Hormigueros Municipio, males aged 5 years and females aged 45 to 54 years are the age groups that are most secure financially, with 77.9% of males and 68.8% of females in these age groups living above the poverty line.
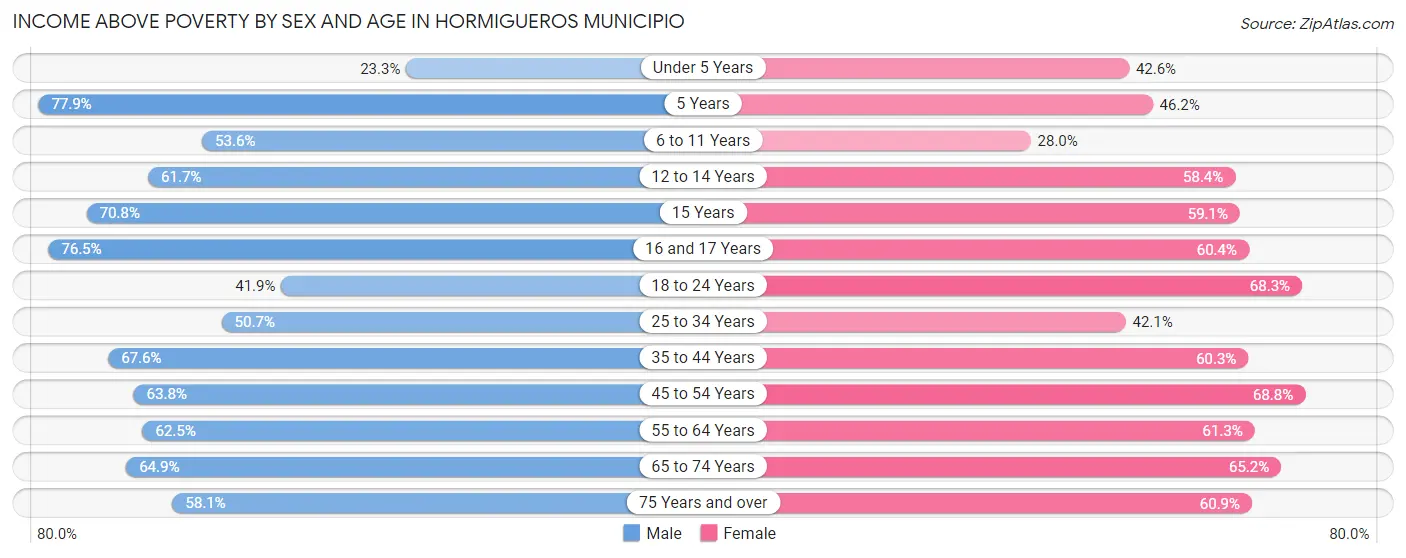
| Age Bracket | Male | Female |
| Under 5 Years | 63 (23.3%) | 55 (42.6%) |
| 5 Years | 53 (77.9%) | 24 (46.2%) |
| 6 to 11 Years | 192 (53.6%) | 106 (28.0%) |
| 12 to 14 Years | 164 (61.7%) | 139 (58.4%) |
| 15 Years | 80 (70.8%) | 13 (59.1%) |
| 16 and 17 Years | 104 (76.5%) | 142 (60.4%) |
| 18 to 24 Years | 281 (41.9%) | 440 (68.3%) |
| 25 to 34 Years | 410 (50.7%) | 351 (42.1%) |
| 35 to 44 Years | 540 (67.6%) | 537 (60.3%) |
| 45 to 54 Years | 587 (63.8%) | 802 (68.8%) |
| 55 to 64 Years | 563 (62.5%) | 681 (61.3%) |
| 65 to 74 Years | 601 (64.9%) | 767 (65.2%) |
| 75 Years and over | 537 (58.1%) | 878 (60.9%) |
| Total | 4,175 (58.3%) | 4,935 (59.3%) |
Income Below Poverty Among Married-Couple Families in Hormigueros Municipio
The poverty statistics for married-couple families in Hormigueros Municipio show that 28.5% or 675 of the total 2,366 families live below the poverty line. Families with 1 or 2 children have the highest poverty rate of 38.1%, comprising of 283 families. On the other hand, families with no children have the lowest poverty rate of 24.1%, which includes 380 families.
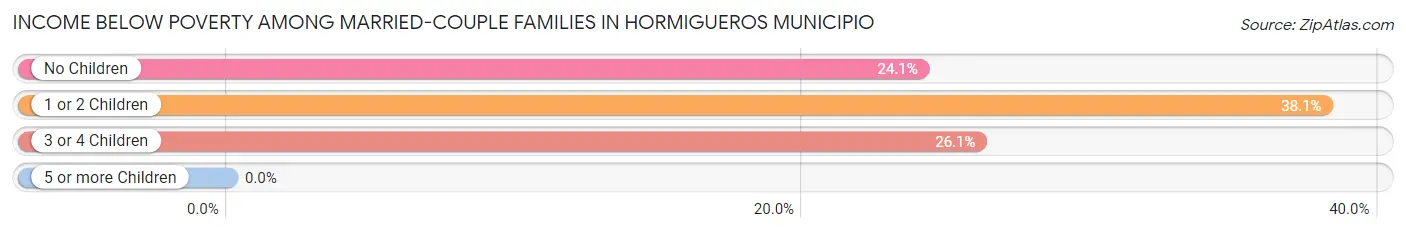
| Children | Above Poverty | Below Poverty |
| No Children | 1,198 (75.9%) | 380 (24.1%) |
| 1 or 2 Children | 459 (61.9%) | 283 (38.1%) |
| 3 or 4 Children | 34 (73.9%) | 12 (26.1%) |
| 5 or more Children | 0 (0.0%) | 0 (0.0%) |
| Total | 1,691 (71.5%) | 675 (28.5%) |
Income Below Poverty Among Single-Parent Households in Hormigueros Municipio
According to the poverty data in Hormigueros Municipio, 40.2% or 164 single-father households and 55.3% or 734 single-mother households are living below the poverty line. Among single-father households, those with 1 or 2 children have the highest poverty rate, with 48 households (50.0%) experiencing poverty. Likewise, among single-mother households, those with 1 or 2 children have the highest poverty rate, with 458 households (68.7%) falling below the poverty line.
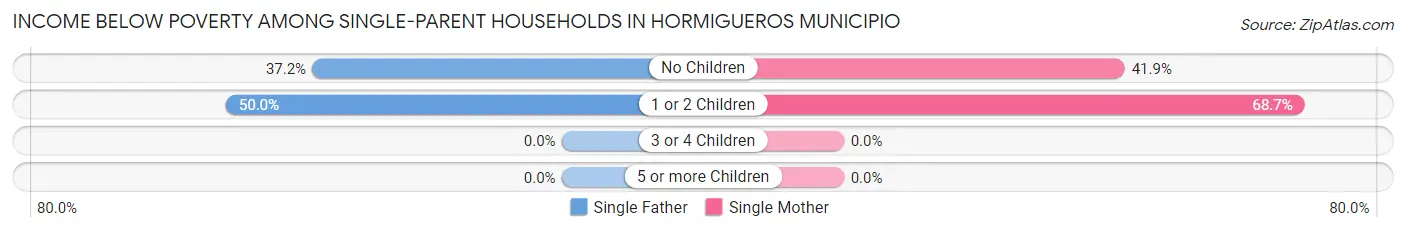
| Children | Single Father | Single Mother |
| No Children | 116 (37.2%) | 276 (41.9%) |
| 1 or 2 Children | 48 (50.0%) | 458 (68.7%) |
| 3 or 4 Children | 0 (0.0%) | 0 (0.0%) |
| 5 or more Children | 0 (0.0%) | 0 (0.0%) |
| Total | 164 (40.2%) | 734 (55.3%) |
Income Below Poverty Among Married-Couple vs Single-Parent Households in Hormigueros Municipio
The poverty data for Hormigueros Municipio shows that 675 of the married-couple family households (28.5%) and 898 of the single-parent households (51.8%) are living below the poverty level. Within the married-couple family households, those with 1 or 2 children have the highest poverty rate, with 283 households (38.1%) falling below the poverty line. Among the single-parent households, those with 1 or 2 children have the highest poverty rate, with 506 household (66.3%) living below poverty.
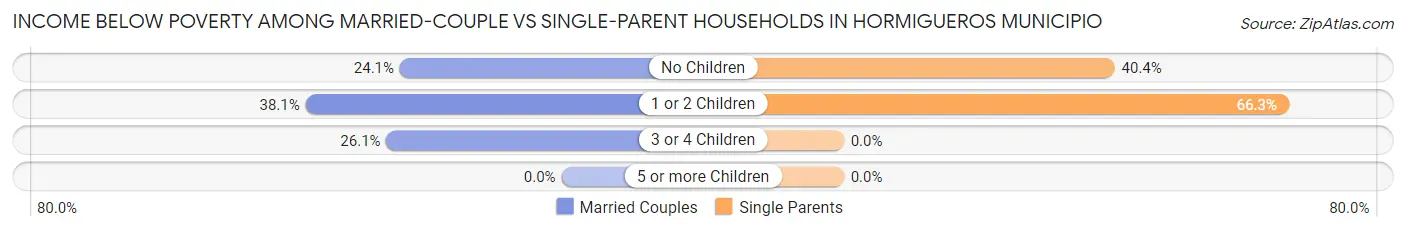
| Children | Married-Couple Families | Single-Parent Households |
| No Children | 380 (24.1%) | 392 (40.4%) |
| 1 or 2 Children | 283 (38.1%) | 506 (66.3%) |
| 3 or 4 Children | 12 (26.1%) | 0 (0.0%) |
| 5 or more Children | 0 (0.0%) | 0 (0.0%) |
| Total | 675 (28.5%) | 898 (51.8%) |
Race in Hormigueros Municipio
The most populous races in Hormigueros Municipio are Hispanic or Latino (15,358 | 98.6%), Some other Race (11,108 | 71.3%), and White / Caucasian (3,259 | 20.9%).
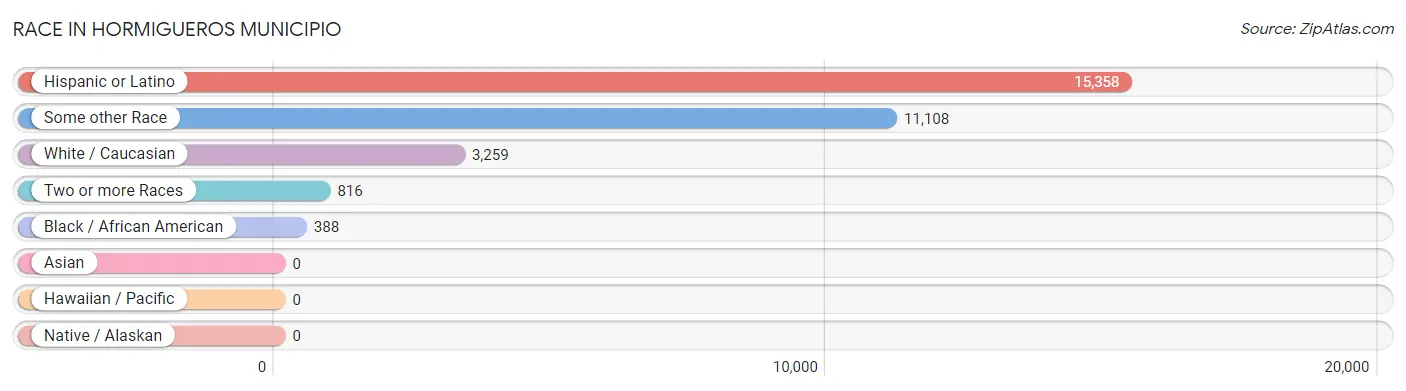
| Race | # Population | % Population |
| Asian | 0 | 0.0% |
| Black / African American | 388 | 2.5% |
| Hawaiian / Pacific | 0 | 0.0% |
| Hispanic or Latino | 15,358 | 98.6% |
| Native / Alaskan | 0 | 0.0% |
| White / Caucasian | 3,259 | 20.9% |
| Two or more Races | 816 | 5.2% |
| Some other Race | 11,108 | 71.3% |
| Total | 15,571 | 100.0% |
Ancestry in Hormigueros Municipio
The most populous ancestries reported in Hormigueros Municipio are Puerto Rican (15,066 | 96.8%), American (225 | 1.4%), Dominican (221 | 1.4%), Portuguese (19 | 0.1%), and Chilean (18 | 0.1%), together accounting for 99.9% of all Hormigueros Municipio residents.
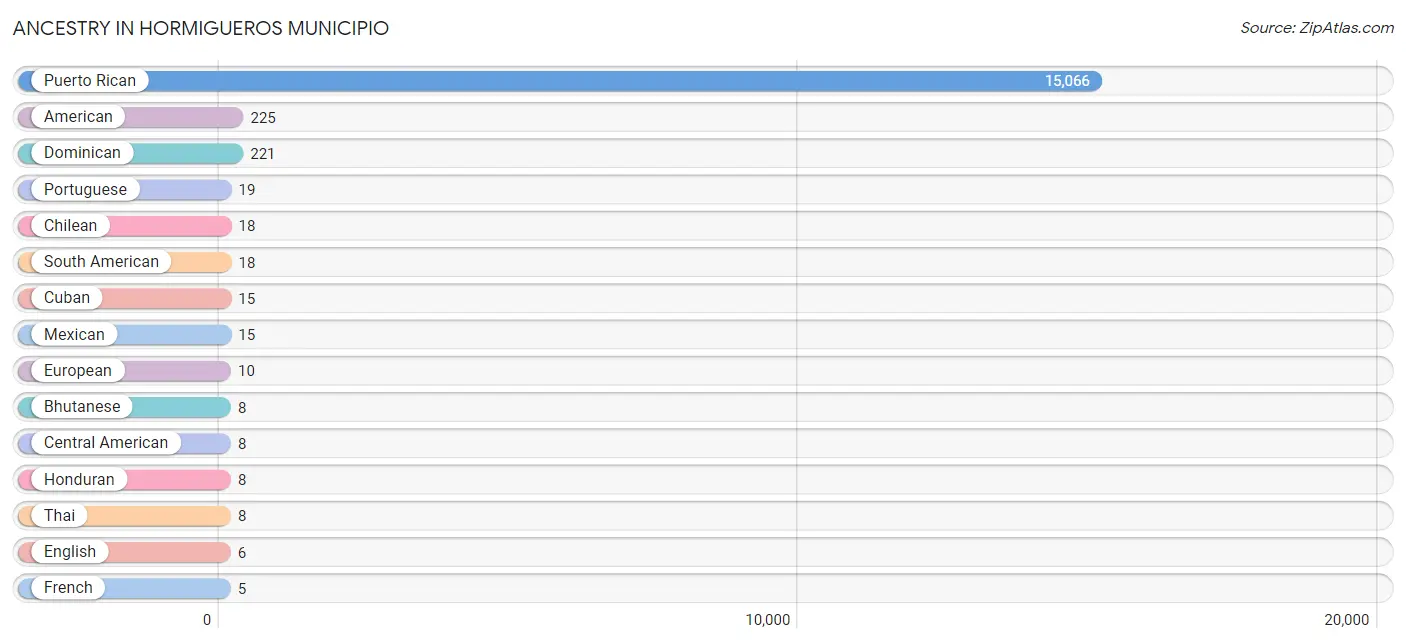
| Ancestry | # Population | % Population |
| American | 225 | 1.4% |
| Bhutanese | 8 | 0.1% |
| Central American | 8 | 0.1% |
| Chilean | 18 | 0.1% |
| Cuban | 15 | 0.1% |
| Dominican | 221 | 1.4% |
| English | 6 | 0.0% |
| European | 10 | 0.1% |
| French | 5 | 0.0% |
| Honduran | 8 | 0.1% |
| Mexican | 15 | 0.1% |
| Portuguese | 19 | 0.1% |
| Puerto Rican | 15,066 | 96.8% |
| South American | 18 | 0.1% |
| Spaniard | 5 | 0.0% |
| Thai | 8 | 0.1% | View All 16 Rows |
Immigrants in Hormigueros Municipio

| Immigration Origin | # Population | % Population | View All 0 Rows |
Sex and Age in Hormigueros Municipio
Sex and Age in Hormigueros Municipio
The most populous age groups in Hormigueros Municipio are 65 to 69 Years (489 | 6.8%) for men and 75 to 79 Years (688 | 8.2%) for women.
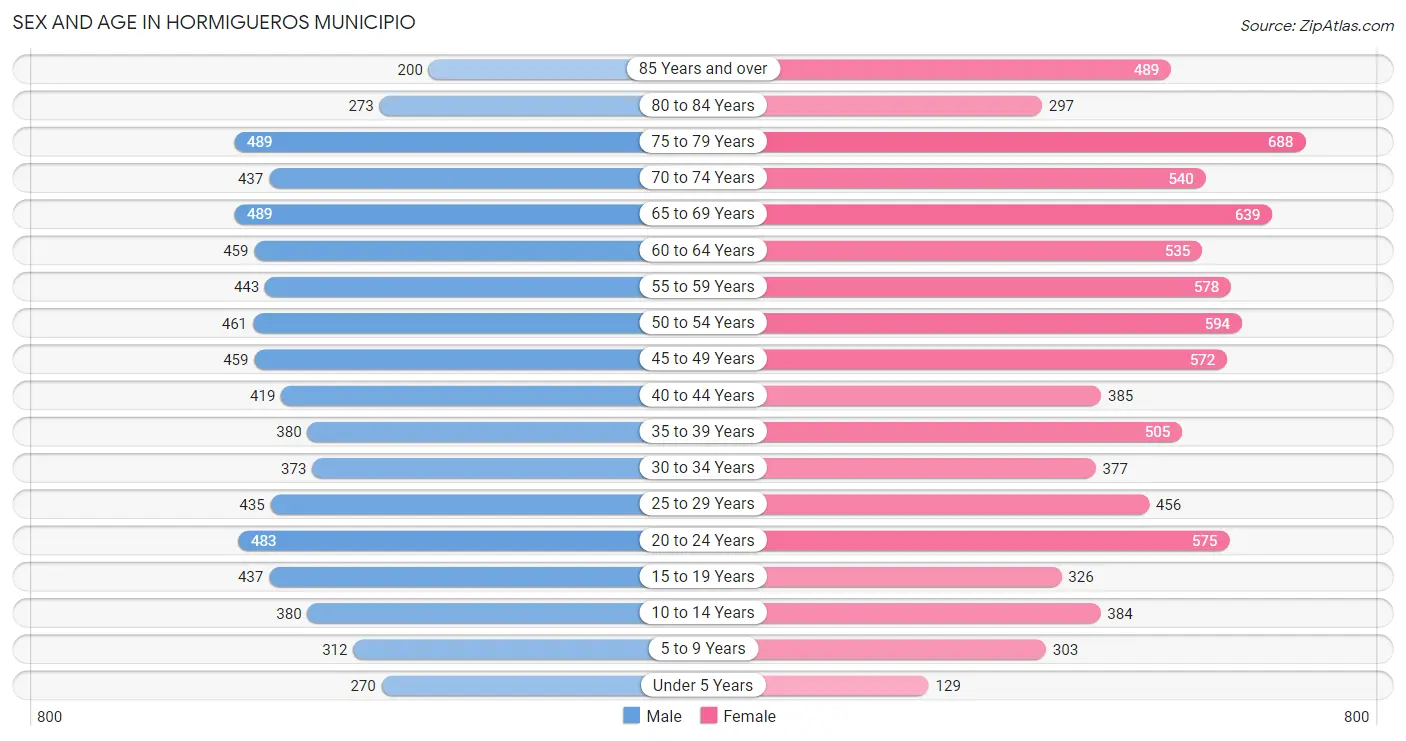
| Age Bracket | Male | Female |
| Under 5 Years | 270 (3.7%) | 129 (1.5%) |
| 5 to 9 Years | 312 (4.3%) | 303 (3.6%) |
| 10 to 14 Years | 380 (5.3%) | 384 (4.6%) |
| 15 to 19 Years | 437 (6.1%) | 326 (3.9%) |
| 20 to 24 Years | 483 (6.7%) | 575 (6.9%) |
| 25 to 29 Years | 435 (6.0%) | 456 (5.4%) |
| 30 to 34 Years | 373 (5.2%) | 377 (4.5%) |
| 35 to 39 Years | 380 (5.3%) | 505 (6.0%) |
| 40 to 44 Years | 419 (5.8%) | 385 (4.6%) |
| 45 to 49 Years | 459 (6.4%) | 572 (6.8%) |
| 50 to 54 Years | 461 (6.4%) | 594 (7.1%) |
| 55 to 59 Years | 443 (6.1%) | 578 (6.9%) |
| 60 to 64 Years | 459 (6.4%) | 535 (6.4%) |
| 65 to 69 Years | 489 (6.8%) | 639 (7.6%) |
| 70 to 74 Years | 437 (6.1%) | 540 (6.5%) |
| 75 to 79 Years | 489 (6.8%) | 688 (8.2%) |
| 80 to 84 Years | 273 (3.8%) | 297 (3.5%) |
| 85 Years and over | 200 (2.8%) | 489 (5.8%) |
| Total | 7,199 (100.0%) | 8,372 (100.0%) |
Families and Households in Hormigueros Municipio
Median Family Size in Hormigueros Municipio
The median family size in Hormigueros Municipio is 3.13 persons per family, with married-couple families (2,366 | 57.7%) accounting for the largest median family size of 3.26 persons per family. On the other hand, single male/father families (408 | 10.0%) represent the smallest median family size with 2.88 persons per family.

| Family Type | # Families | Family Size |
| Married-Couple | 2,366 (57.7%) | 3.26 |
| Single Male/Father | 408 (10.0%) | 2.88 |
| Single Female/Mother | 1,326 (32.3%) | 2.99 |
| Total Families | 4,100 (100.0%) | 3.13 |
Median Household Size in Hormigueros Municipio
The median household size in Hormigueros Municipio is 2.51 persons per household, with married-couple households (2,366 | 38.5%) accounting for the largest median household size of 3.27 persons per household. non-family households (2,039 | 33.2%) represent the smallest median household size with 1.14 persons per household.

| Household Type | # Households | Household Size |
| Married-Couple | 2,366 (38.5%) | 3.27 |
| Single Male/Father | 408 (6.7%) | 3.03 |
| Single Female/Mother | 1,326 (21.6%) | 3.10 |
| Non-family | 2,039 (33.2%) | 1.14 |
| Total Households | 6,139 (100.0%) | 2.51 |
Household Size by Marriage Status in Hormigueros Municipio
Out of a total of 6,139 households in Hormigueros Municipio, 4,100 (66.8%) are family households, while 2,039 (33.2%) are nonfamily households. The most numerous type of family households are 2-person households, comprising 1,781, and the most common type of nonfamily households are 1-person households, comprising 1,733.
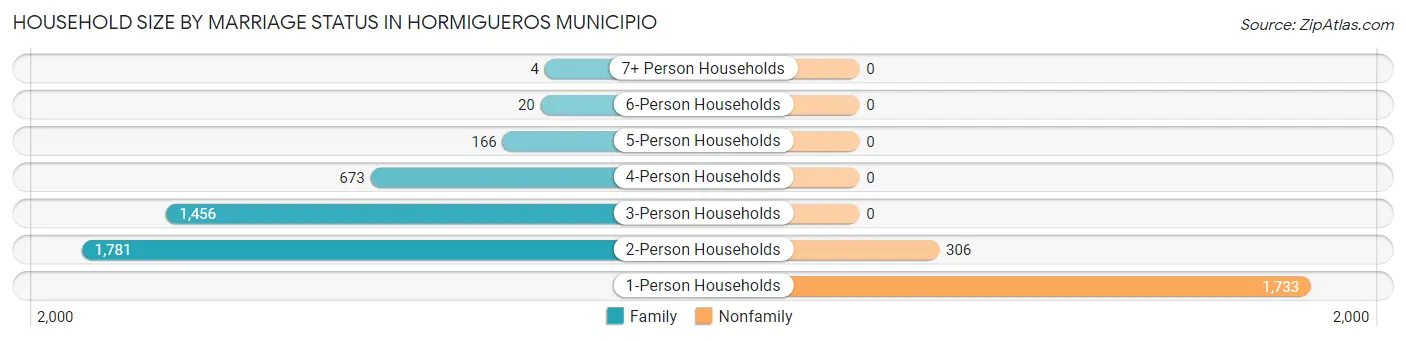
| Household Size | Family Households | Nonfamily Households |
| 1-Person Households | - | 1,733 (28.2%) |
| 2-Person Households | 1,781 (29.0%) | 306 (5.0%) |
| 3-Person Households | 1,456 (23.7%) | 0 (0.0%) |
| 4-Person Households | 673 (11.0%) | 0 (0.0%) |
| 5-Person Households | 166 (2.7%) | 0 (0.0%) |
| 6-Person Households | 20 (0.3%) | 0 (0.0%) |
| 7+ Person Households | 4 (0.1%) | 0 (0.0%) |
| Total | 4,100 (66.8%) | 2,039 (33.2%) |
Female Fertility in Hormigueros Municipio
Fertility by Age in Hormigueros Municipio
Average fertility rate in Hormigueros Municipio is 36.0 births per 1,000 women. Women in the age bracket of 20 to 34 years have the highest fertility rate with 61.0 births per 1,000 women. Women in the age bracket of 20 to 34 years acount for 71.1% of all women with births.
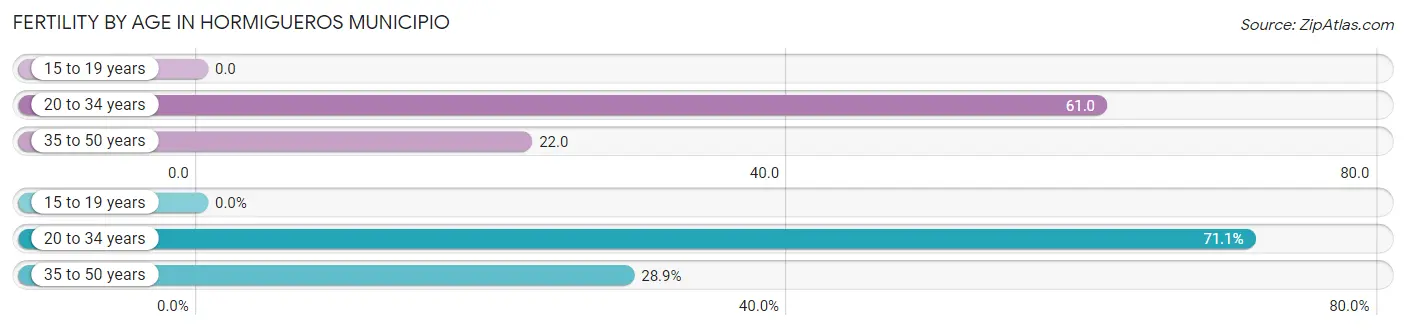
| Age Bracket | Women with Births | Births / 1,000 Women |
| 15 to 19 years | 0 (0.0%) | 0.0 |
| 20 to 34 years | 86 (71.1%) | 61.0 |
| 35 to 50 years | 35 (28.9%) | 22.0 |
| Total | 121 (100.0%) | 36.0 |
Fertility by Age by Marriage Status in Hormigueros Municipio
39.7% of women with births (121) in Hormigueros Municipio are married. The highest percentage of unmarried women with births falls into 35 to 50 years age bracket with 100.0% of them unmarried at the time of birth, while the lowest percentage of unmarried women with births belong to 20 to 34 years age bracket with 44.2% of them unmarried.
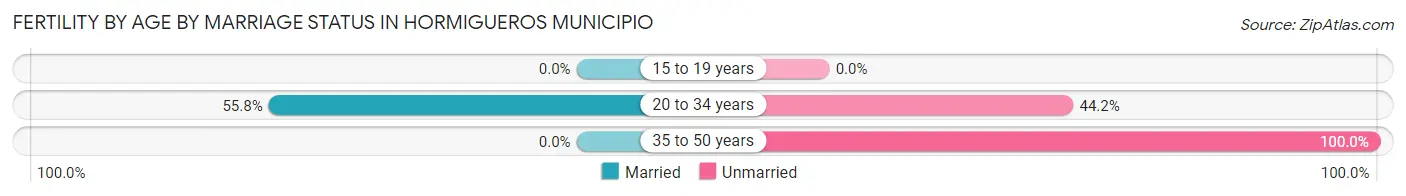
| Age Bracket | Married | Unmarried |
| 15 to 19 years | 0 (0.0%) | 0 (0.0%) |
| 20 to 34 years | 48 (55.8%) | 38 (44.2%) |
| 35 to 50 years | 0 (0.0%) | 35 (100.0%) |
| Total | 48 (39.7%) | 73 (60.3%) |
Fertility by Education in Hormigueros Municipio
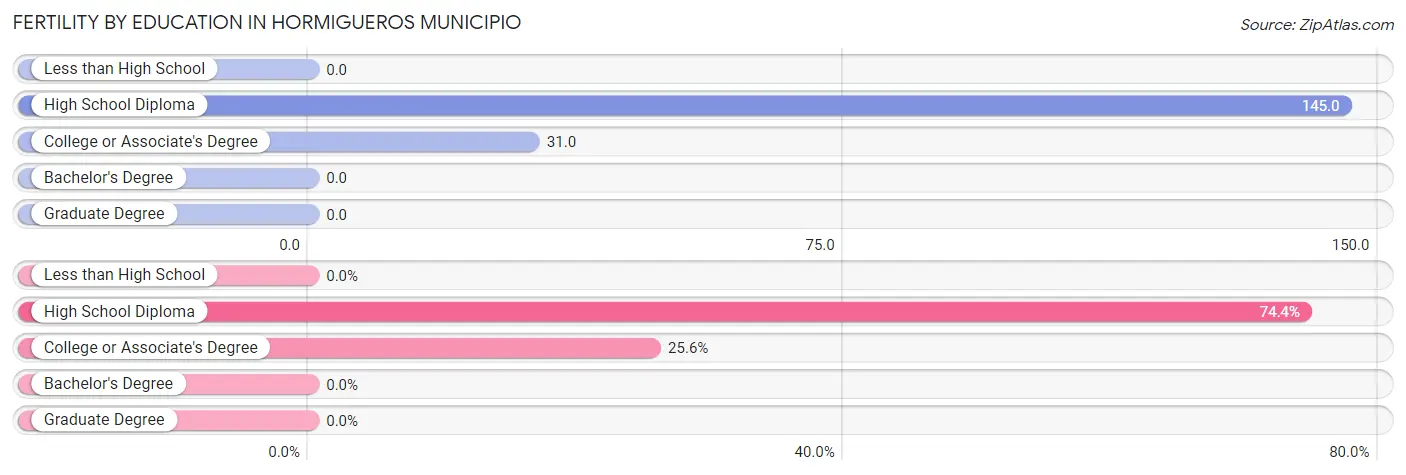
| Educational Attainment | Women with Births | Births / 1,000 Women |
| Less than High School | 0 (0.0%) | 0.0 |
| High School Diploma | 90 (74.4%) | 145.0 |
| College or Associate's Degree | 31 (25.6%) | 31.0 |
| Bachelor's Degree | 0 (0.0%) | 0.0 |
| Graduate Degree | 0 (0.0%) | 0.0 |
| Total | 121 (100.0%) | 36.0 |
Fertility by Education by Marriage Status in Hormigueros Municipio
60.3% of women with births in Hormigueros Municipio are unmarried. Women with the educational attainment of high school diploma are most likely to be married with 53.3% of them married at childbirth, while women with the educational attainment of college or associate's degree are least likely to be married with 100.0% of them unmarried at childbirth.
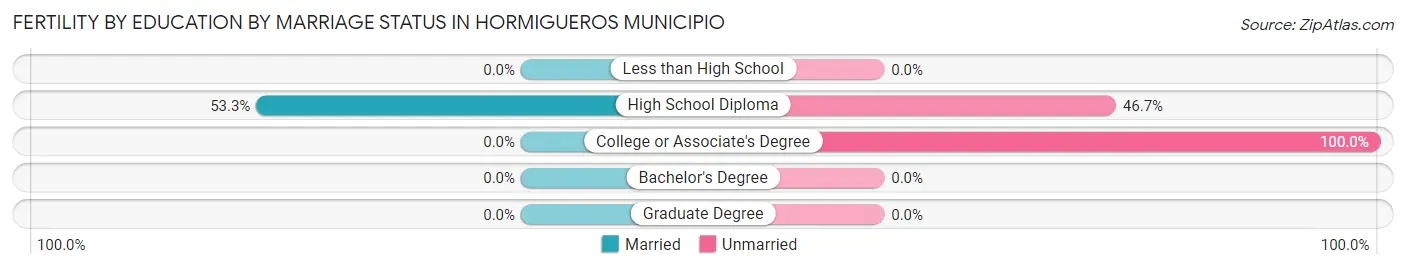
| Educational Attainment | Married | Unmarried |
| Less than High School | 0 (0.0%) | 0 (0.0%) |
| High School Diploma | 48 (53.3%) | 42 (46.7%) |
| College or Associate's Degree | 0 (0.0%) | 31 (100.0%) |
| Bachelor's Degree | 0 (0.0%) | 0 (0.0%) |
| Graduate Degree | 0 (0.0%) | 0 (0.0%) |
| Total | 48 (39.7%) | 73 (60.3%) |
Employment Characteristics in Hormigueros Municipio
Employment by Class of Employer in Hormigueros Municipio
Among the 4,907 employed individuals in Hormigueros Municipio, private company employees (3,158 | 64.4%), state government employees (967 | 19.7%), and local government employees (252 | 5.1%) make up the most common classes of employment.
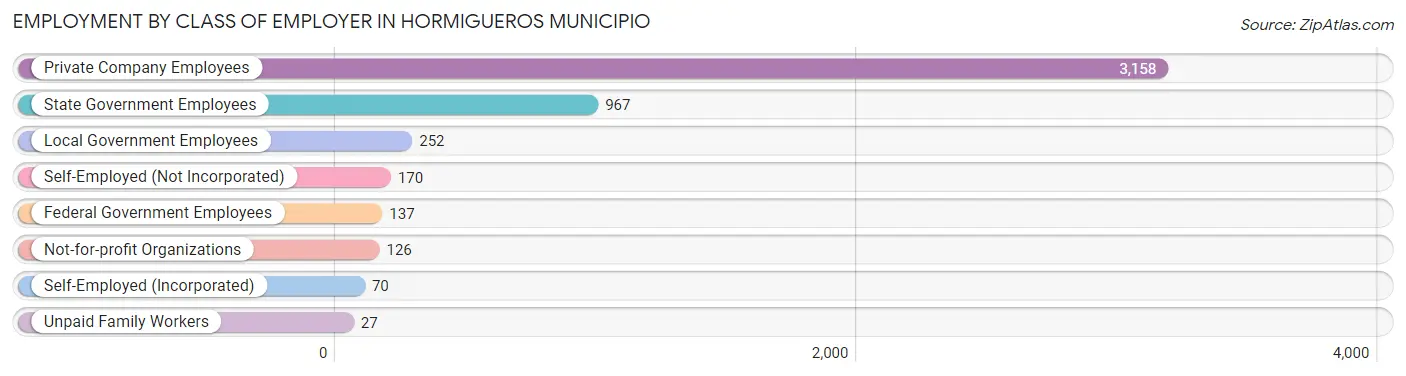
| Employer Class | # Employees | % Employees |
| Private Company Employees | 3,158 | 64.4% |
| Self-Employed (Incorporated) | 70 | 1.4% |
| Self-Employed (Not Incorporated) | 170 | 3.5% |
| Not-for-profit Organizations | 126 | 2.6% |
| Local Government Employees | 252 | 5.1% |
| State Government Employees | 967 | 19.7% |
| Federal Government Employees | 137 | 2.8% |
| Unpaid Family Workers | 27 | 0.5% |
| Total | 4,907 | 100.0% |
Employment Status by Age in Hormigueros Municipio
According to the labor force statistics for Hormigueros Municipio, out of the total population over 16 years of age (13,658), 44.1% or 6,023 individuals are in the labor force, with 16.5% or 994 of them unemployed. The age group with the highest labor force participation rate is 30 to 34 years, with 92.5% or 694 individuals in the labor force. Within the labor force, the 16 to 19 years age range has the highest percentage of unemployed individuals, with 55.6% or 74 of them being unemployed.
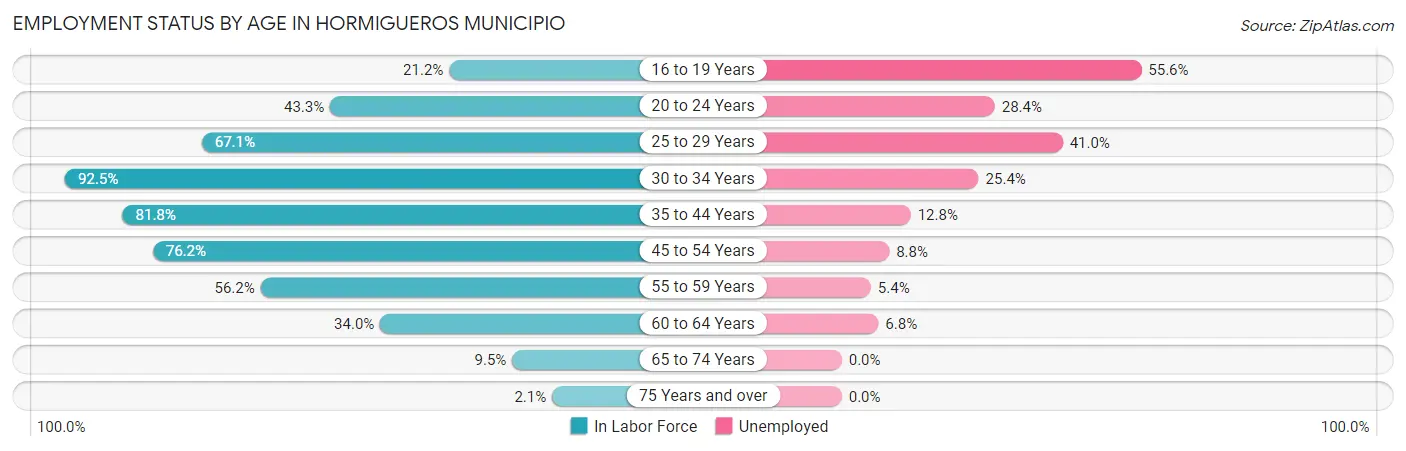
| Age Bracket | In Labor Force | Unemployed |
| 16 to 19 Years | 133 (21.2%) | 74 (55.6%) |
| 20 to 24 Years | 458 (43.3%) | 130 (28.4%) |
| 25 to 29 Years | 598 (67.1%) | 245 (41.0%) |
| 30 to 34 Years | 694 (92.5%) | 176 (25.4%) |
| 35 to 44 Years | 1,382 (81.8%) | 177 (12.8%) |
| 45 to 54 Years | 1,590 (76.2%) | 140 (8.8%) |
| 55 to 59 Years | 574 (56.2%) | 31 (5.4%) |
| 60 to 64 Years | 338 (34.0%) | 23 (6.8%) |
| 65 to 74 Years | 200 (9.5%) | 0 (0.0%) |
| 75 Years and over | 51 (2.1%) | 0 (0.0%) |
| Total | 6,023 (44.1%) | 994 (16.5%) |
Employment Status by Educational Attainment in Hormigueros Municipio
According to labor force statistics for Hormigueros Municipio, 69.6% of individuals (5,172) out of the total population between 25 and 64 years of age (7,431) are in the labor force, with 15.3% or 791 of them being unemployed. The group with the highest labor force participation rate are those with the educational attainment of bachelor's degree or higher, with 80.6% or 2,188 individuals in the labor force. Within the labor force, individuals with less than high school education have the highest percentage of unemployment, with 38.7% or 94 of them being unemployed.
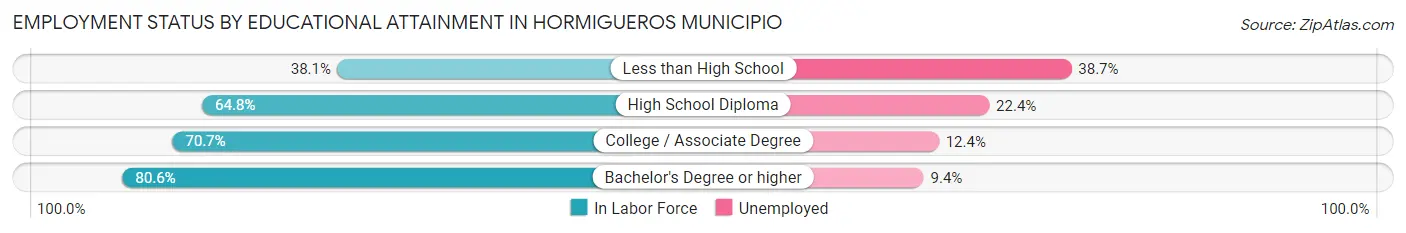
| Educational Attainment | In Labor Force | Unemployed |
| Less than High School | 243 (38.1%) | 247 (38.7%) |
| High School Diploma | 1,507 (64.8%) | 521 (22.4%) |
| College / Associate Degree | 1,239 (70.7%) | 217 (12.4%) |
| Bachelor's Degree or higher | 2,188 (80.6%) | 255 (9.4%) |
| Total | 5,172 (69.6%) | 1,137 (15.3%) |
Employment Occupations by Sex in Hormigueros Municipio
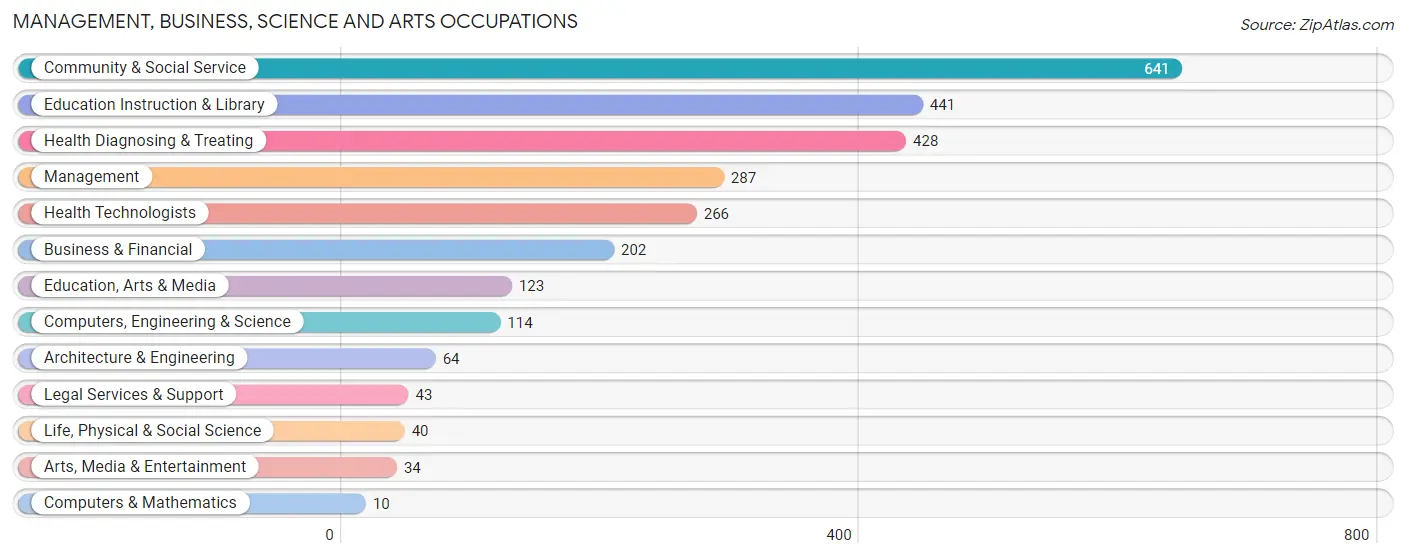
Management, Business, Science and Arts Occupations
The most common Management, Business, Science and Arts occupations in Hormigueros Municipio are Community & Social Service (641 | 12.8%), Education Instruction & Library (441 | 8.8%), Health Diagnosing & Treating (428 | 8.6%), Management (287 | 5.7%), and Health Technologists (266 | 5.3%).
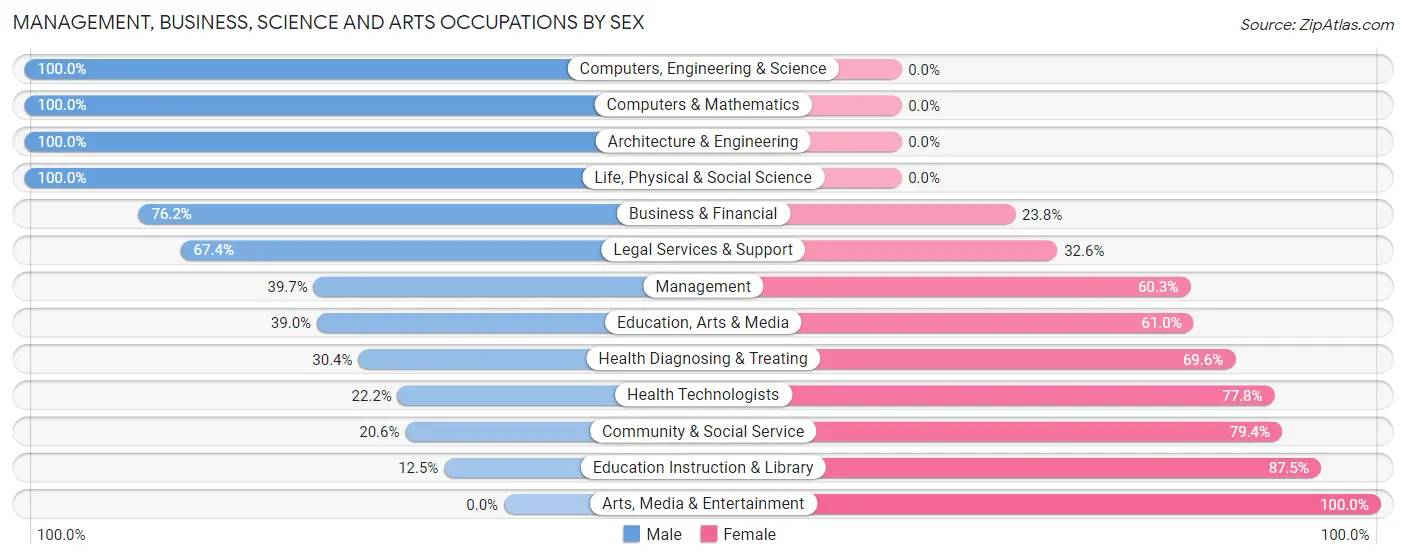
Management, Business, Science and Arts Occupations by Sex
Within the Management, Business, Science and Arts occupations in Hormigueros Municipio, the most male-oriented occupations are Computers, Engineering & Science (100.0%), Computers & Mathematics (100.0%), and Architecture & Engineering (100.0%), while the most female-oriented occupations are Arts, Media & Entertainment (100.0%), Education Instruction & Library (87.5%), and Community & Social Service (79.4%).
| Occupation | Male | Female |
| Management | 114 (39.7%) | 173 (60.3%) |
| Business & Financial | 154 (76.2%) | 48 (23.8%) |
| Computers, Engineering & Science | 114 (100.0%) | 0 (0.0%) |
| Computers & Mathematics | 10 (100.0%) | 0 (0.0%) |
| Architecture & Engineering | 64 (100.0%) | 0 (0.0%) |
| Life, Physical & Social Science | 40 (100.0%) | 0 (0.0%) |
| Community & Social Service | 132 (20.6%) | 509 (79.4%) |
| Education, Arts & Media | 48 (39.0%) | 75 (61.0%) |
| Legal Services & Support | 29 (67.4%) | 14 (32.6%) |
| Education Instruction & Library | 55 (12.5%) | 386 (87.5%) |
| Arts, Media & Entertainment | 0 (0.0%) | 34 (100.0%) |
| Health Diagnosing & Treating | 130 (30.4%) | 298 (69.6%) |
| Health Technologists | 59 (22.2%) | 207 (77.8%) |
| Total (Category) | 644 (38.5%) | 1,028 (61.5%) |
| Total (Overall) | 2,352 (47.0%) | 2,650 (53.0%) |
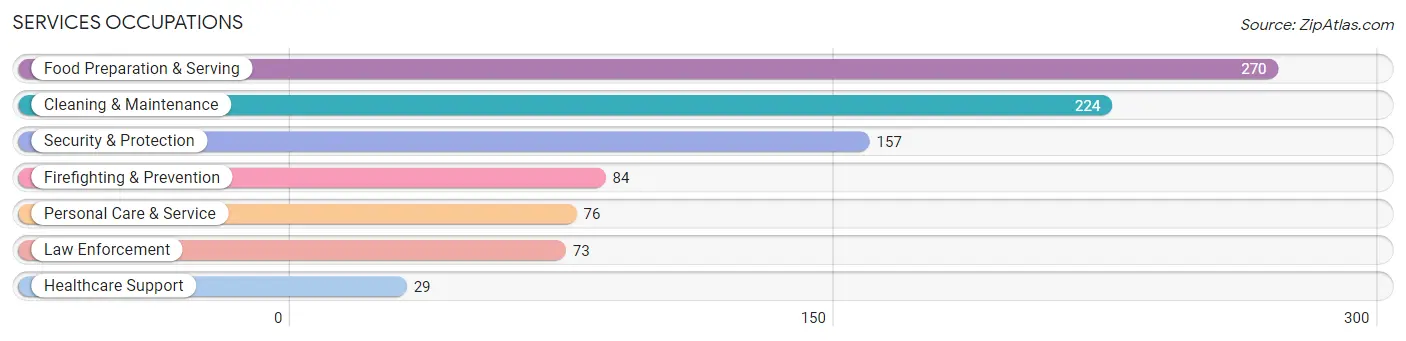
Services Occupations
The most common Services occupations in Hormigueros Municipio are Food Preparation & Serving (270 | 5.4%), Cleaning & Maintenance (224 | 4.5%), Security & Protection (157 | 3.1%), Firefighting & Prevention (84 | 1.7%), and Personal Care & Service (76 | 1.5%).
Services Occupations by Sex
Within the Services occupations in Hormigueros Municipio, the most male-oriented occupations are Law Enforcement (100.0%), Personal Care & Service (100.0%), and Security & Protection (95.5%), while the most female-oriented occupations are Healthcare Support (72.4%), Food Preparation & Serving (45.9%), and Cleaning & Maintenance (45.1%).
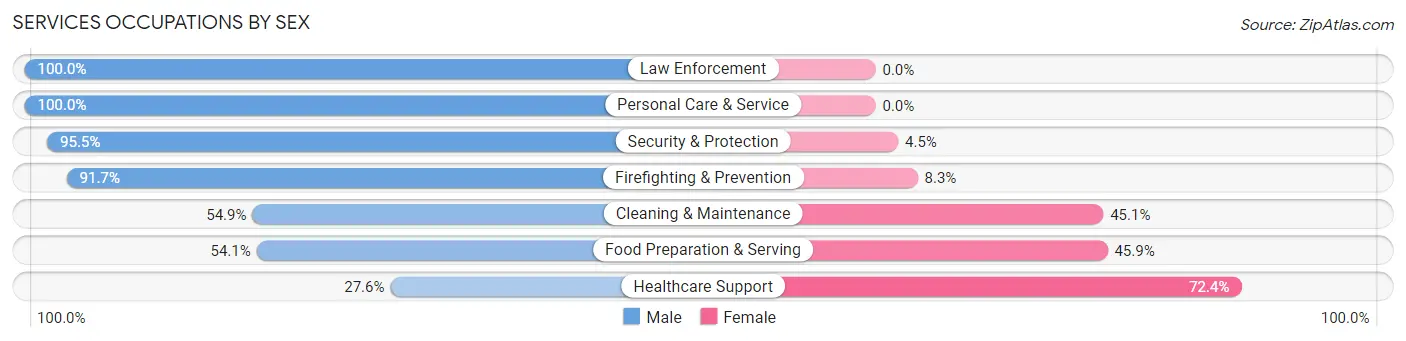
| Occupation | Male | Female |
| Healthcare Support | 8 (27.6%) | 21 (72.4%) |
| Security & Protection | 150 (95.5%) | 7 (4.5%) |
| Firefighting & Prevention | 77 (91.7%) | 7 (8.3%) |
| Law Enforcement | 73 (100.0%) | 0 (0.0%) |
| Food Preparation & Serving | 146 (54.1%) | 124 (45.9%) |
| Cleaning & Maintenance | 123 (54.9%) | 101 (45.1%) |
| Personal Care & Service | 76 (100.0%) | 0 (0.0%) |
| Total (Category) | 503 (66.5%) | 253 (33.5%) |
| Total (Overall) | 2,352 (47.0%) | 2,650 (53.0%) |
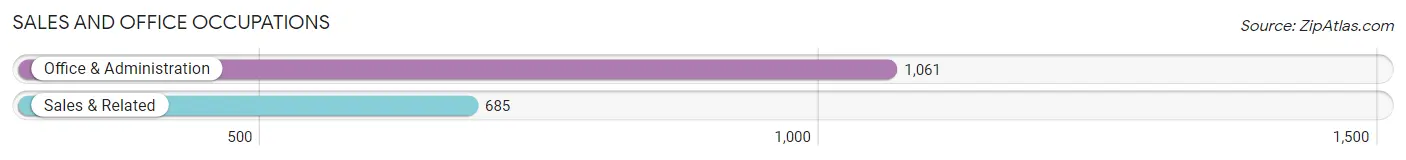
Sales and Office Occupations
The most common Sales and Office occupations in Hormigueros Municipio are Office & Administration (1,061 | 21.2%), and Sales & Related (685 | 13.7%).
Sales and Office Occupations by Sex
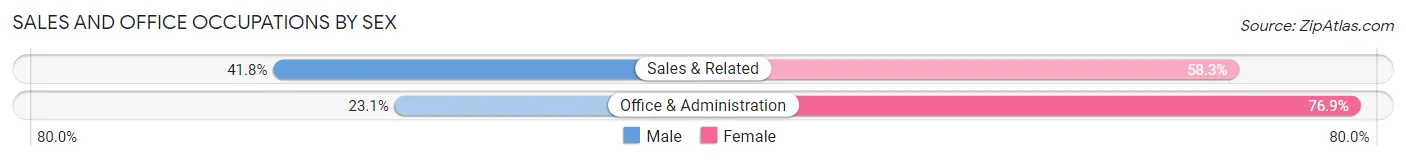
| Occupation | Male | Female |
| Sales & Related | 286 (41.7%) | 399 (58.3%) |
| Office & Administration | 245 (23.1%) | 816 (76.9%) |
| Total (Category) | 531 (30.4%) | 1,215 (69.6%) |
| Total (Overall) | 2,352 (47.0%) | 2,650 (53.0%) |
Natural Resources, Construction and Maintenance Occupations
The most common Natural Resources, Construction and Maintenance occupations in Hormigueros Municipio are Installation, Maintenance & Repair (140 | 2.8%), Construction & Extraction (104 | 2.1%), and Farming, Fishing & Forestry (15 | 0.3%).
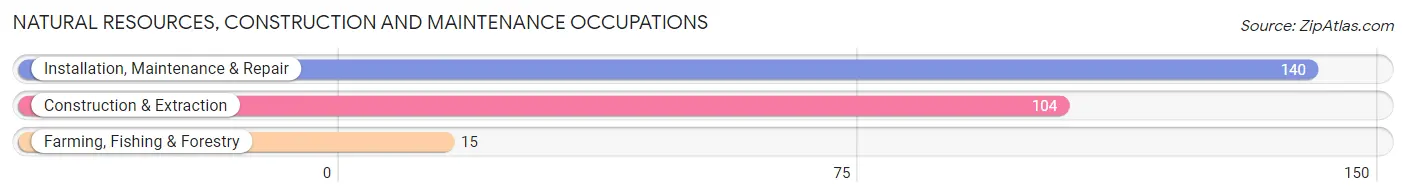
Natural Resources, Construction and Maintenance Occupations by Sex
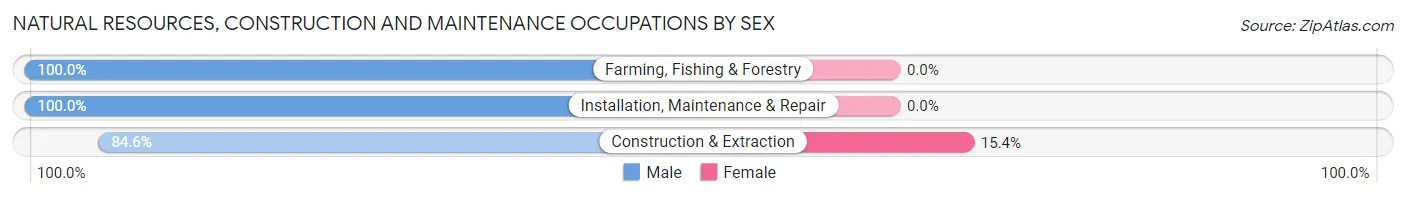
| Occupation | Male | Female |
| Farming, Fishing & Forestry | 15 (100.0%) | 0 (0.0%) |
| Construction & Extraction | 88 (84.6%) | 16 (15.4%) |
| Installation, Maintenance & Repair | 140 (100.0%) | 0 (0.0%) |
| Total (Category) | 243 (93.8%) | 16 (6.2%) |
| Total (Overall) | 2,352 (47.0%) | 2,650 (53.0%) |
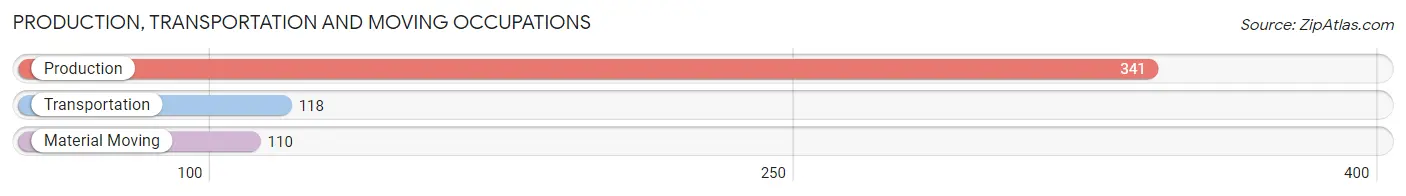
Production, Transportation and Moving Occupations
The most common Production, Transportation and Moving occupations in Hormigueros Municipio are Production (341 | 6.8%), Transportation (118 | 2.4%), and Material Moving (110 | 2.2%).
Production, Transportation and Moving Occupations by Sex
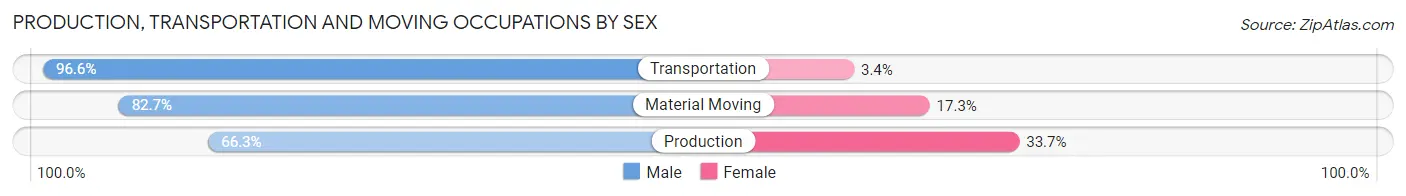
| Occupation | Male | Female |
| Production | 226 (66.3%) | 115 (33.7%) |
| Transportation | 114 (96.6%) | 4 (3.4%) |
| Material Moving | 91 (82.7%) | 19 (17.3%) |
| Total (Category) | 431 (75.7%) | 138 (24.2%) |
| Total (Overall) | 2,352 (47.0%) | 2,650 (53.0%) |
Employment Industries by Sex in Hormigueros Municipio
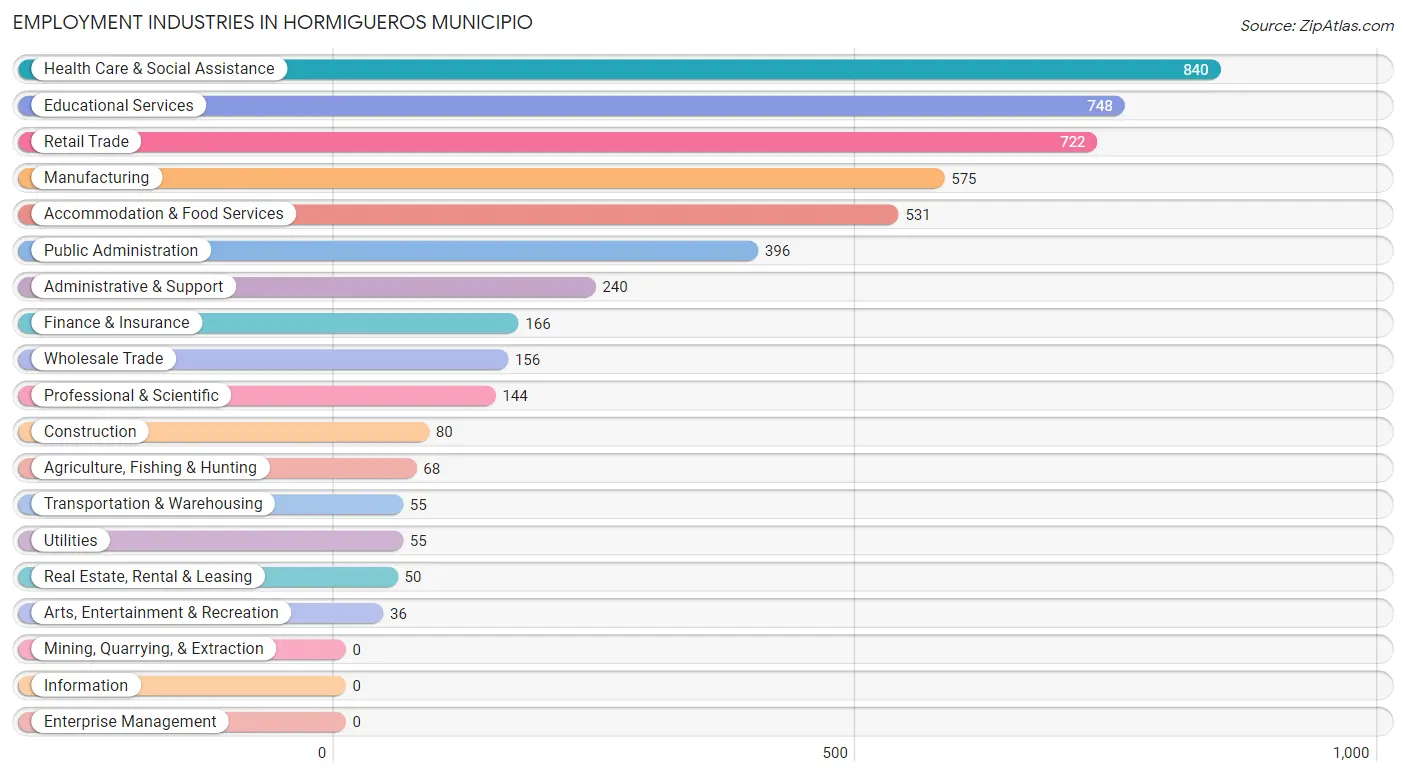
Employment Industries in Hormigueros Municipio
The major employment industries in Hormigueros Municipio include Health Care & Social Assistance (840 | 16.8%), Educational Services (748 | 14.9%), Retail Trade (722 | 14.4%), Manufacturing (575 | 11.5%), and Accommodation & Food Services (531 | 10.6%).
Employment Industries by Sex in Hormigueros Municipio
The Hormigueros Municipio industries that see more men than women are Arts, Entertainment & Recreation (100.0%), Construction (92.5%), and Administrative & Support (90.8%), whereas the industries that tend to have a higher number of women are Utilities (100.0%), Real Estate, Rental & Leasing (90.0%), and Health Care & Social Assistance (78.3%).
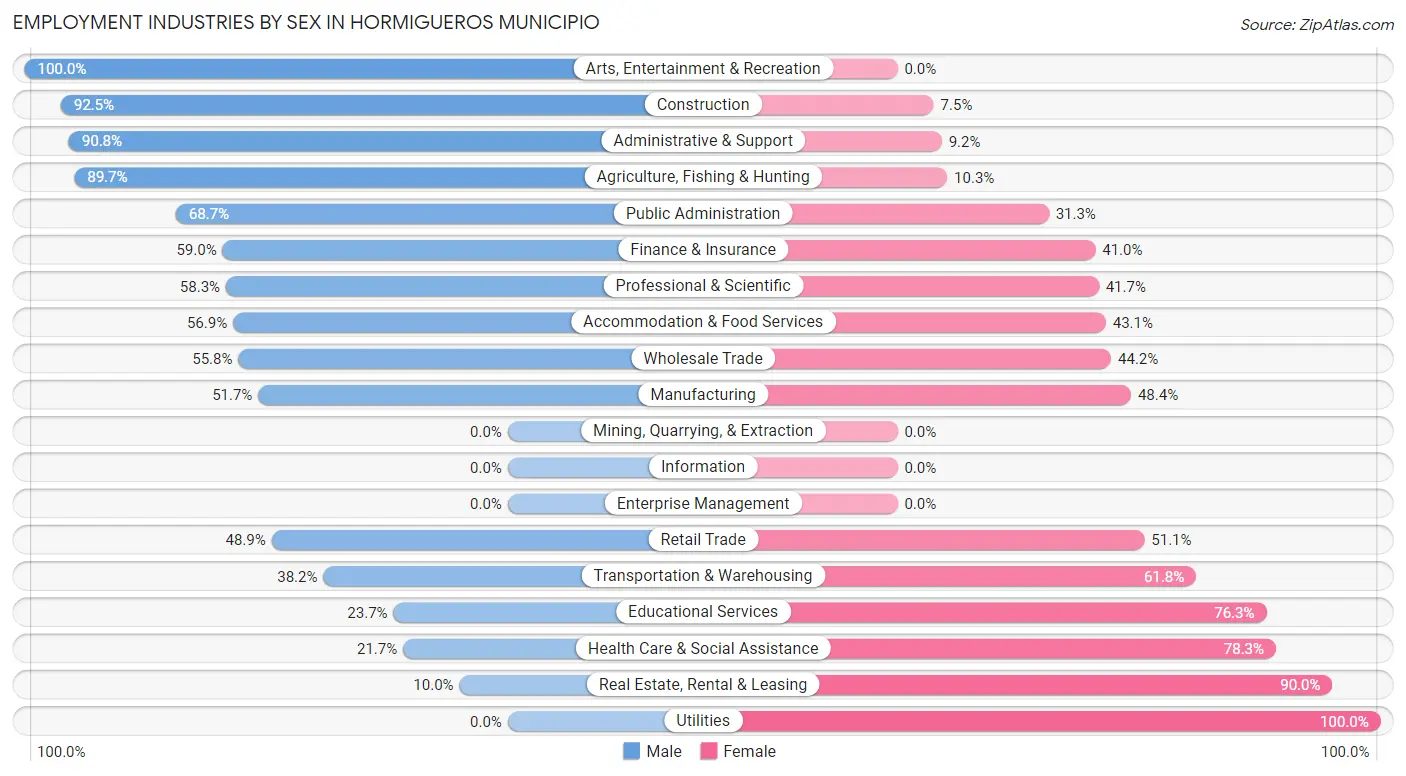
| Industry | Male | Female |
| Agriculture, Fishing & Hunting | 61 (89.7%) | 7 (10.3%) |
| Mining, Quarrying, & Extraction | 0 (0.0%) | 0 (0.0%) |
| Construction | 74 (92.5%) | 6 (7.5%) |
| Manufacturing | 297 (51.6%) | 278 (48.3%) |
| Wholesale Trade | 87 (55.8%) | 69 (44.2%) |
| Retail Trade | 353 (48.9%) | 369 (51.1%) |
| Transportation & Warehousing | 21 (38.2%) | 34 (61.8%) |
| Utilities | 0 (0.0%) | 55 (100.0%) |
| Information | 0 (0.0%) | 0 (0.0%) |
| Finance & Insurance | 98 (59.0%) | 68 (41.0%) |
| Real Estate, Rental & Leasing | 5 (10.0%) | 45 (90.0%) |
| Professional & Scientific | 84 (58.3%) | 60 (41.7%) |
| Enterprise Management | 0 (0.0%) | 0 (0.0%) |
| Administrative & Support | 218 (90.8%) | 22 (9.2%) |
| Educational Services | 177 (23.7%) | 571 (76.3%) |
| Health Care & Social Assistance | 182 (21.7%) | 658 (78.3%) |
| Arts, Entertainment & Recreation | 36 (100.0%) | 0 (0.0%) |
| Accommodation & Food Services | 302 (56.9%) | 229 (43.1%) |
| Public Administration | 272 (68.7%) | 124 (31.3%) |
| Total | 2,352 (47.0%) | 2,650 (53.0%) |
Education in Hormigueros Municipio
School Enrollment in Hormigueros Municipio
The most common levels of schooling among the 3,300 students in Hormigueros Municipio are college / undergraduate (1,151 | 34.9%), middle school (729 | 22.1%), and high school (601 | 18.2%).
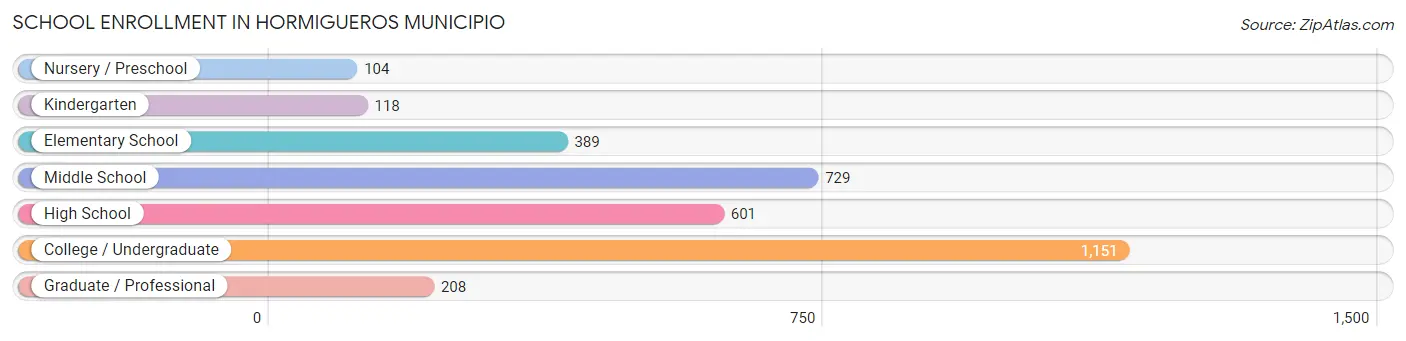
| School Level | # Students | % Students |
| Nursery / Preschool | 104 | 3.2% |
| Kindergarten | 118 | 3.6% |
| Elementary School | 389 | 11.8% |
| Middle School | 729 | 22.1% |
| High School | 601 | 18.2% |
| College / Undergraduate | 1,151 | 34.9% |
| Graduate / Professional | 208 | 6.3% |
| Total | 3,300 | 100.0% |
School Enrollment by Age by Funding Source in Hormigueros Municipio
Out of a total of 3,300 students who are enrolled in schools in Hormigueros Municipio, 1,521 (46.1%) attend a private institution, while the remaining 1,779 (53.9%) are enrolled in public schools. The age group of 25 to 34 year olds has the highest likelihood of being enrolled in private schools, with 110 (89.4% in the age bracket) enrolled. Conversely, the age group of 3 to 4 year olds has the lowest likelihood of being enrolled in a private school, with 99 (95.2% in the age bracket) attending a public institution.
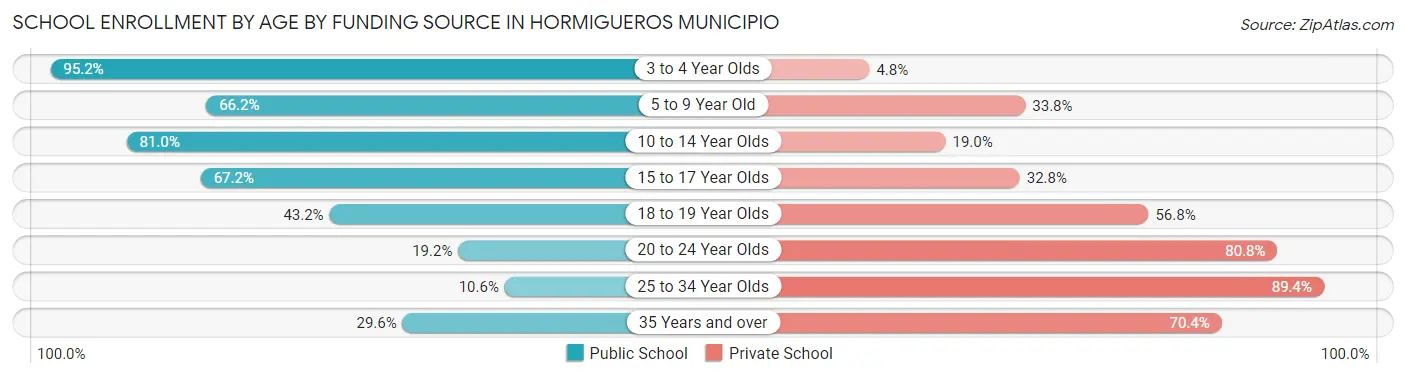
| Age Bracket | Public School | Private School |
| 3 to 4 Year Olds | 99 (95.2%) | 5 (4.8%) |
| 5 to 9 Year Old | 393 (66.2%) | 201 (33.8%) |
| 10 to 14 Year Olds | 619 (81.0%) | 145 (19.0%) |
| 15 to 17 Year Olds | 340 (67.2%) | 166 (32.8%) |
| 18 to 19 Year Olds | 102 (43.2%) | 134 (56.8%) |
| 20 to 24 Year Olds | 139 (19.2%) | 584 (80.8%) |
| 25 to 34 Year Olds | 13 (10.6%) | 110 (89.4%) |
| 35 Years and over | 74 (29.6%) | 176 (70.4%) |
| Total | 1,779 (53.9%) | 1,521 (46.1%) |
Educational Attainment by Field of Study in Hormigueros Municipio
Business (961 | 26.9%), education (711 | 19.9%), arts & humanities (466 | 13.0%), science & technology (396 | 11.1%), and social sciences (299 | 8.4%) are the most common fields of study among 3,576 individuals in Hormigueros Municipio who have obtained a bachelor's degree or higher.
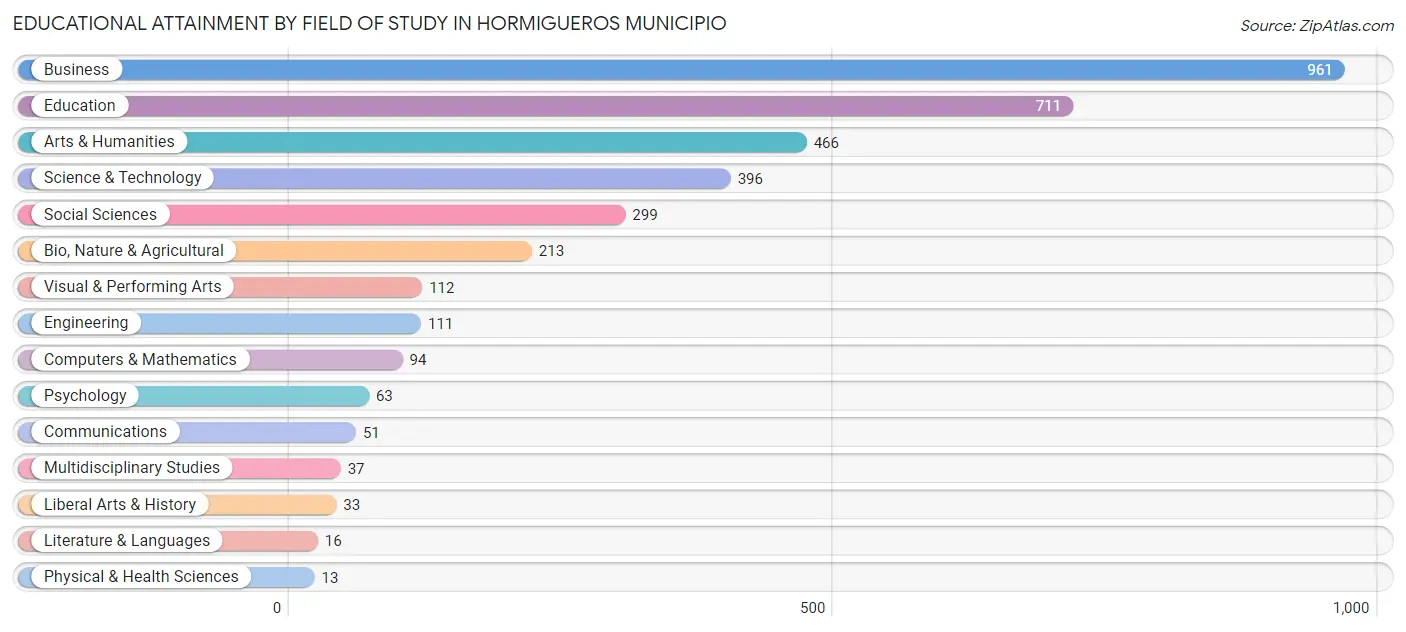
| Field of Study | # Graduates | % Graduates |
| Computers & Mathematics | 94 | 2.6% |
| Bio, Nature & Agricultural | 213 | 6.0% |
| Physical & Health Sciences | 13 | 0.4% |
| Psychology | 63 | 1.8% |
| Social Sciences | 299 | 8.4% |
| Engineering | 111 | 3.1% |
| Multidisciplinary Studies | 37 | 1.0% |
| Science & Technology | 396 | 11.1% |
| Business | 961 | 26.9% |
| Education | 711 | 19.9% |
| Literature & Languages | 16 | 0.4% |
| Liberal Arts & History | 33 | 0.9% |
| Visual & Performing Arts | 112 | 3.1% |
| Communications | 51 | 1.4% |
| Arts & Humanities | 466 | 13.0% |
| Total | 3,576 | 100.0% |
Transportation & Commute in Hormigueros Municipio
Vehicle Availability by Sex in Hormigueros Municipio
The most prevalent vehicle ownership categories in Hormigueros Municipio are males with 2 vehicles (954, accounting for 41.0%) and females with 2 vehicles (989, making up 37.0%).
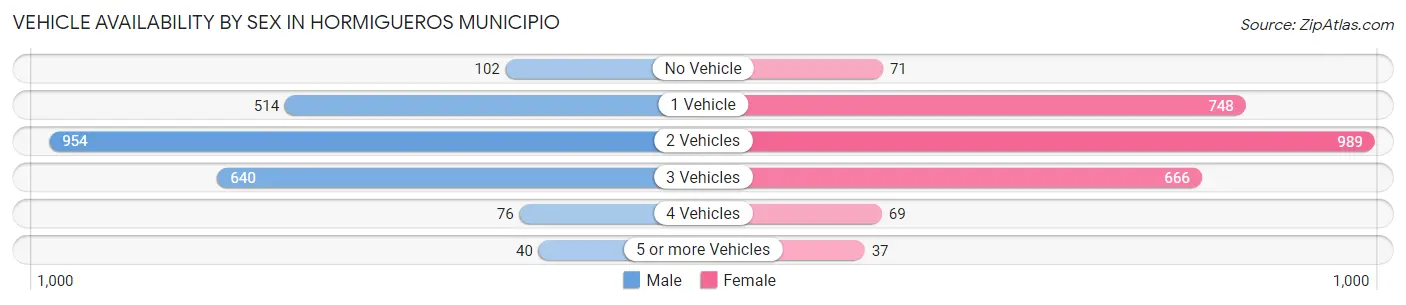
| Vehicles Available | Male | Female |
| No Vehicle | 102 (4.4%) | 71 (2.8%) |
| 1 Vehicle | 514 (22.1%) | 748 (29.0%) |
| 2 Vehicles | 954 (41.0%) | 989 (38.3%) |
| 3 Vehicles | 640 (27.5%) | 666 (25.8%) |
| 4 Vehicles | 76 (3.3%) | 69 (2.7%) |
| 5 or more Vehicles | 40 (1.7%) | 37 (1.4%) |
| Total | 2,326 (100.0%) | 2,580 (100.0%) |
Commute Time in Hormigueros Municipio
The most frequently occuring commute durations in Hormigueros Municipio are 20 to 24 minutes (1,073 commuters, 22.3%), 30 to 34 minutes (895 commuters, 18.6%), and 10 to 14 minutes (743 commuters, 15.4%).
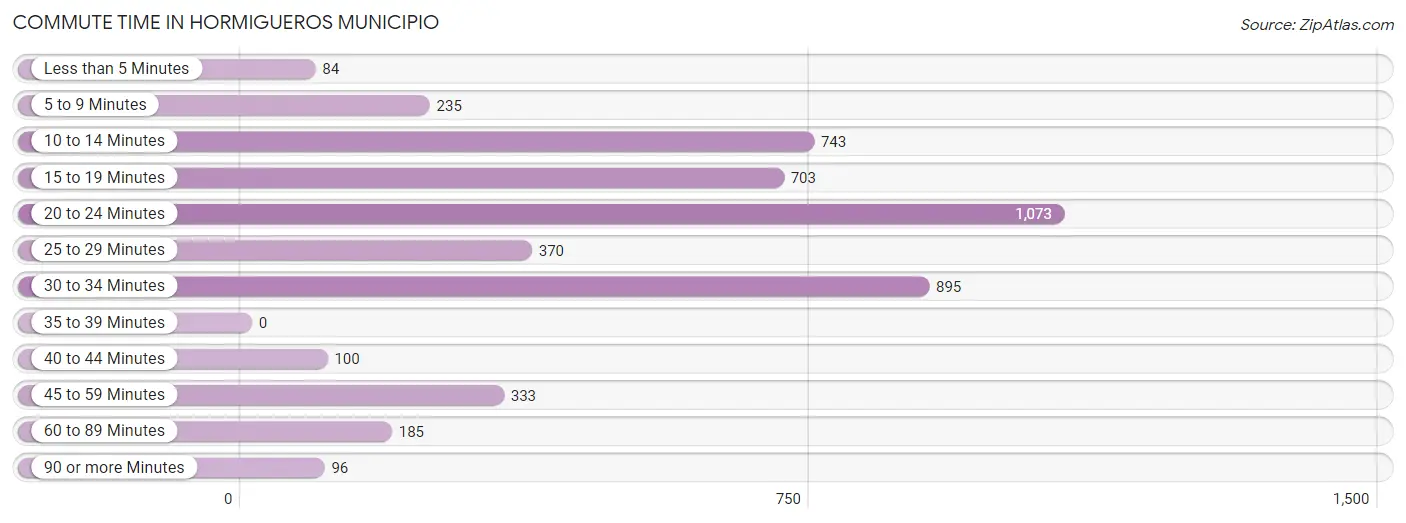
| Commute Time | # Commuters | % Commuters |
| Less than 5 Minutes | 84 | 1.7% |
| 5 to 9 Minutes | 235 | 4.9% |
| 10 to 14 Minutes | 743 | 15.4% |
| 15 to 19 Minutes | 703 | 14.6% |
| 20 to 24 Minutes | 1,073 | 22.3% |
| 25 to 29 Minutes | 370 | 7.7% |
| 30 to 34 Minutes | 895 | 18.6% |
| 35 to 39 Minutes | 0 | 0.0% |
| 40 to 44 Minutes | 100 | 2.1% |
| 45 to 59 Minutes | 333 | 6.9% |
| 60 to 89 Minutes | 185 | 3.8% |
| 90 or more Minutes | 96 | 2.0% |
Commute Time by Sex in Hormigueros Municipio
The most common commute times in Hormigueros Municipio are 10 to 14 minutes (431 commuters, 18.8%) for males and 20 to 24 minutes (661 commuters, 26.2%) for females.
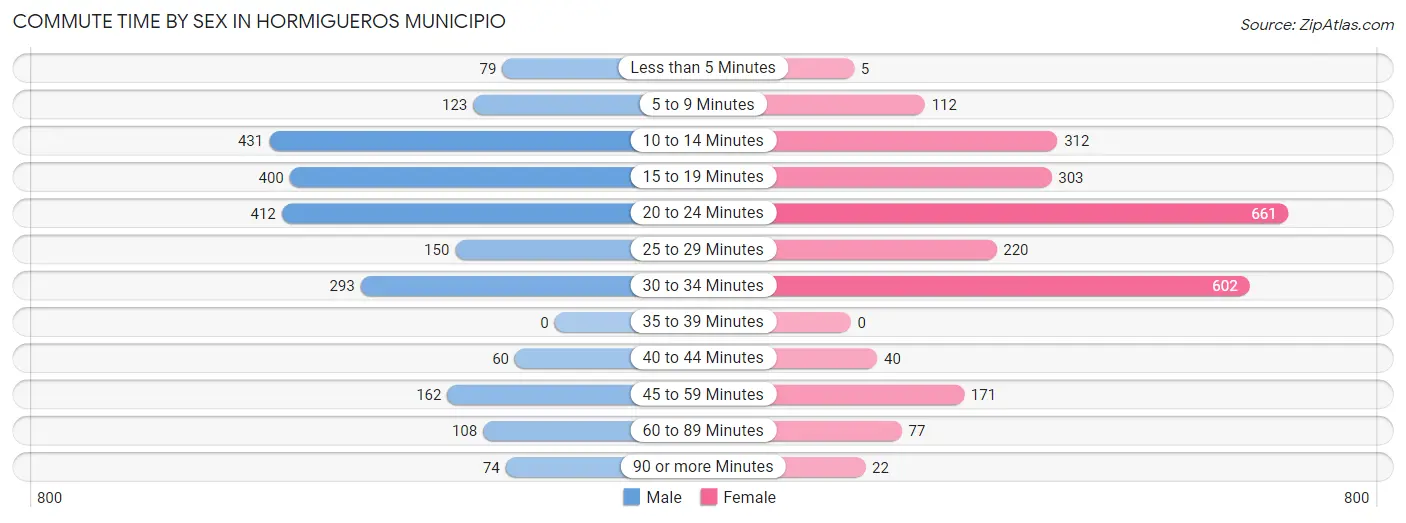
| Commute Time | Male | Female |
| Less than 5 Minutes | 79 (3.5%) | 5 (0.2%) |
| 5 to 9 Minutes | 123 (5.4%) | 112 (4.4%) |
| 10 to 14 Minutes | 431 (18.8%) | 312 (12.4%) |
| 15 to 19 Minutes | 400 (17.4%) | 303 (12.0%) |
| 20 to 24 Minutes | 412 (18.0%) | 661 (26.2%) |
| 25 to 29 Minutes | 150 (6.5%) | 220 (8.7%) |
| 30 to 34 Minutes | 293 (12.8%) | 602 (23.8%) |
| 35 to 39 Minutes | 0 (0.0%) | 0 (0.0%) |
| 40 to 44 Minutes | 60 (2.6%) | 40 (1.6%) |
| 45 to 59 Minutes | 162 (7.1%) | 171 (6.8%) |
| 60 to 89 Minutes | 108 (4.7%) | 77 (3.0%) |
| 90 or more Minutes | 74 (3.2%) | 22 (0.9%) |
Time of Departure to Work by Sex in Hormigueros Municipio
The most frequent times of departure to work in Hormigueros Municipio are 7:00 AM to 7:29 AM (430, 18.8%) for males and 7:30 AM to 7:59 AM (487, 19.3%) for females.
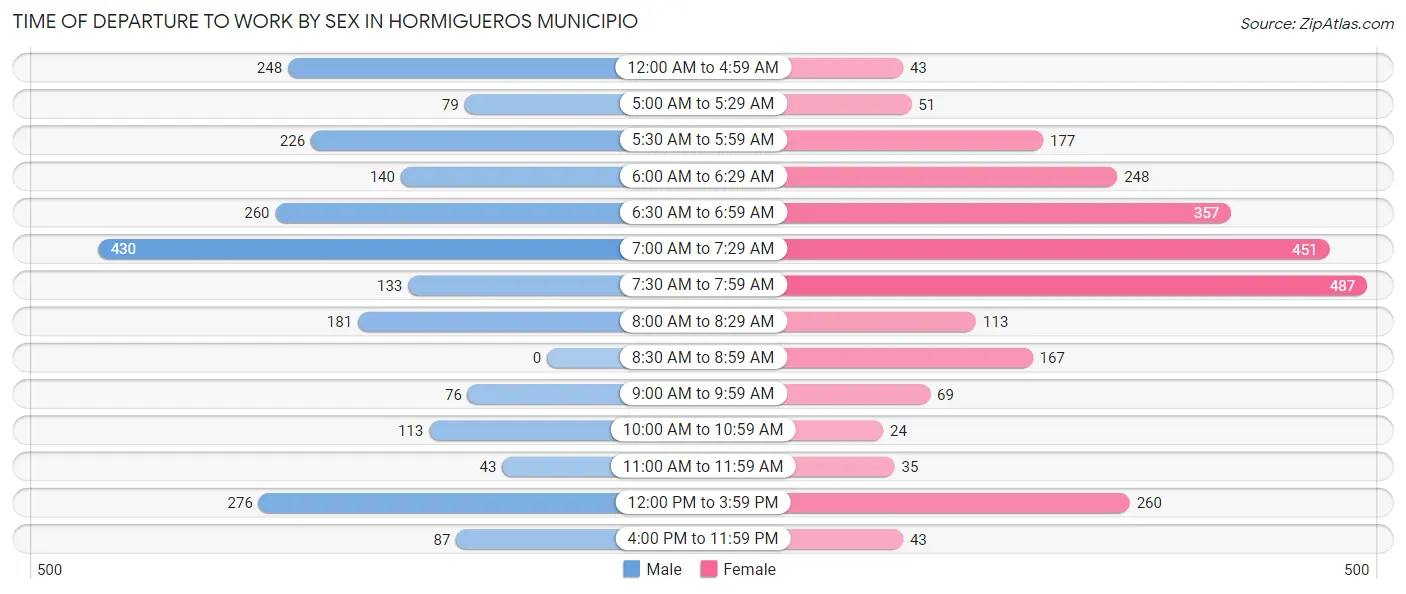
| Time of Departure | Male | Female |
| 12:00 AM to 4:59 AM | 248 (10.8%) | 43 (1.7%) |
| 5:00 AM to 5:29 AM | 79 (3.5%) | 51 (2.0%) |
| 5:30 AM to 5:59 AM | 226 (9.9%) | 177 (7.0%) |
| 6:00 AM to 6:29 AM | 140 (6.1%) | 248 (9.8%) |
| 6:30 AM to 6:59 AM | 260 (11.3%) | 357 (14.1%) |
| 7:00 AM to 7:29 AM | 430 (18.8%) | 451 (17.9%) |
| 7:30 AM to 7:59 AM | 133 (5.8%) | 487 (19.3%) |
| 8:00 AM to 8:29 AM | 181 (7.9%) | 113 (4.5%) |
| 8:30 AM to 8:59 AM | 0 (0.0%) | 167 (6.6%) |
| 9:00 AM to 9:59 AM | 76 (3.3%) | 69 (2.7%) |
| 10:00 AM to 10:59 AM | 113 (4.9%) | 24 (0.9%) |
| 11:00 AM to 11:59 AM | 43 (1.9%) | 35 (1.4%) |
| 12:00 PM to 3:59 PM | 276 (12.0%) | 260 (10.3%) |
| 4:00 PM to 11:59 PM | 87 (3.8%) | 43 (1.7%) |
| Total | 2,292 (100.0%) | 2,525 (100.0%) |
Housing Occupancy in Hormigueros Municipio
Occupancy by Ownership in Hormigueros Municipio
Of the total 6,139 dwellings in Hormigueros Municipio, owner-occupied units account for 4,332 (70.6%), while renter-occupied units make up 1,807 (29.4%).
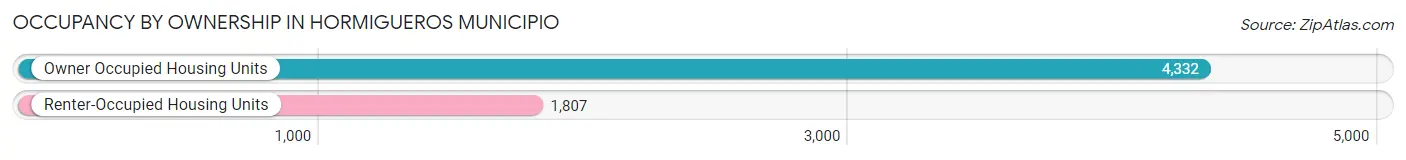
| Occupancy | # Housing Units | % Housing Units |
| Owner Occupied Housing Units | 4,332 | 70.6% |
| Renter-Occupied Housing Units | 1,807 | 29.4% |
| Total Occupied Housing Units | 6,139 | 100.0% |
Occupancy by Household Size in Hormigueros Municipio
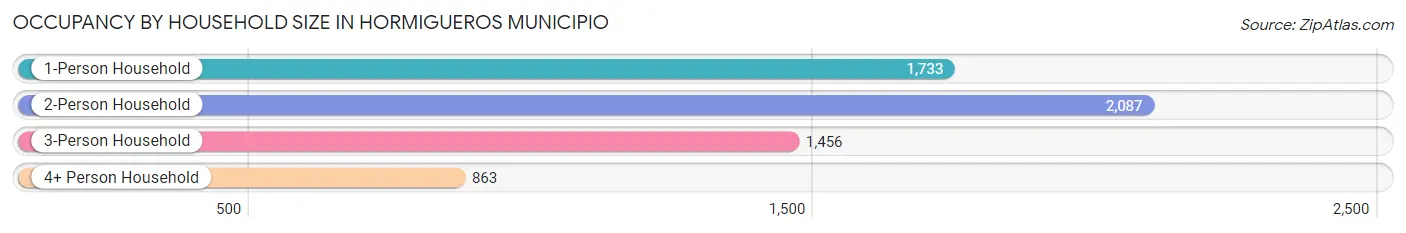
| Household Size | # Housing Units | % Housing Units |
| 1-Person Household | 1,733 | 28.2% |
| 2-Person Household | 2,087 | 34.0% |
| 3-Person Household | 1,456 | 23.7% |
| 4+ Person Household | 863 | 14.1% |
| Total Housing Units | 6,139 | 100.0% |
Occupancy by Ownership by Household Size in Hormigueros Municipio
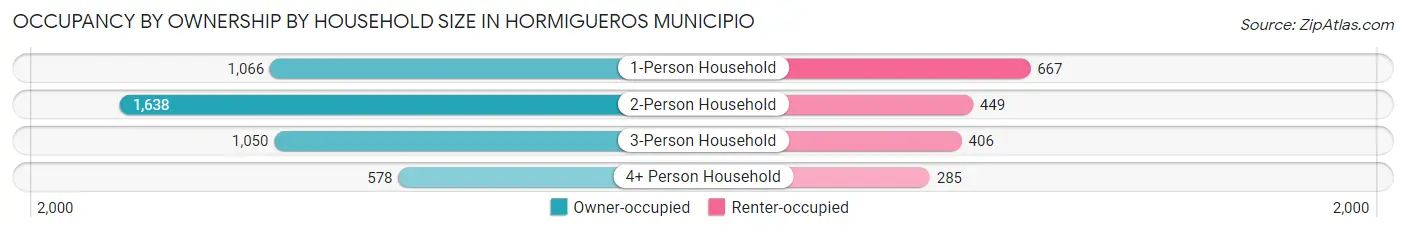
| Household Size | Owner-occupied | Renter-occupied |
| 1-Person Household | 1,066 (61.5%) | 667 (38.5%) |
| 2-Person Household | 1,638 (78.5%) | 449 (21.5%) |
| 3-Person Household | 1,050 (72.1%) | 406 (27.9%) |
| 4+ Person Household | 578 (67.0%) | 285 (33.0%) |
| Total Housing Units | 4,332 (70.6%) | 1,807 (29.4%) |
Occupancy by Educational Attainment in Hormigueros Municipio
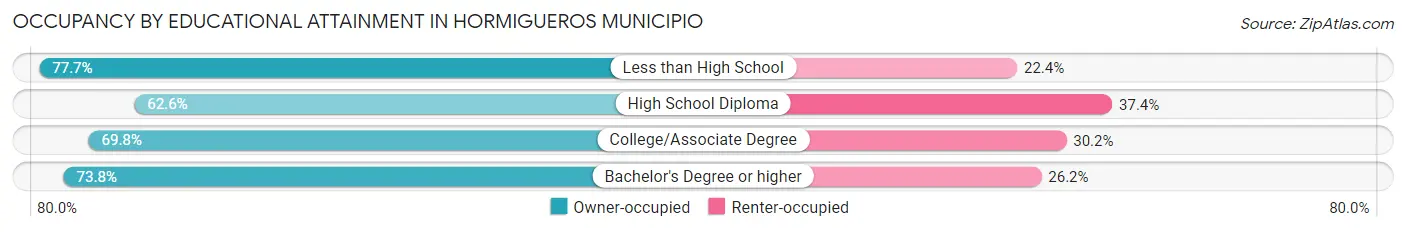
| Household Size | Owner-occupied | Renter-occupied |
| Less than High School | 945 (77.6%) | 272 (22.4%) |
| High School Diploma | 1,087 (62.6%) | 650 (37.4%) |
| College/Associate Degree | 889 (69.8%) | 384 (30.2%) |
| Bachelor's Degree or higher | 1,411 (73.8%) | 501 (26.2%) |
Occupancy by Age of Householder in Hormigueros Municipio
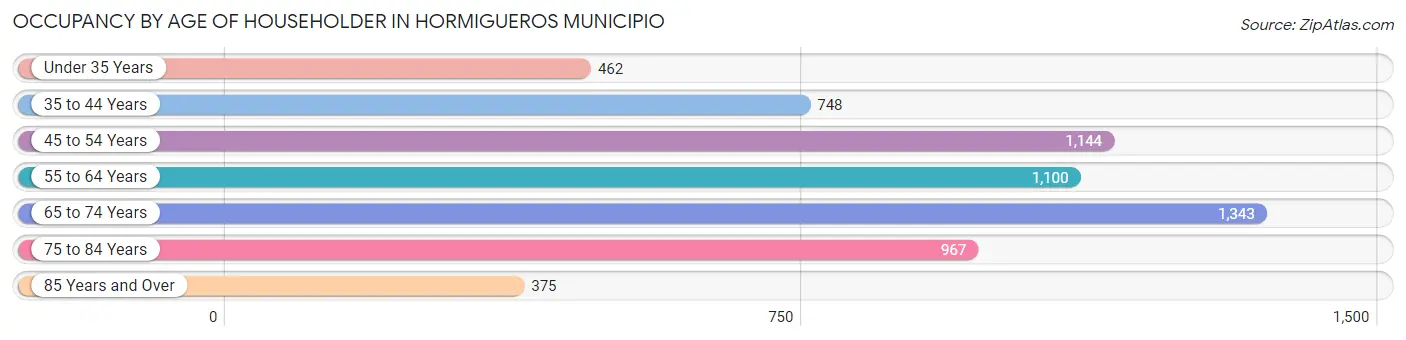
| Age Bracket | # Households | % Households |
| Under 35 Years | 462 | 7.5% |
| 35 to 44 Years | 748 | 12.2% |
| 45 to 54 Years | 1,144 | 18.6% |
| 55 to 64 Years | 1,100 | 17.9% |
| 65 to 74 Years | 1,343 | 21.9% |
| 75 to 84 Years | 967 | 15.8% |
| 85 Years and Over | 375 | 6.1% |
| Total | 6,139 | 100.0% |
Housing Finances in Hormigueros Municipio
Median Income by Occupancy in Hormigueros Municipio
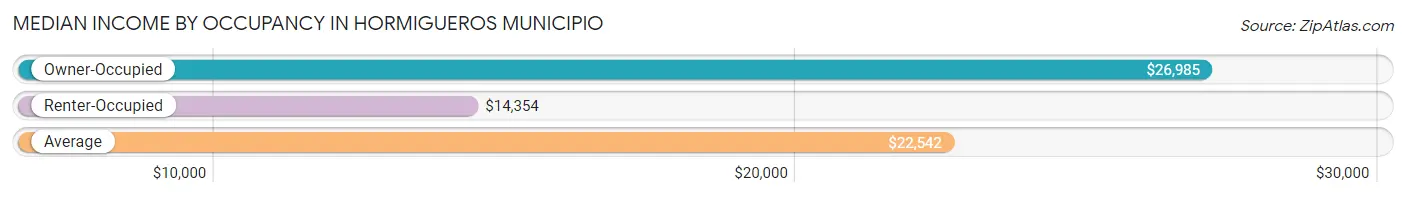
| Occupancy Type | # Households | Median Income |
| Owner-Occupied | 4,332 (70.6%) | $26,985 |
| Renter-Occupied | 1,807 (29.4%) | $14,354 |
| Average | 6,139 (100.0%) | $22,542 |
Occupancy by Householder Income Bracket in Hormigueros Municipio
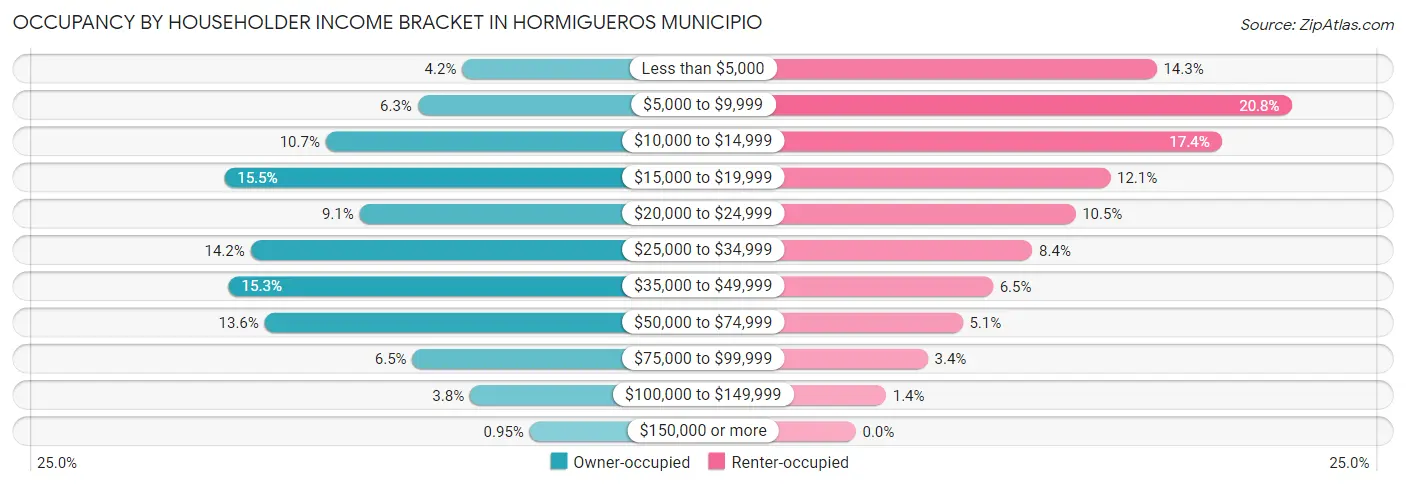
| Income Bracket | Owner-occupied | Renter-occupied |
| Less than $5,000 | 180 (4.2%) | 259 (14.3%) |
| $5,000 to $9,999 | 272 (6.3%) | 375 (20.7%) |
| $10,000 to $14,999 | 462 (10.7%) | 315 (17.4%) |
| $15,000 to $19,999 | 671 (15.5%) | 219 (12.1%) |
| $20,000 to $24,999 | 392 (9.0%) | 189 (10.5%) |
| $25,000 to $34,999 | 617 (14.2%) | 152 (8.4%) |
| $35,000 to $49,999 | 662 (15.3%) | 118 (6.5%) |
| $50,000 to $74,999 | 588 (13.6%) | 92 (5.1%) |
| $75,000 to $99,999 | 283 (6.5%) | 62 (3.4%) |
| $100,000 to $149,999 | 164 (3.8%) | 26 (1.4%) |
| $150,000 or more | 41 (0.9%) | 0 (0.0%) |
| Total | 4,332 (100.0%) | 1,807 (100.0%) |
Monthly Housing Cost Tiers in Hormigueros Municipio
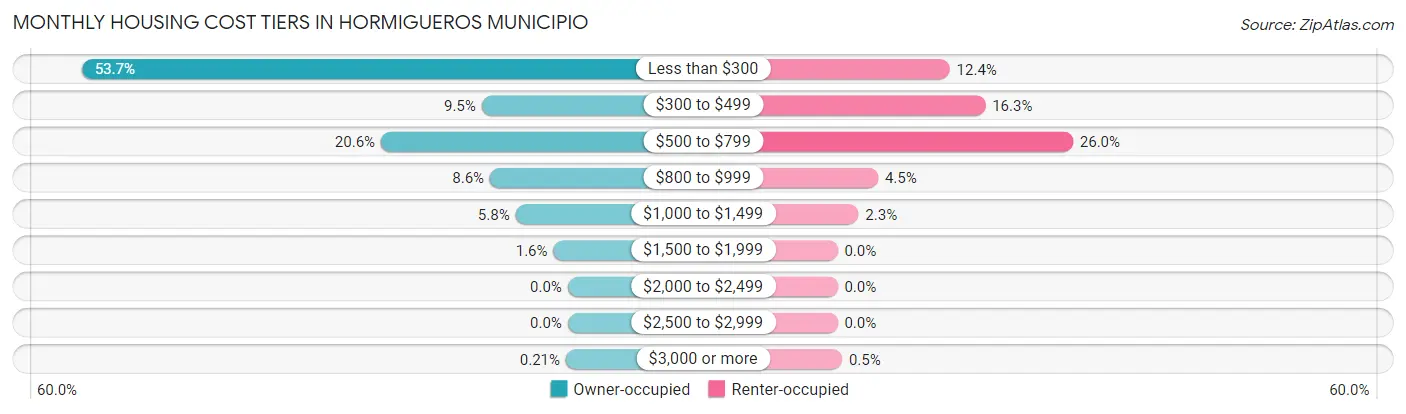
| Monthly Cost | Owner-occupied | Renter-occupied |
| Less than $300 | 2,326 (53.7%) | 224 (12.4%) |
| $300 to $499 | 412 (9.5%) | 295 (16.3%) |
| $500 to $799 | 894 (20.6%) | 470 (26.0%) |
| $800 to $999 | 372 (8.6%) | 81 (4.5%) |
| $1,000 to $1,499 | 250 (5.8%) | 42 (2.3%) |
| $1,500 to $1,999 | 69 (1.6%) | 0 (0.0%) |
| $2,000 to $2,499 | 0 (0.0%) | 0 (0.0%) |
| $2,500 to $2,999 | 0 (0.0%) | 0 (0.0%) |
| $3,000 or more | 9 (0.2%) | 9 (0.5%) |
| Total | 4,332 (100.0%) | 1,807 (100.0%) |
Physical Housing Characteristics in Hormigueros Municipio
Housing Structures in Hormigueros Municipio
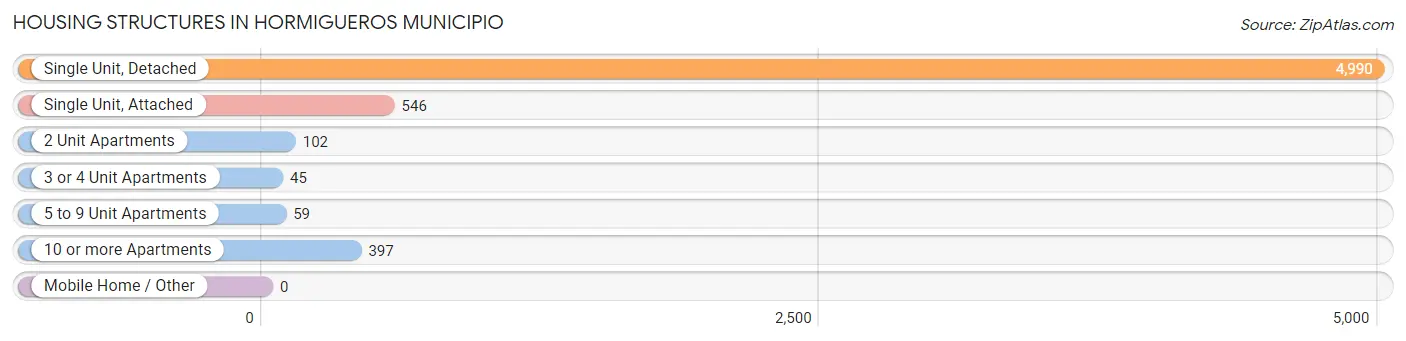
| Structure Type | # Housing Units | % Housing Units |
| Single Unit, Detached | 4,990 | 81.3% |
| Single Unit, Attached | 546 | 8.9% |
| 2 Unit Apartments | 102 | 1.7% |
| 3 or 4 Unit Apartments | 45 | 0.7% |
| 5 to 9 Unit Apartments | 59 | 1.0% |
| 10 or more Apartments | 397 | 6.5% |
| Mobile Home / Other | 0 | 0.0% |
| Total | 6,139 | 100.0% |
Housing Structures by Occupancy in Hormigueros Municipio
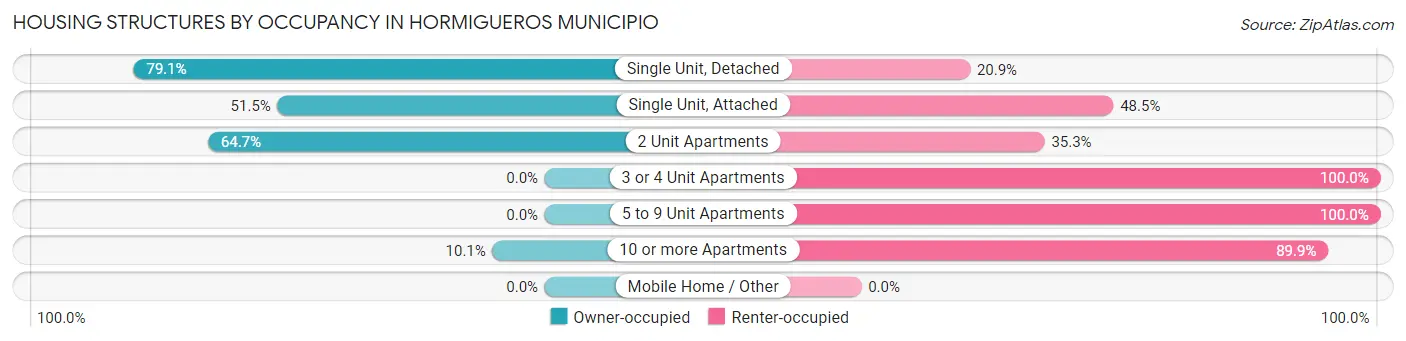
| Structure Type | Owner-occupied | Renter-occupied |
| Single Unit, Detached | 3,945 (79.1%) | 1,045 (20.9%) |
| Single Unit, Attached | 281 (51.5%) | 265 (48.5%) |
| 2 Unit Apartments | 66 (64.7%) | 36 (35.3%) |
| 3 or 4 Unit Apartments | 0 (0.0%) | 45 (100.0%) |
| 5 to 9 Unit Apartments | 0 (0.0%) | 59 (100.0%) |
| 10 or more Apartments | 40 (10.1%) | 357 (89.9%) |
| Mobile Home / Other | 0 (0.0%) | 0 (0.0%) |
| Total | 4,332 (70.6%) | 1,807 (29.4%) |
Housing Structures by Number of Rooms in Hormigueros Municipio
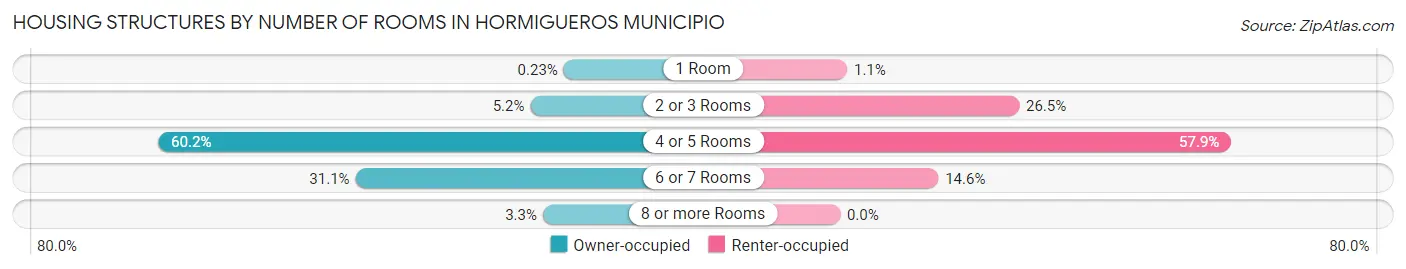
| Number of Rooms | Owner-occupied | Renter-occupied |
| 1 Room | 10 (0.2%) | 19 (1.1%) |
| 2 or 3 Rooms | 224 (5.2%) | 479 (26.5%) |
| 4 or 5 Rooms | 2,609 (60.2%) | 1,046 (57.9%) |
| 6 or 7 Rooms | 1,345 (31.0%) | 263 (14.5%) |
| 8 or more Rooms | 144 (3.3%) | 0 (0.0%) |
| Total | 4,332 (100.0%) | 1,807 (100.0%) |
Housing Structure by Heating Type in Hormigueros Municipio
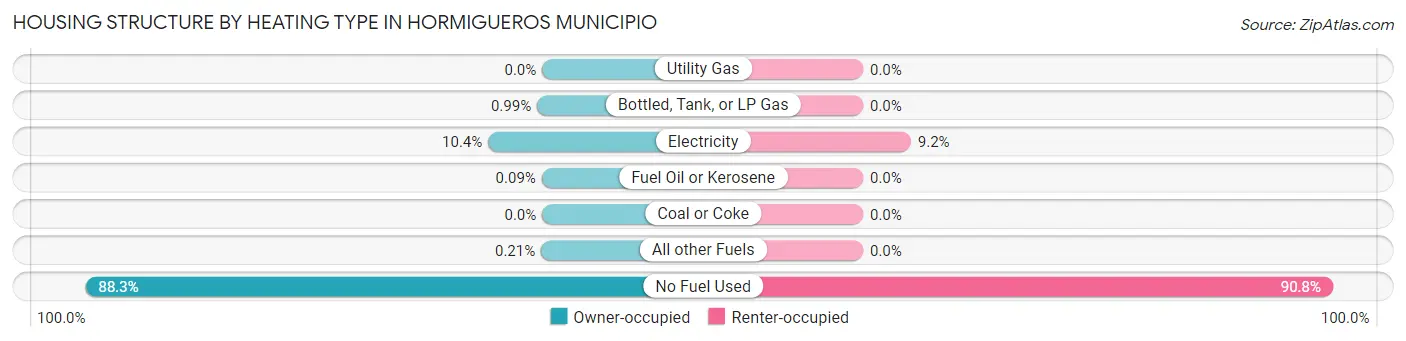
| Heating Type | Owner-occupied | Renter-occupied |
| Utility Gas | 0 (0.0%) | 0 (0.0%) |
| Bottled, Tank, or LP Gas | 43 (1.0%) | 0 (0.0%) |
| Electricity | 452 (10.4%) | 167 (9.2%) |
| Fuel Oil or Kerosene | 4 (0.1%) | 0 (0.0%) |
| Coal or Coke | 0 (0.0%) | 0 (0.0%) |
| All other Fuels | 9 (0.2%) | 0 (0.0%) |
| No Fuel Used | 3,824 (88.3%) | 1,640 (90.8%) |
| Total | 4,332 (100.0%) | 1,807 (100.0%) |
Household Vehicle Usage in Hormigueros Municipio
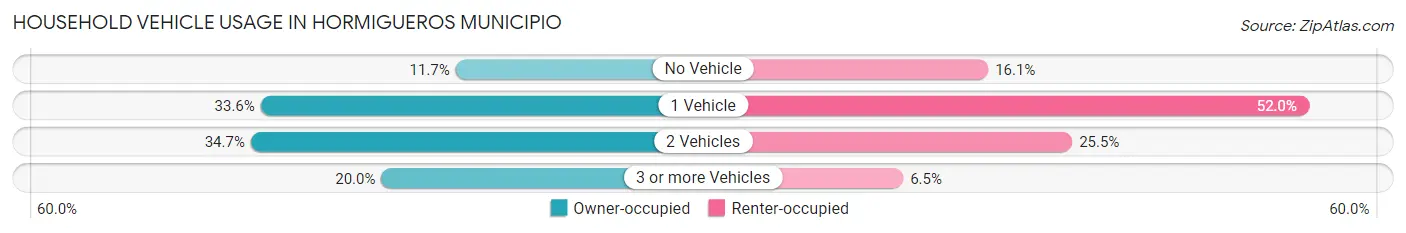
| Vehicles per Household | Owner-occupied | Renter-occupied |
| No Vehicle | 508 (11.7%) | 290 (16.1%) |
| 1 Vehicle | 1,454 (33.6%) | 939 (52.0%) |
| 2 Vehicles | 1,502 (34.7%) | 460 (25.5%) |
| 3 or more Vehicles | 868 (20.0%) | 118 (6.5%) |
| Total | 4,332 (100.0%) | 1,807 (100.0%) |
Real Estate & Mortgages in Hormigueros Municipio
Real Estate and Mortgage Overview in Hormigueros Municipio
| Characteristic | Without Mortgage | With Mortgage |
| Housing Units | 2,662 | 1,670 |
| Median Property Value | $104,500 | $123,400 |
| Median Household Income | $21,565 | $16 |
| Monthly Housing Costs | $178 | $4 |
| Real Estate Taxes | $351 | $1,430 |
Property Value by Mortgage Status in Hormigueros Municipio
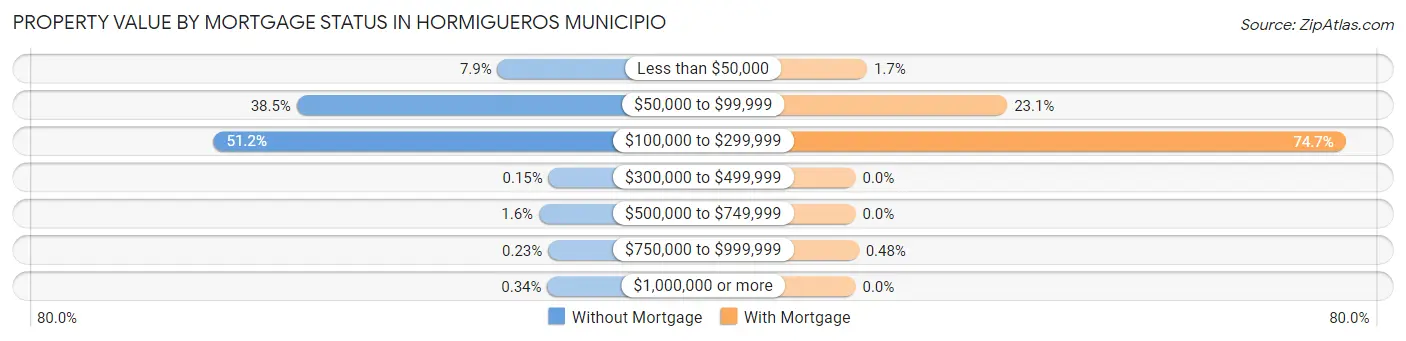
| Property Value | Without Mortgage | With Mortgage |
| Less than $50,000 | 211 (7.9%) | 29 (1.7%) |
| $50,000 to $99,999 | 1,026 (38.5%) | 386 (23.1%) |
| $100,000 to $299,999 | 1,363 (51.2%) | 1,247 (74.7%) |
| $300,000 to $499,999 | 4 (0.2%) | 0 (0.0%) |
| $500,000 to $749,999 | 43 (1.6%) | 0 (0.0%) |
| $750,000 to $999,999 | 6 (0.2%) | 8 (0.5%) |
| $1,000,000 or more | 9 (0.3%) | 0 (0.0%) |
| Total | 2,662 (100.0%) | 1,670 (100.0%) |
Household Income by Mortgage Status in Hormigueros Municipio
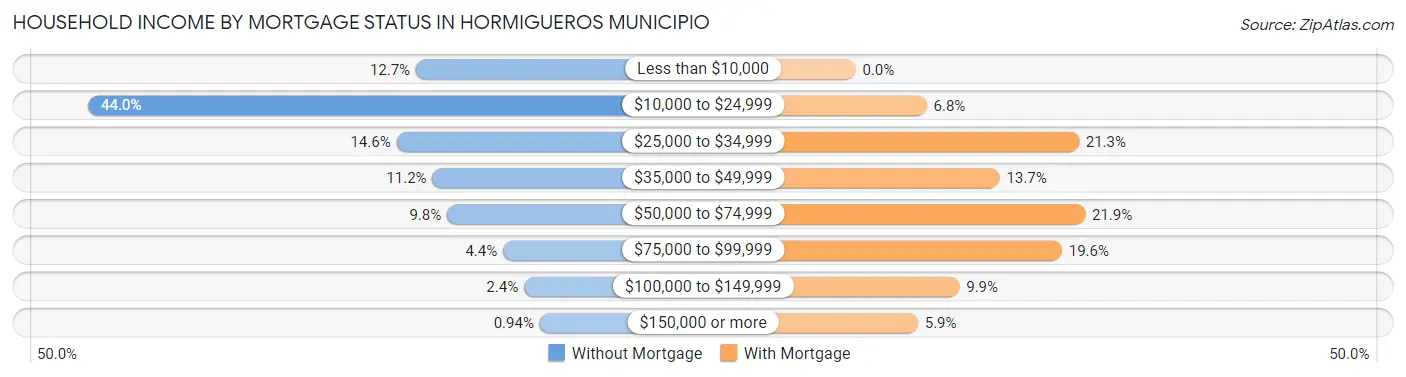
| Household Income | Without Mortgage | With Mortgage |
| Less than $10,000 | 339 (12.7%) | 0 (0.0%) |
| $10,000 to $24,999 | 1,170 (44.0%) | 113 (6.8%) |
| $25,000 to $34,999 | 388 (14.6%) | 355 (21.3%) |
| $35,000 to $49,999 | 297 (11.2%) | 229 (13.7%) |
| $50,000 to $74,999 | 260 (9.8%) | 365 (21.9%) |
| $75,000 to $99,999 | 118 (4.4%) | 328 (19.6%) |
| $100,000 to $149,999 | 65 (2.4%) | 165 (9.9%) |
| $150,000 or more | 25 (0.9%) | 99 (5.9%) |
| Total | 2,662 (100.0%) | 1,670 (100.0%) |
Property Value to Household Income Ratio in Hormigueros Municipio
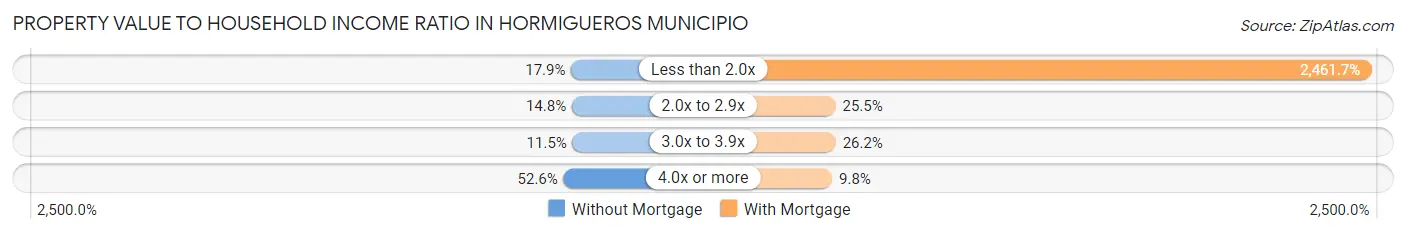
| Value-to-Income Ratio | Without Mortgage | With Mortgage |
| Less than 2.0x | 477 (17.9%) | 41,111 (2,461.7%) |
| 2.0x to 2.9x | 393 (14.8%) | 425 (25.5%) |
| 3.0x to 3.9x | 307 (11.5%) | 437 (26.2%) |
| 4.0x or more | 1,400 (52.6%) | 164 (9.8%) |
| Total | 2,662 (100.0%) | 1,670 (100.0%) |
Real Estate Taxes by Mortgage Status in Hormigueros Municipio
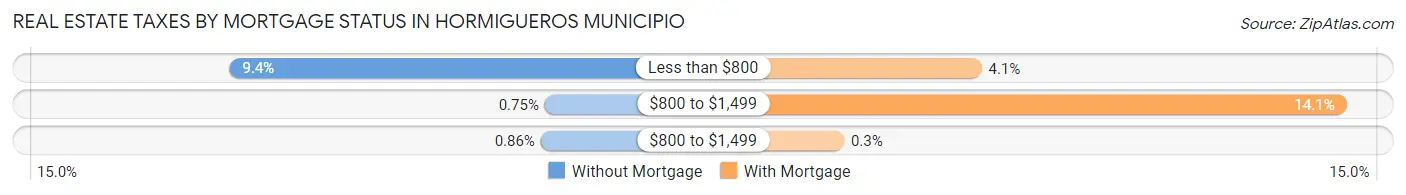
| Property Taxes | Without Mortgage | With Mortgage |
| Less than $800 | 250 (9.4%) | 68 (4.1%) |
| $800 to $1,499 | 20 (0.7%) | 235 (14.1%) |
| $800 to $1,499 | 23 (0.9%) | 5 (0.3%) |
| Total | 2,662 (100.0%) | 1,670 (100.0%) |
Health & Disability in Hormigueros Municipio
Health Insurance Coverage by Age in Hormigueros Municipio
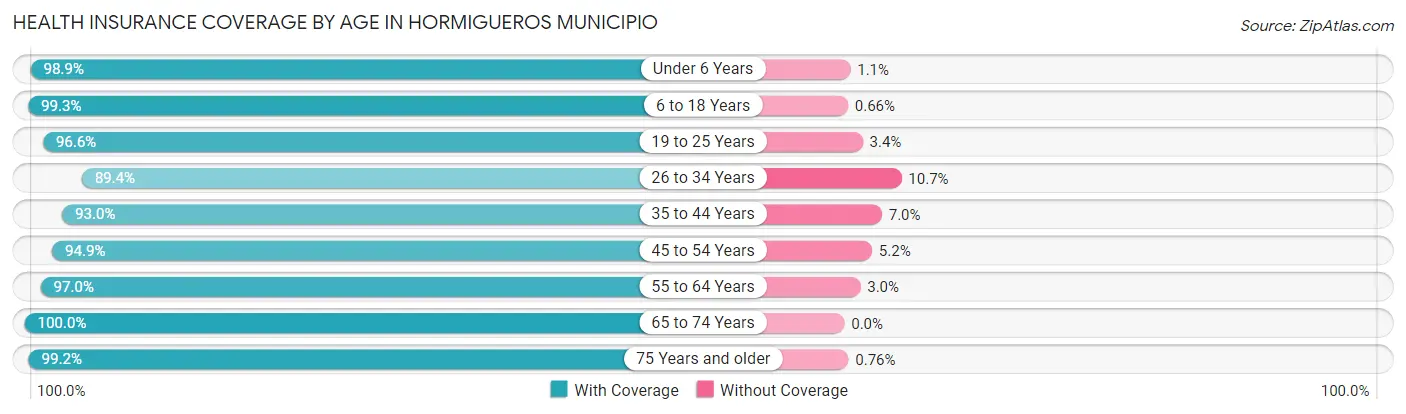
| Age Bracket | With Coverage | Without Coverage |
| Under 6 Years | 532 (98.9%) | 6 (1.1%) |
| 6 to 18 Years | 1,810 (99.3%) | 12 (0.7%) |
| 19 to 25 Years | 1,440 (96.6%) | 51 (3.4%) |
| 26 to 34 Years | 1,225 (89.3%) | 146 (10.6%) |
| 35 to 44 Years | 1,571 (93.0%) | 118 (7.0%) |
| 45 to 54 Years | 1,972 (94.9%) | 107 (5.1%) |
| 55 to 64 Years | 1,952 (97.0%) | 60 (3.0%) |
| 65 to 74 Years | 2,102 (100.0%) | 0 (0.0%) |
| 75 Years and older | 2,349 (99.2%) | 18 (0.8%) |
| Total | 14,953 (96.7%) | 518 (3.4%) |
Health Insurance Coverage by Citizenship Status in Hormigueros Municipio
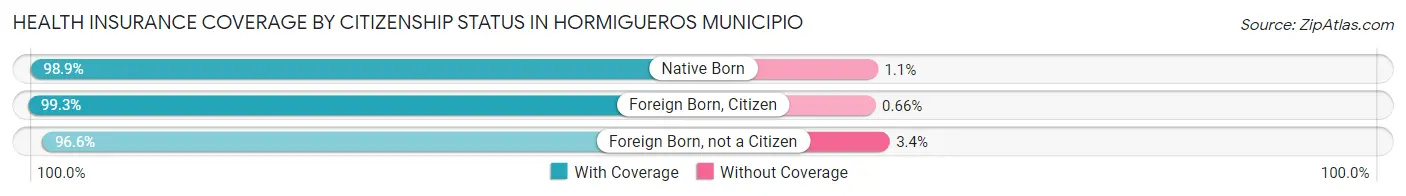
| Citizenship Status | With Coverage | Without Coverage |
| Native Born | 532 (98.9%) | 6 (1.1%) |
| Foreign Born, Citizen | 1,810 (99.3%) | 12 (0.7%) |
| Foreign Born, not a Citizen | 1,440 (96.6%) | 51 (3.4%) |
Health Insurance Coverage by Household Income in Hormigueros Municipio
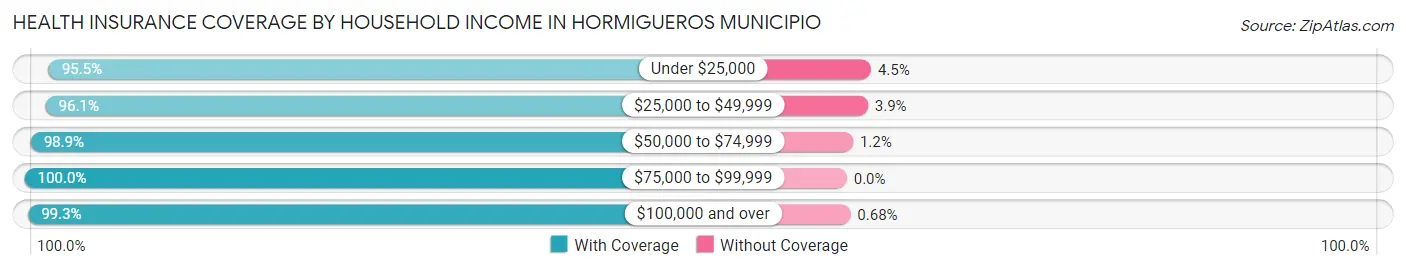
| Household Income | With Coverage | Without Coverage |
| Under $25,000 | 6,810 (95.5%) | 323 (4.5%) |
| $25,000 to $49,999 | 4,042 (96.1%) | 166 (3.9%) |
| $50,000 to $74,999 | 1,970 (98.9%) | 23 (1.1%) |
| $75,000 to $99,999 | 1,180 (100.0%) | 0 (0.0%) |
| $100,000 and over | 873 (99.3%) | 6 (0.7%) |
Public vs Private Health Insurance Coverage by Age in Hormigueros Municipio
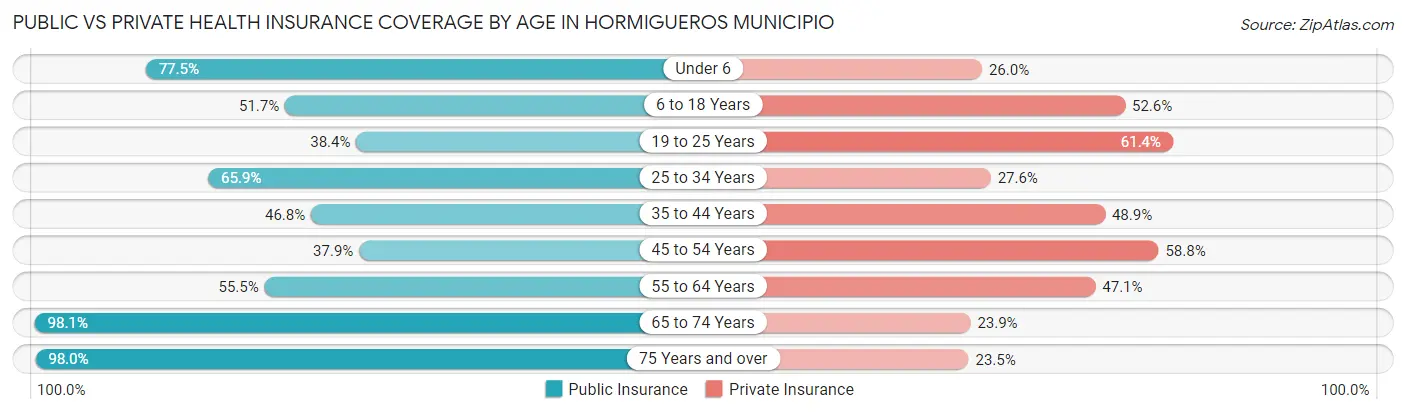
| Age Bracket | Public Insurance | Private Insurance |
| Under 6 | 417 (77.5%) | 140 (26.0%) |
| 6 to 18 Years | 941 (51.6%) | 958 (52.6%) |
| 19 to 25 Years | 573 (38.4%) | 916 (61.4%) |
| 25 to 34 Years | 904 (65.9%) | 379 (27.6%) |
| 35 to 44 Years | 791 (46.8%) | 825 (48.8%) |
| 45 to 54 Years | 788 (37.9%) | 1,222 (58.8%) |
| 55 to 64 Years | 1,116 (55.5%) | 947 (47.1%) |
| 65 to 74 Years | 2,063 (98.1%) | 502 (23.9%) |
| 75 Years and over | 2,320 (98.0%) | 557 (23.5%) |
| Total | 9,913 (64.1%) | 6,446 (41.7%) |
Disability Status by Sex by Age in Hormigueros Municipio
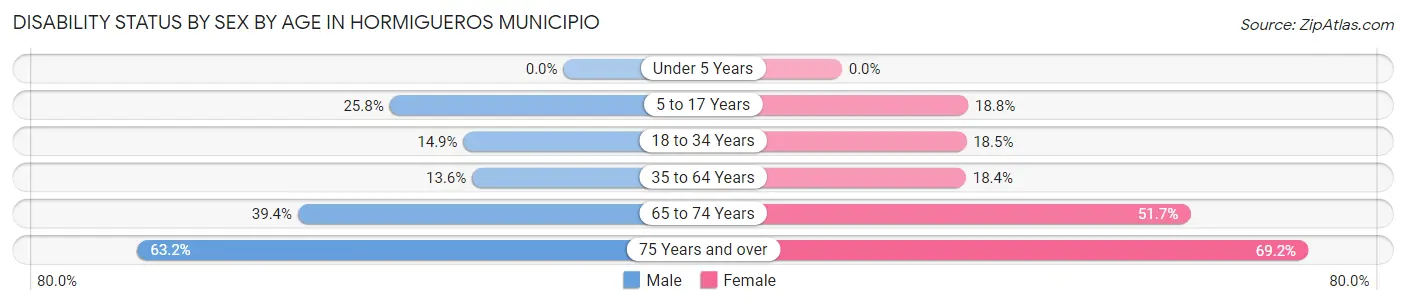
| Age Bracket | Male | Female |
| Under 5 Years | 0 (0.0%) | 0 (0.0%) |
| 5 to 17 Years | 243 (25.8%) | 177 (18.8%) |
| 18 to 34 Years | 217 (14.8%) | 273 (18.5%) |
| 35 to 64 Years | 354 (13.6%) | 583 (18.4%) |
| 65 to 74 Years | 365 (39.4%) | 608 (51.7%) |
| 75 Years and over | 585 (63.2%) | 998 (69.2%) |
Disability Class by Sex by Age in Hormigueros Municipio
Disability Class: Hearing Difficulty
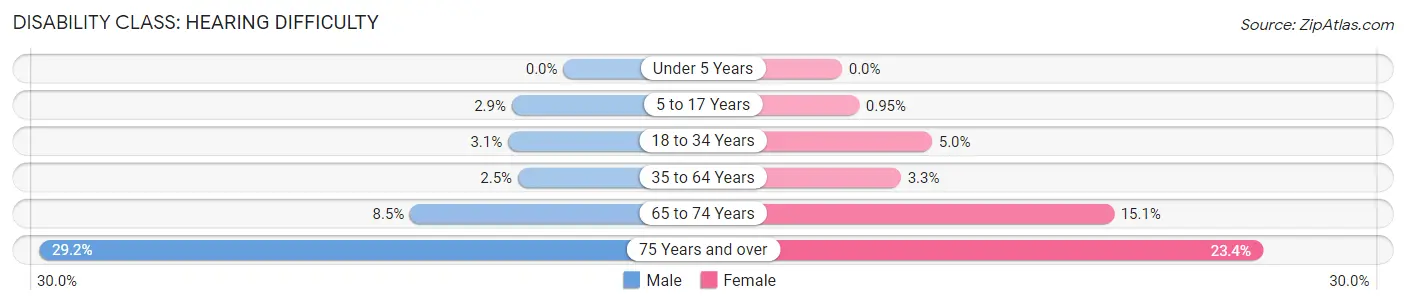
| Age Bracket | Male | Female |
| Under 5 Years | 0 (0.0%) | 0 (0.0%) |
| 5 to 17 Years | 27 (2.9%) | 9 (0.9%) |
| 18 to 34 Years | 45 (3.1%) | 74 (5.0%) |
| 35 to 64 Years | 66 (2.5%) | 104 (3.3%) |
| 65 to 74 Years | 79 (8.5%) | 178 (15.1%) |
| 75 Years and over | 270 (29.2%) | 338 (23.4%) |
Disability Class: Vision Difficulty
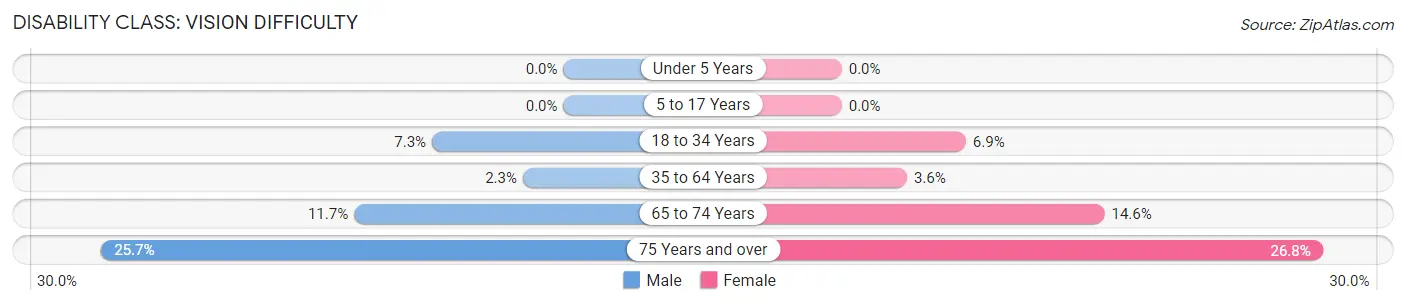
| Age Bracket | Male | Female |
| Under 5 Years | 0 (0.0%) | 0 (0.0%) |
| 5 to 17 Years | 0 (0.0%) | 0 (0.0%) |
| 18 to 34 Years | 107 (7.3%) | 102 (6.9%) |
| 35 to 64 Years | 59 (2.3%) | 115 (3.6%) |
| 65 to 74 Years | 108 (11.7%) | 172 (14.6%) |
| 75 Years and over | 238 (25.7%) | 386 (26.8%) |
Disability Class: Cognitive Difficulty
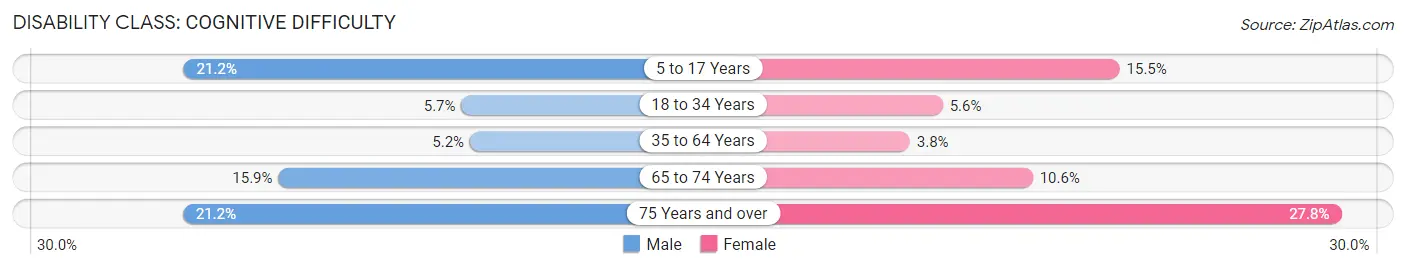
| Age Bracket | Male | Female |
| 5 to 17 Years | 199 (21.1%) | 146 (15.5%) |
| 18 to 34 Years | 83 (5.7%) | 83 (5.6%) |
| 35 to 64 Years | 136 (5.2%) | 120 (3.8%) |
| 65 to 74 Years | 147 (15.9%) | 125 (10.6%) |
| 75 Years and over | 196 (21.2%) | 401 (27.8%) |
Disability Class: Ambulatory Difficulty
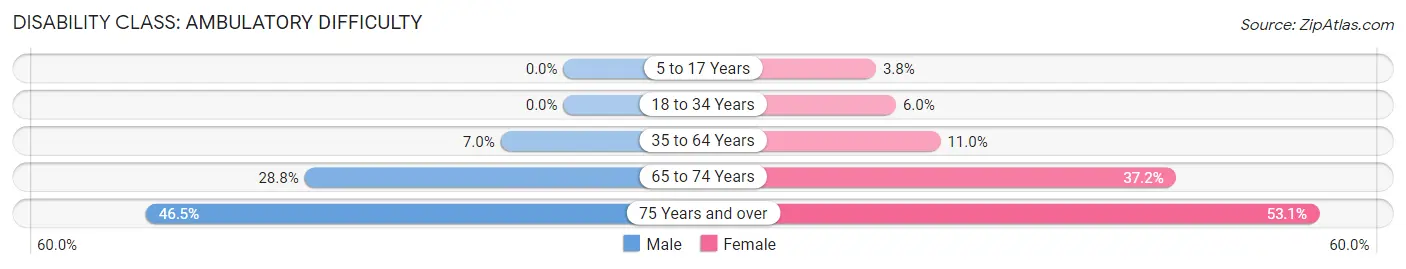
| Age Bracket | Male | Female |
| 5 to 17 Years | 0 (0.0%) | 36 (3.8%) |
| 18 to 34 Years | 0 (0.0%) | 89 (6.0%) |
| 35 to 64 Years | 183 (7.0%) | 348 (11.0%) |
| 65 to 74 Years | 267 (28.8%) | 437 (37.2%) |
| 75 Years and over | 430 (46.5%) | 766 (53.1%) |
Disability Class: Self-Care Difficulty
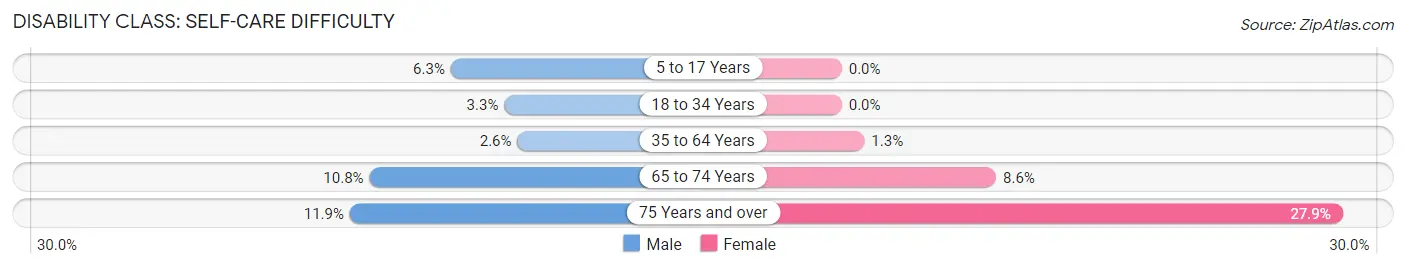
| Age Bracket | Male | Female |
| 5 to 17 Years | 59 (6.3%) | 0 (0.0%) |
| 18 to 34 Years | 48 (3.3%) | 0 (0.0%) |
| 35 to 64 Years | 67 (2.6%) | 40 (1.3%) |
| 65 to 74 Years | 100 (10.8%) | 101 (8.6%) |
| 75 Years and over | 110 (11.9%) | 402 (27.9%) |
Technology Access in Hormigueros Municipio
Computing Device Access in Hormigueros Municipio
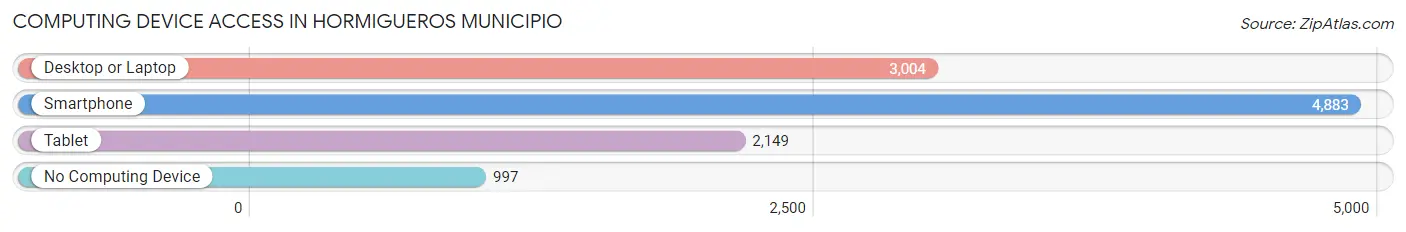
| Device Type | # Households | % Households |
| Desktop or Laptop | 3,004 | 48.9% |
| Smartphone | 4,883 | 79.5% |
| Tablet | 2,149 | 35.0% |
| No Computing Device | 997 | 16.2% |
| Total | 6,139 | 100.0% |
Internet Access in Hormigueros Municipio
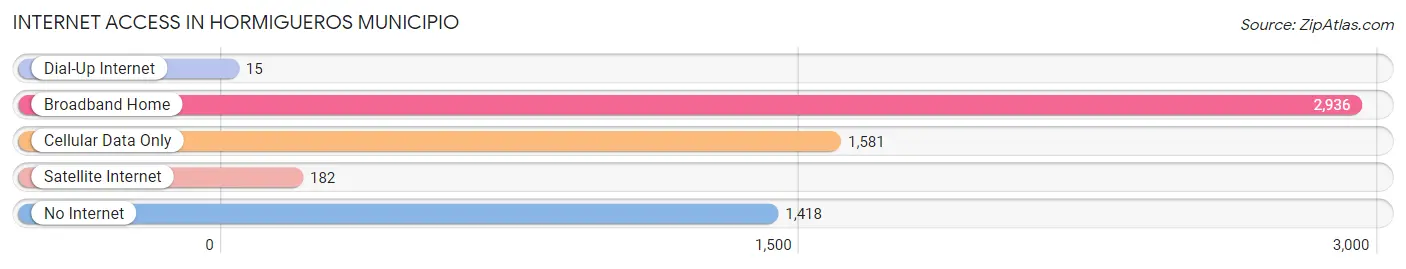
| Internet Type | # Households | % Households |
| Dial-Up Internet | 15 | 0.2% |
| Broadband Home | 2,936 | 47.8% |
| Cellular Data Only | 1,581 | 25.8% |
| Satellite Internet | 182 | 3.0% |
| No Internet | 1,418 | 23.1% |
| Total | 6,139 | 100.0% |
Hormigueros Municipio Summary
Hormigueros Municipio is a municipality located in the western region of Puerto Rico. It is part of the Mayagüez-San Germán-Cabo Rojo Metropolitan Statistical Area. The municipality is located in the southwestern part of the island, bordering the municipalities of Mayagüez, San Germán, and Cabo Rojo. As of the 2010 census, the population of Hormigueros was 16,817.
History
The area of Hormigueros was originally inhabited by the Taíno Indians. The first Spanish settlers arrived in the area in the early 16th century. The area was originally part of the municipality of San Germán, but in 1831 it was separated and established as its own municipality. The name of the municipality is derived from the Spanish word for “ants”, as the area was known for its large ant population.
Geography
Hormigueros is located in the western region of Puerto Rico, in the southwestern part of the island. It is bordered by the municipalities of Mayagüez, San Germán, and Cabo Rojo. The municipality covers an area of approximately 39 square miles (101 km2). The terrain is mostly flat, with some hills in the northern part of the municipality. The highest point in the municipality is Cerro de la Cruz, which has an elevation of 1,067 feet (325 m).
The climate in Hormigueros is tropical, with an average temperature of 79°F (26°C). The average annual precipitation is around 50 inches (127 cm).
Economy
The economy of Hormigueros is largely based on agriculture. The main crops grown in the municipality are sugarcane, coffee, and tobacco. Livestock farming is also an important part of the economy, with cattle, pigs, and goats being raised in the area.
The municipality also has a small manufacturing sector, with several small factories producing food products, furniture, and clothing. Tourism is also an important part of the economy, with several hotels and resorts located in the area.
Demographics
As of the 2010 census, the population of Hormigueros was 16,817. The population is mostly of mixed European and African descent. The majority of the population (90.3%) is of Hispanic or Latino origin. The median household income in the municipality is $17,845, and the poverty rate is 44.3%.
Education
Hormigueros has several public and private schools, including the University of Puerto Rico at Mayagüez, which is located in the municipality. The municipality also has several libraries, including the Hormigueros Public Library.
Conclusion
Hormigueros Municipio is a municipality located in the western region of Puerto Rico. It is part of the Mayagüez-San Germán-Cabo Rojo Metropolitan Statistical Area. The municipality is mostly of mixed European and African descent, and the economy is largely based on agriculture. The municipality also has a small manufacturing sector, with several small factories producing food products, furniture, and clothing. Tourism is also an important part of the economy, with several hotels and resorts located in the area. Hormigueros has several public and private schools, including the University of Puerto Rico at Mayagüez, and several libraries, including the Hormigueros Public Library.
Common Questions
What is Per Capita Income in Hormigueros Municipio?
Per Capita income in Hormigueros Municipio is $14,338.
What is the Median Family Income in Hormigueros Municipio?
Median Family Income in Hormigueros Municipio is $27,144.
What is the Median Household income in Hormigueros Municipio?
Median Household Income in Hormigueros Municipio is $22,542.
What is Income or Wage Gap in Hormigueros Municipio?
Income or Wage Gap in Hormigueros Municipio is 4.6%.
Women in Hormigueros Municipio earn 95.4 cents for every dollar earned by a man.
What is Family Income Deficit in Hormigueros Municipio?
Family Income Deficit in Hormigueros Municipio is $9,034.
Families that are below poverty line in Hormigueros Municipio earn $9,034 less on average than the poverty threshold level.
What is Inequality or Gini Index in Hormigueros Municipio?
Inequality or Gini Index in Hormigueros Municipio is 0.48.
What is the Total Population of Hormigueros Municipio?
Total Population of Hormigueros Municipio is 15,571.
What is the Total Male Population of Hormigueros Municipio?
Total Male Population of Hormigueros Municipio is 7,199.
What is the Total Female Population of Hormigueros Municipio?
Total Female Population of Hormigueros Municipio is 8,372.
What is the Ratio of Males per 100 Females in Hormigueros Municipio?
There are 85.99 Males per 100 Females in Hormigueros Municipio.
What is the Ratio of Females per 100 Males in Hormigueros Municipio?
There are 116.29 Females per 100 Males in Hormigueros Municipio.
What is the Median Population Age in Hormigueros Municipio?
Median Population Age in Hormigueros Municipio is 49.0 Years.
What is the Average Family Size in Hormigueros Municipio
Average Family Size in Hormigueros Municipio is 3.1 People.
What is the Average Household Size in Hormigueros Municipio
Average Household Size in Hormigueros Municipio is 2.5 People.
How Large is the Labor Force in Hormigueros Municipio?
There are 6,023 People in the Labor Forcein in Hormigueros Municipio.
What is the Percentage of People in the Labor Force in Hormigueros Municipio?
44.1% of People are in the Labor Force in Hormigueros Municipio.
What is the Unemployment Rate in Hormigueros Municipio?
Unemployment Rate in Hormigueros Municipio is 16.5%.