Barranquitas Municipio, PR Map & Demographics
Barranquitas Municipio Map
Barranquitas Municipio Overview
$11,396
PER CAPITA INCOME
$23,903
AVG FAMILY INCOME
$21,262
AVG HOUSEHOLD INCOME
4.4%
WAGE / INCOME GAP [ % ]
95.6¢/ $1
WAGE / INCOME GAP [ $ ]
$13,161
FAMILY INCOME DEFICIT
0.50
INEQUALITY / GINI INDEX
28,899
TOTAL POPULATION
14,172
MALE POPULATION
14,727
FEMALE POPULATION
96.23
MALES / 100 FEMALES
103.92
FEMALES / 100 MALES
38.9
MEDIAN AGE
3.6
AVG FAMILY SIZE
3.1
AVG HOUSEHOLD SIZE
10,376
LABOR FORCE [ PEOPLE ]
43.7%
PERCENT IN LABOR FORCE
15.5%
UNEMPLOYMENT RATE
Barranquitas Municipio Area Codes
Income in Barranquitas Municipio
Income Overview in Barranquitas Municipio
Per Capita Income in Barranquitas Municipio is $11,396, while median incomes of families and households are $23,903 and $21,262 respectively.
| Characteristic | Number | Measure |
| Per Capita Income | 28,899 | $11,396 |
| Median Family Income | 6,835 | $23,903 |
| Mean Family Income | 6,835 | $32,557 |
| Median Household Income | 9,098 | $21,262 |
| Mean Household Income | 9,098 | $30,100 |
| Income Deficit | 6,835 | $13,161 |
| Wage / Income Gap (%) | 28,899 | 4.42% |
| Wage / Income Gap ($) | 28,899 | 95.58¢ per $1 |
| Gini / Inequality Index | 28,899 | 0.50 |
Earnings by Sex in Barranquitas Municipio
Average Earnings in Barranquitas Municipio are $17,131, $17,431 for men and $16,660 for women, a difference of 4.4%.
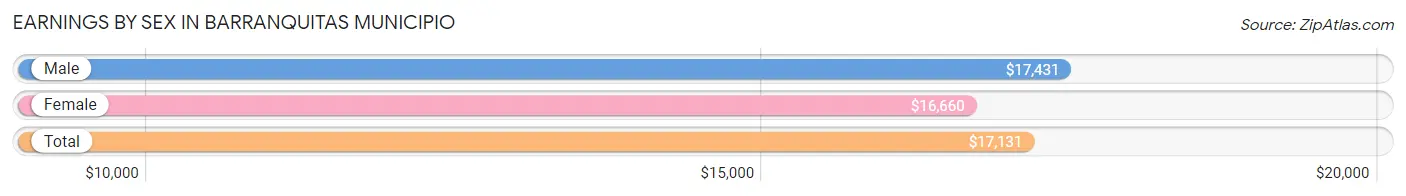
| Sex | Number | Average Earnings |
| Male | 5,633 (59.3%) | $17,431 |
| Female | 3,862 (40.7%) | $16,660 |
| Total | 9,495 (100.0%) | $17,131 |
Earnings by Sex by Income Bracket in Barranquitas Municipio
The most common earnings brackets in Barranquitas Municipio are $15,000 to $17,499 for men (816 | 14.5%) and $15,000 to $17,499 for women (521 | 13.5%).
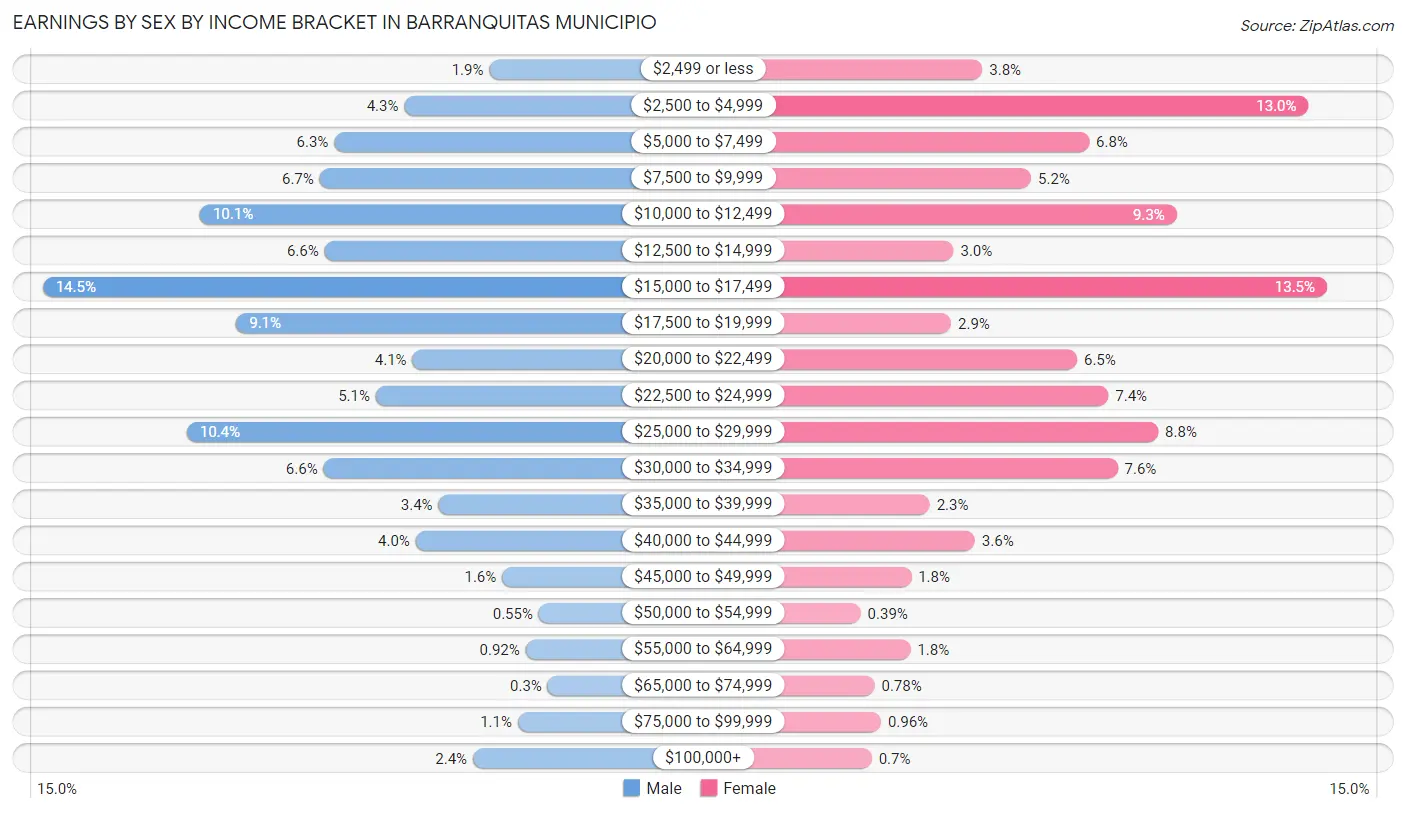
| Income | Male | Female |
| $2,499 or less | 109 (1.9%) | 147 (3.8%) |
| $2,500 to $4,999 | 244 (4.3%) | 501 (13.0%) |
| $5,000 to $7,499 | 355 (6.3%) | 263 (6.8%) |
| $7,500 to $9,999 | 378 (6.7%) | 200 (5.2%) |
| $10,000 to $12,499 | 567 (10.1%) | 358 (9.3%) |
| $12,500 to $14,999 | 370 (6.6%) | 116 (3.0%) |
| $15,000 to $17,499 | 816 (14.5%) | 521 (13.5%) |
| $17,500 to $19,999 | 510 (9.0%) | 113 (2.9%) |
| $20,000 to $22,499 | 231 (4.1%) | 250 (6.5%) |
| $22,500 to $24,999 | 289 (5.1%) | 284 (7.3%) |
| $25,000 to $29,999 | 588 (10.4%) | 338 (8.7%) |
| $30,000 to $34,999 | 372 (6.6%) | 294 (7.6%) |
| $35,000 to $39,999 | 190 (3.4%) | 90 (2.3%) |
| $40,000 to $44,999 | 226 (4.0%) | 139 (3.6%) |
| $45,000 to $49,999 | 89 (1.6%) | 70 (1.8%) |
| $50,000 to $54,999 | 31 (0.5%) | 15 (0.4%) |
| $55,000 to $64,999 | 52 (0.9%) | 69 (1.8%) |
| $65,000 to $74,999 | 17 (0.3%) | 30 (0.8%) |
| $75,000 to $99,999 | 64 (1.1%) | 37 (1.0%) |
| $100,000+ | 135 (2.4%) | 27 (0.7%) |
| Total | 5,633 (100.0%) | 3,862 (100.0%) |
Earnings by Sex by Educational Attainment in Barranquitas Municipio
Average earnings in Barranquitas Municipio are $18,300 for men and $17,497 for women, a difference of 4.4%. Men with an educational attainment of graduate degree enjoy the highest average annual earnings of $32,857, while those with high school diploma education earn the least with $17,097. Women with an educational attainment of graduate degree earn the most with the average annual earnings of $29,231, while those with high school diploma education have the smallest earnings of $10,693.
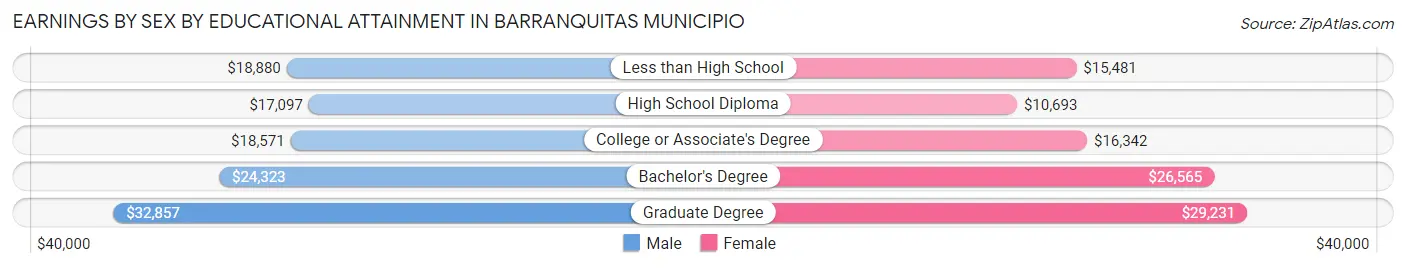
| Educational Attainment | Male Income | Female Income |
| Less than High School | $18,880 | $15,481 |
| High School Diploma | $17,097 | $10,693 |
| College or Associate's Degree | $18,571 | $16,342 |
| Bachelor's Degree | $24,323 | $26,565 |
| Graduate Degree | $32,857 | $29,231 |
| Total | $18,300 | $17,497 |
Family Income in Barranquitas Municipio
Family Income Brackets in Barranquitas Municipio
According to the Barranquitas Municipio family income data, there are 1,613 families falling into the less than $10,000 income range, which is the most common income bracket and makes up 23.6% of all families. Conversely, the $200,000+ income bracket is the least frequent group with only 41 families (0.6%) belonging to this category.
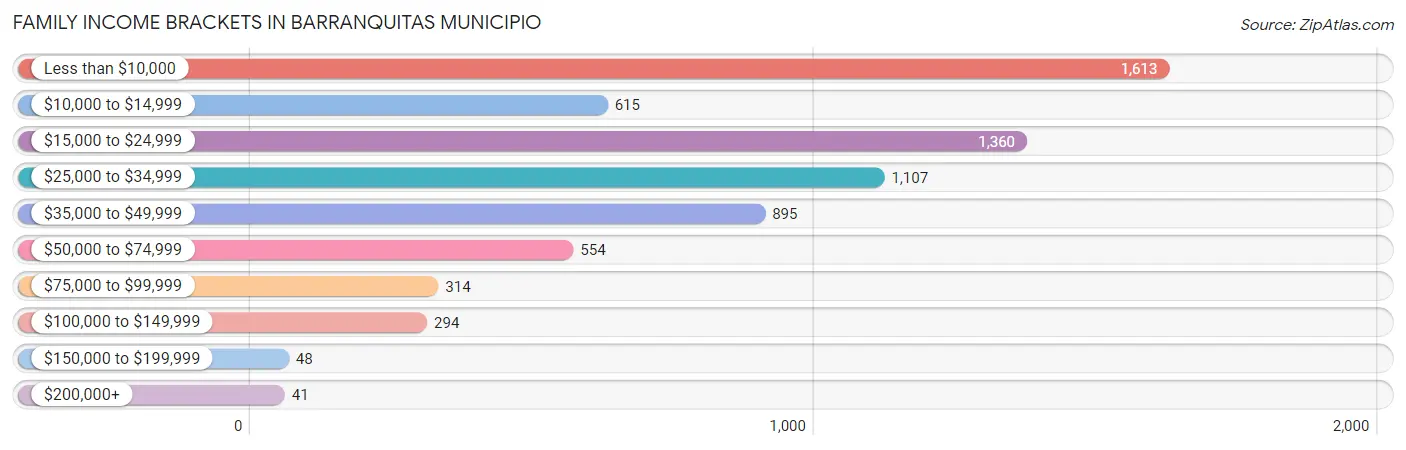
| Income Bracket | # Families | % Families |
| Less than $10,000 | 1,613 | 23.6% |
| $10,000 to $14,999 | 615 | 9.0% |
| $15,000 to $24,999 | 1,360 | 19.9% |
| $25,000 to $34,999 | 1,107 | 16.2% |
| $35,000 to $49,999 | 895 | 13.1% |
| $50,000 to $74,999 | 554 | 8.1% |
| $75,000 to $99,999 | 314 | 4.6% |
| $100,000 to $149,999 | 294 | 4.3% |
| $150,000 to $199,999 | 48 | 0.7% |
| $200,000+ | 41 | 0.6% |
Family Income by Famaliy Size in Barranquitas Municipio
4-person families (1,139 | 16.7%) account for the highest median family income in Barranquitas Municipio with $27,757 per family, while 2-person families (3,134 | 45.9%) have the highest median income of $10,136 per family member.
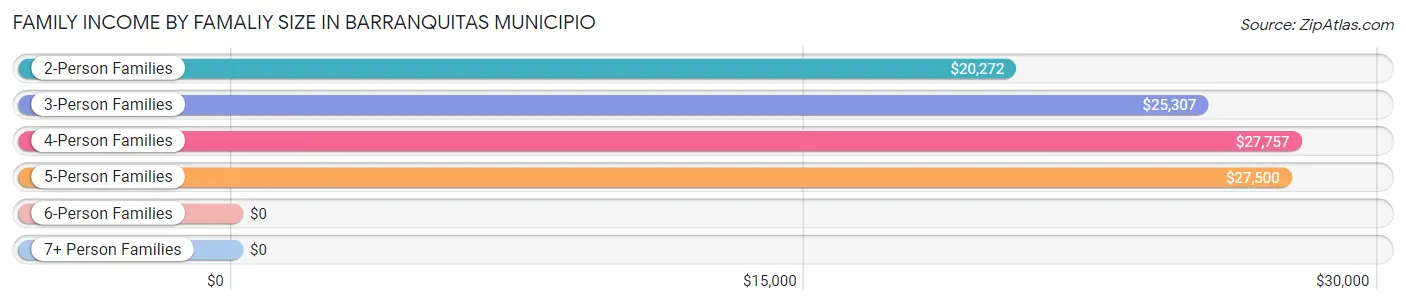
| Income Bracket | # Families | Median Income |
| 2-Person Families | 3,134 (45.9%) | $20,272 |
| 3-Person Families | 1,929 (28.2%) | $25,307 |
| 4-Person Families | 1,139 (16.7%) | $27,757 |
| 5-Person Families | 470 (6.9%) | $27,500 |
| 6-Person Families | 94 (1.4%) | $0 |
| 7+ Person Families | 69 (1.0%) | $0 |
| Total | 6,835 (100.0%) | $23,903 |
Family Income by Number of Earners in Barranquitas Municipio
The median family income in Barranquitas Municipio is $23,903, with families comprising 3+ earners (240) having the highest median family income of $48,676, while families with no earners (2,791) have the lowest median family income of $11,199, accounting for 3.5% and 40.8% of families, respectively.
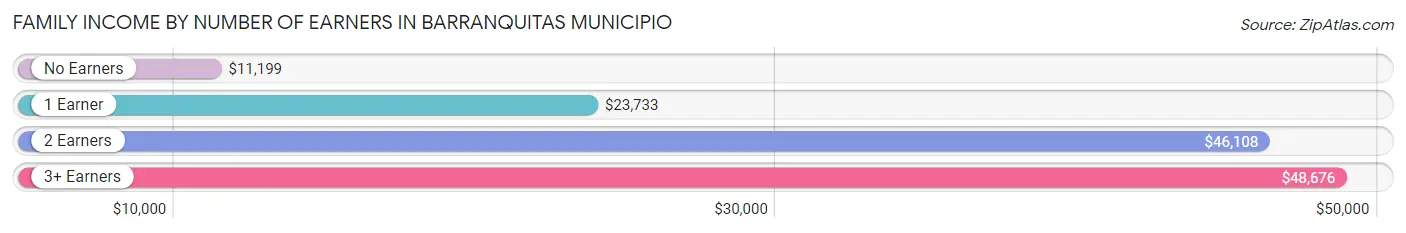
| Number of Earners | # Families | Median Income |
| No Earners | 2,791 (40.8%) | $11,199 |
| 1 Earner | 2,600 (38.0%) | $23,733 |
| 2 Earners | 1,204 (17.6%) | $46,108 |
| 3+ Earners | 240 (3.5%) | $48,676 |
| Total | 6,835 (100.0%) | $23,903 |
Household Income in Barranquitas Municipio
Household Income Brackets in Barranquitas Municipio
With 2,229 households falling in the category, the less than $10,000 income range is the most frequent in Barranquitas Municipio, accounting for 24.5% of all households. In contrast, only 36 households (0.4%) fall into the $200,000+ income bracket, making it the least populous group.
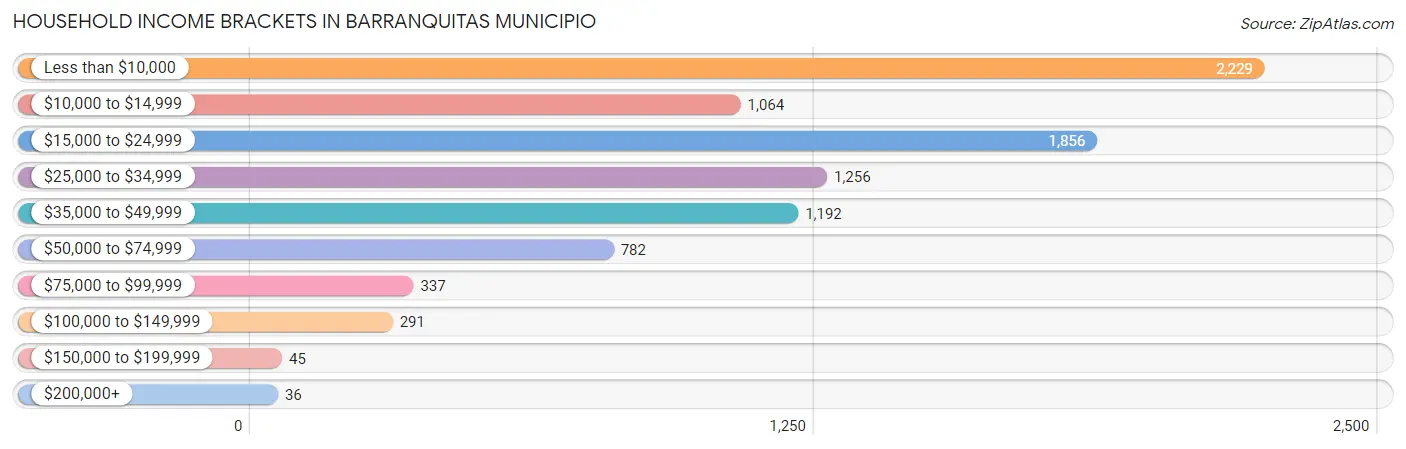
| Income Bracket | # Households | % Households |
| Less than $10,000 | 2,229 | 24.5% |
| $10,000 to $14,999 | 1,064 | 11.7% |
| $15,000 to $24,999 | 1,856 | 20.4% |
| $25,000 to $34,999 | 1,256 | 13.8% |
| $35,000 to $49,999 | 1,192 | 13.1% |
| $50,000 to $74,999 | 782 | 8.6% |
| $75,000 to $99,999 | 337 | 3.7% |
| $100,000 to $149,999 | 291 | 3.2% |
| $150,000 to $199,999 | 45 | 0.5% |
| $200,000+ | 36 | 0.4% |
Household Income by Householder Age in Barranquitas Municipio
The median household income in Barranquitas Municipio is $21,262, with the highest median household income of $24,185 found in the 45 to 64 years age bracket for the primary householder. A total of 3,554 households (39.1%) fall into this category. Meanwhile, the 15 to 24 years age bracket for the primary householder has the lowest median household income of $14,300, with 198 households (2.2%) in this group.
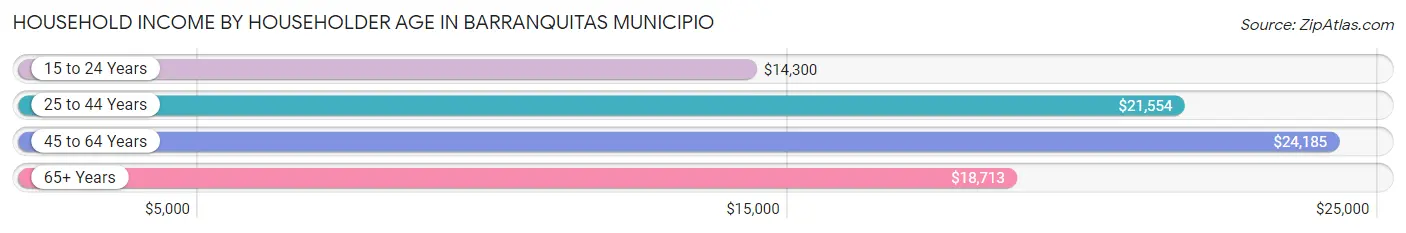
| Income Bracket | # Households | Median Income |
| 15 to 24 Years | 198 (2.2%) | $14,300 |
| 25 to 44 Years | 2,106 (23.2%) | $21,554 |
| 45 to 64 Years | 3,554 (39.1%) | $24,185 |
| 65+ Years | 3,240 (35.6%) | $18,713 |
| Total | 9,098 (100.0%) | $21,262 |
Poverty in Barranquitas Municipio
Income Below Poverty by Sex and Age in Barranquitas Municipio
With 46.2% poverty level for males and 53.5% for females among the residents of Barranquitas Municipio, 12 to 14 year old males and under 5 year old females are the most vulnerable to poverty, with 340 males (79.1%) and 450 females (74.9%) in their respective age groups living below the poverty level.
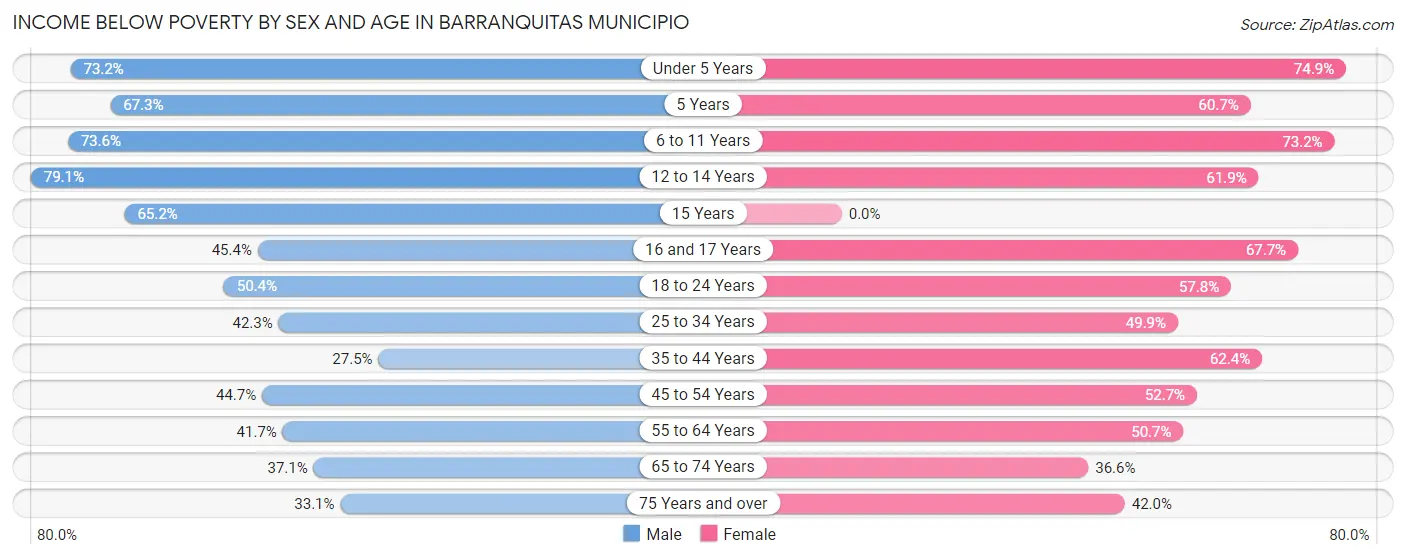
| Age Bracket | Male | Female |
| Under 5 Years | 445 (73.2%) | 450 (74.9%) |
| 5 Years | 183 (67.3%) | 68 (60.7%) |
| 6 to 11 Years | 822 (73.6%) | 624 (73.2%) |
| 12 to 14 Years | 340 (79.1%) | 474 (61.9%) |
| 15 Years | 116 (65.2%) | 0 (0.0%) |
| 16 and 17 Years | 157 (45.4%) | 275 (67.7%) |
| 18 to 24 Years | 732 (50.4%) | 752 (57.8%) |
| 25 to 34 Years | 866 (42.3%) | 988 (49.9%) |
| 35 to 44 Years | 477 (27.5%) | 1,118 (62.4%) |
| 45 to 54 Years | 728 (44.7%) | 955 (52.7%) |
| 55 to 64 Years | 802 (41.7%) | 1,051 (50.7%) |
| 65 to 74 Years | 520 (37.1%) | 557 (36.6%) |
| 75 Years and over | 295 (33.1%) | 550 (42.0%) |
| Total | 6,483 (46.2%) | 7,862 (53.5%) |
Income Above Poverty by Sex and Age in Barranquitas Municipio
According to the poverty statistics in Barranquitas Municipio, males aged 35 to 44 years and females aged 15 years are the age groups that are most secure financially, with 72.5% of males and 100.0% of females in these age groups living above the poverty line.
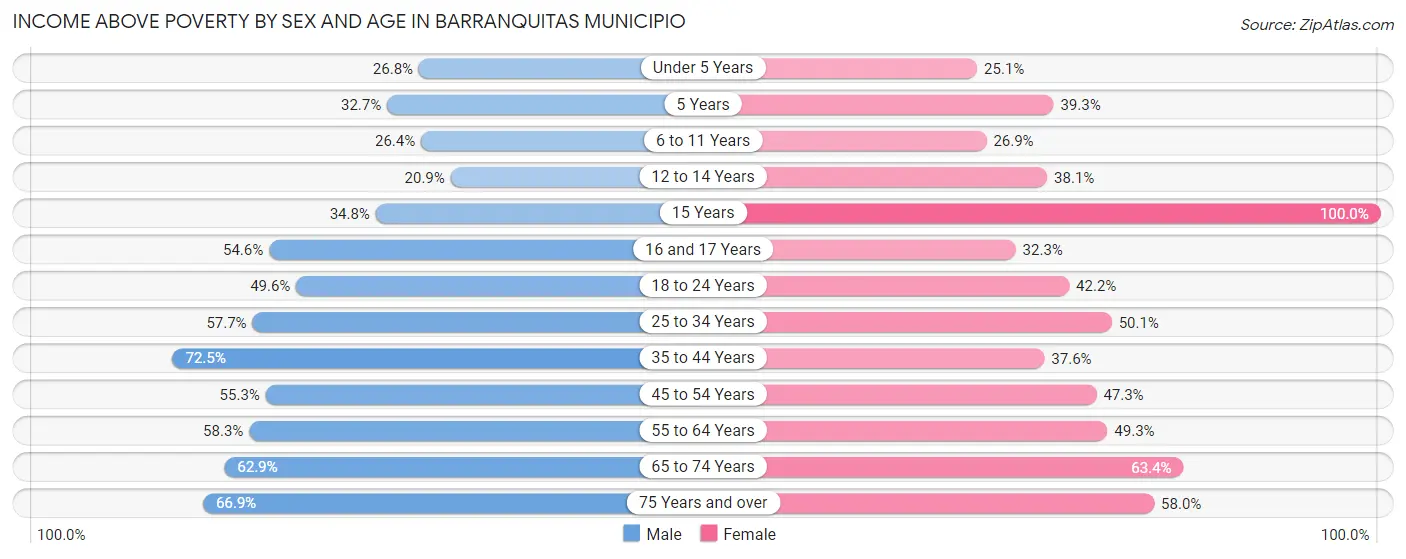
| Age Bracket | Male | Female |
| Under 5 Years | 163 (26.8%) | 151 (25.1%) |
| 5 Years | 89 (32.7%) | 44 (39.3%) |
| 6 to 11 Years | 295 (26.4%) | 229 (26.9%) |
| 12 to 14 Years | 90 (20.9%) | 292 (38.1%) |
| 15 Years | 62 (34.8%) | 159 (100.0%) |
| 16 and 17 Years | 189 (54.6%) | 131 (32.3%) |
| 18 to 24 Years | 720 (49.6%) | 549 (42.2%) |
| 25 to 34 Years | 1,182 (57.7%) | 992 (50.1%) |
| 35 to 44 Years | 1,260 (72.5%) | 674 (37.6%) |
| 45 to 54 Years | 899 (55.3%) | 856 (47.3%) |
| 55 to 64 Years | 1,122 (58.3%) | 1,022 (49.3%) |
| 65 to 74 Years | 882 (62.9%) | 965 (63.4%) |
| 75 Years and over | 596 (66.9%) | 759 (58.0%) |
| Total | 7,549 (53.8%) | 6,823 (46.5%) |
Income Below Poverty Among Married-Couple Families in Barranquitas Municipio
The poverty statistics for married-couple families in Barranquitas Municipio show that 34.6% or 1,237 of the total 3,574 families live below the poverty line. Families with 5 or more children have the highest poverty rate of 100.0%, comprising of 59 families. On the other hand, families with no children have the lowest poverty rate of 29.2%, which includes 705 families.
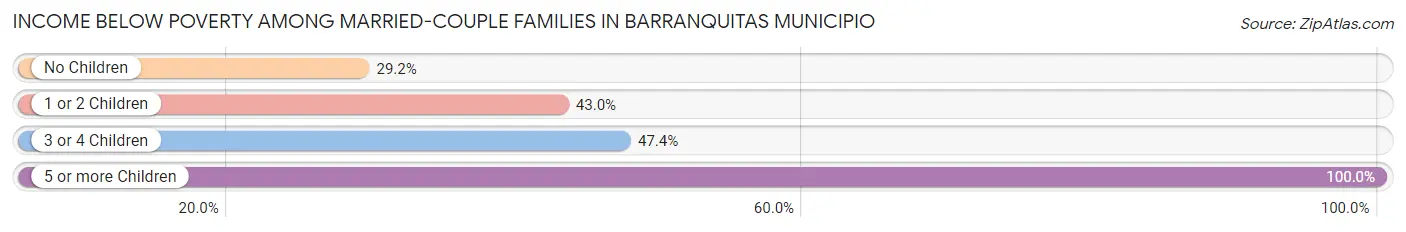
| Children | Above Poverty | Below Poverty |
| No Children | 1,713 (70.8%) | 705 (29.2%) |
| 1 or 2 Children | 614 (57.0%) | 464 (43.0%) |
| 3 or 4 Children | 10 (52.6%) | 9 (47.4%) |
| 5 or more Children | 0 (0.0%) | 59 (100.0%) |
| Total | 2,337 (65.4%) | 1,237 (34.6%) |
Income Below Poverty Among Single-Parent Households in Barranquitas Municipio
According to the poverty data in Barranquitas Municipio, 47.5% or 477 single-father households and 68.5% or 1,545 single-mother households are living below the poverty line. Among single-father households, those with 3 or 4 children have the highest poverty rate, with 55 households (100.0%) experiencing poverty. Likewise, among single-mother households, those with 3 or 4 children have the highest poverty rate, with 207 households (100.0%) falling below the poverty line.
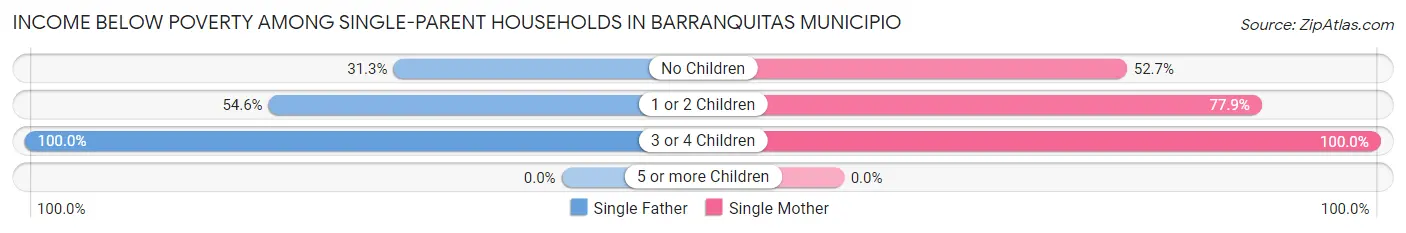
| Children | Single Father | Single Mother |
| No Children | 130 (31.3%) | 540 (52.7%) |
| 1 or 2 Children | 292 (54.6%) | 798 (77.8%) |
| 3 or 4 Children | 55 (100.0%) | 207 (100.0%) |
| 5 or more Children | 0 (0.0%) | 0 (0.0%) |
| Total | 477 (47.5%) | 1,545 (68.5%) |
Income Below Poverty Among Married-Couple vs Single-Parent Households in Barranquitas Municipio
The poverty data for Barranquitas Municipio shows that 1,237 of the married-couple family households (34.6%) and 2,022 of the single-parent households (62.0%) are living below the poverty level. Within the married-couple family households, those with 5 or more children have the highest poverty rate, with 59 households (100.0%) falling below the poverty line. Among the single-parent households, those with 3 or 4 children have the highest poverty rate, with 262 household (100.0%) living below poverty.
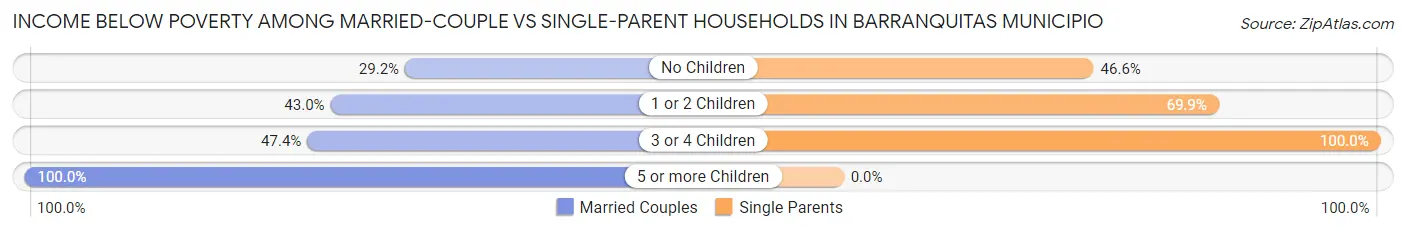
| Children | Married-Couple Families | Single-Parent Households |
| No Children | 705 (29.2%) | 670 (46.6%) |
| 1 or 2 Children | 464 (43.0%) | 1,090 (69.9%) |
| 3 or 4 Children | 9 (47.4%) | 262 (100.0%) |
| 5 or more Children | 59 (100.0%) | 0 (0.0%) |
| Total | 1,237 (34.6%) | 2,022 (62.0%) |
Race in Barranquitas Municipio
The most populous races in Barranquitas Municipio are Hispanic or Latino (28,864 | 99.9%), White / Caucasian (15,682 | 54.3%), and Two or more Races (9,059 | 31.4%).
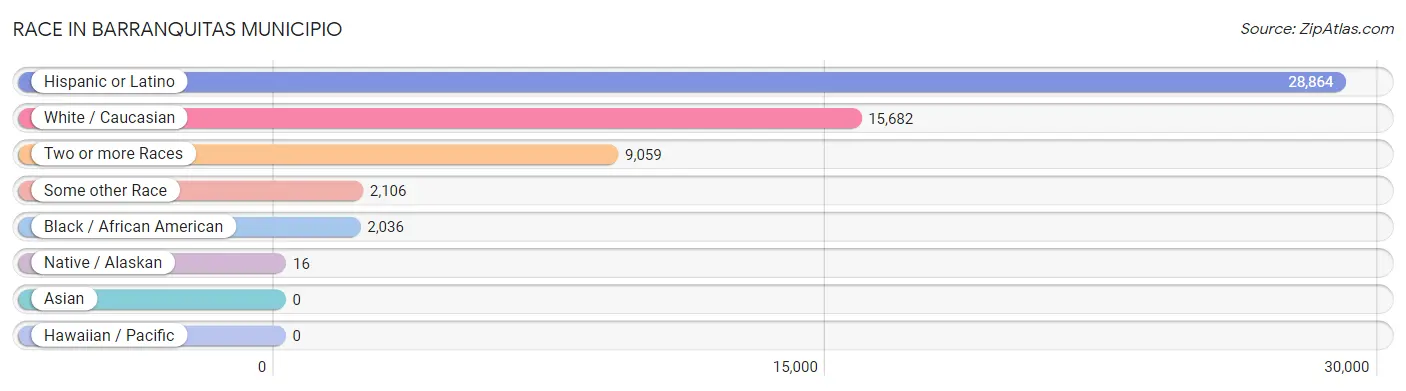
| Race | # Population | % Population |
| Asian | 0 | 0.0% |
| Black / African American | 2,036 | 7.0% |
| Hawaiian / Pacific | 0 | 0.0% |
| Hispanic or Latino | 28,864 | 99.9% |
| Native / Alaskan | 16 | 0.1% |
| White / Caucasian | 15,682 | 54.3% |
| Two or more Races | 9,059 | 31.4% |
| Some other Race | 2,106 | 7.3% |
| Total | 28,899 | 100.0% |
Ancestry in Barranquitas Municipio
The most populous ancestries reported in Barranquitas Municipio are Puerto Rican (28,621 | 99.0%), American (211 | 0.7%), African (88 | 0.3%), Subsaharan African (88 | 0.3%), and Dominican (84 | 0.3%), together accounting for 100.7% of all Barranquitas Municipio residents.
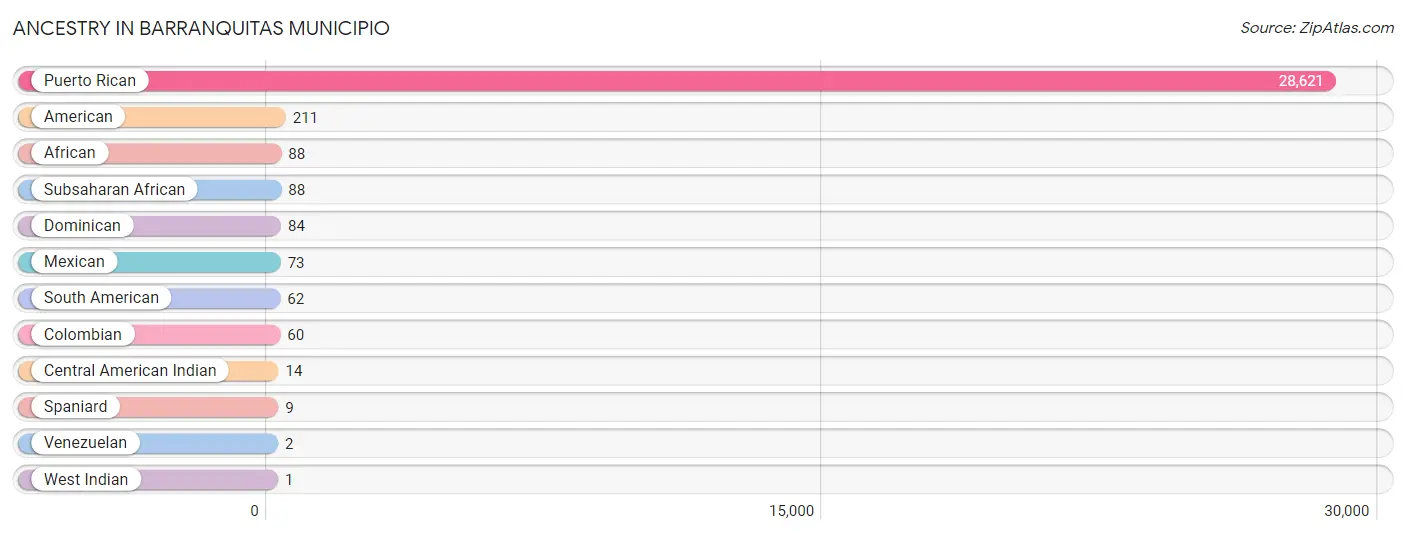
| Ancestry | # Population | % Population |
| African | 88 | 0.3% |
| American | 211 | 0.7% |
| Central American Indian | 14 | 0.1% |
| Colombian | 60 | 0.2% |
| Dominican | 84 | 0.3% |
| Mexican | 73 | 0.3% |
| Puerto Rican | 28,621 | 99.0% |
| South American | 62 | 0.2% |
| Spaniard | 9 | 0.0% |
| Subsaharan African | 88 | 0.3% |
| Venezuelan | 2 | 0.0% |
| West Indian | 1 | 0.0% | View All 12 Rows |
Immigrants in Barranquitas Municipio

| Immigration Origin | # Population | % Population | View All 0 Rows |
Sex and Age in Barranquitas Municipio
Sex and Age in Barranquitas Municipio
The most populous age groups in Barranquitas Municipio are 20 to 24 Years (1,121 | 7.9%) for men and 55 to 59 Years (1,214 | 8.2%) for women.
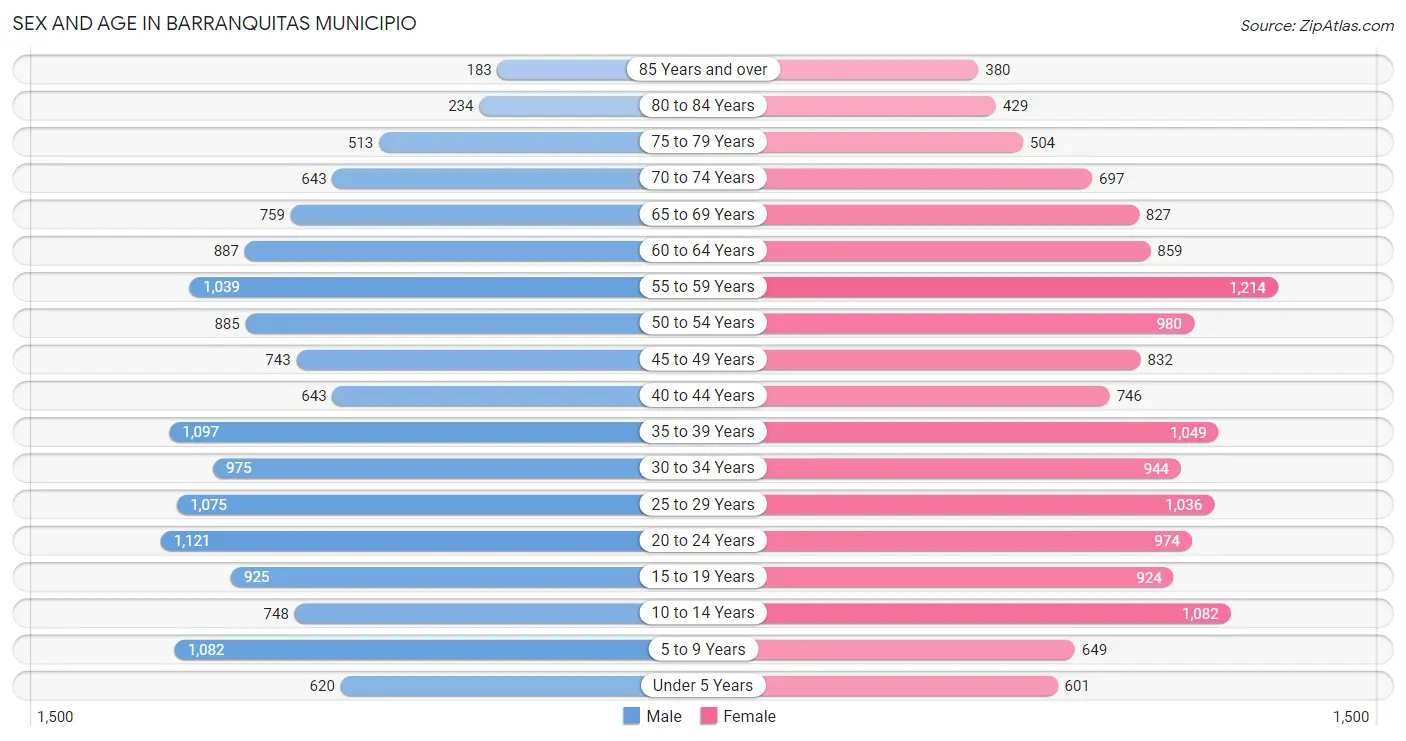
| Age Bracket | Male | Female |
| Under 5 Years | 620 (4.4%) | 601 (4.1%) |
| 5 to 9 Years | 1,082 (7.6%) | 649 (4.4%) |
| 10 to 14 Years | 748 (5.3%) | 1,082 (7.3%) |
| 15 to 19 Years | 925 (6.5%) | 924 (6.3%) |
| 20 to 24 Years | 1,121 (7.9%) | 974 (6.6%) |
| 25 to 29 Years | 1,075 (7.6%) | 1,036 (7.0%) |
| 30 to 34 Years | 975 (6.9%) | 944 (6.4%) |
| 35 to 39 Years | 1,097 (7.7%) | 1,049 (7.1%) |
| 40 to 44 Years | 643 (4.5%) | 746 (5.1%) |
| 45 to 49 Years | 743 (5.2%) | 832 (5.7%) |
| 50 to 54 Years | 885 (6.2%) | 980 (6.7%) |
| 55 to 59 Years | 1,039 (7.3%) | 1,214 (8.2%) |
| 60 to 64 Years | 887 (6.3%) | 859 (5.8%) |
| 65 to 69 Years | 759 (5.4%) | 827 (5.6%) |
| 70 to 74 Years | 643 (4.5%) | 697 (4.7%) |
| 75 to 79 Years | 513 (3.6%) | 504 (3.4%) |
| 80 to 84 Years | 234 (1.7%) | 429 (2.9%) |
| 85 Years and over | 183 (1.3%) | 380 (2.6%) |
| Total | 14,172 (100.0%) | 14,727 (100.0%) |
Families and Households in Barranquitas Municipio
Median Family Size in Barranquitas Municipio
The median family size in Barranquitas Municipio is 3.65 persons per family, with single female/mother families (2,256 | 33.0%) accounting for the largest median family size of 3.82 persons per family. On the other hand, single male/father families (1,005 | 14.7%) represent the smallest median family size with 3.54 persons per family.
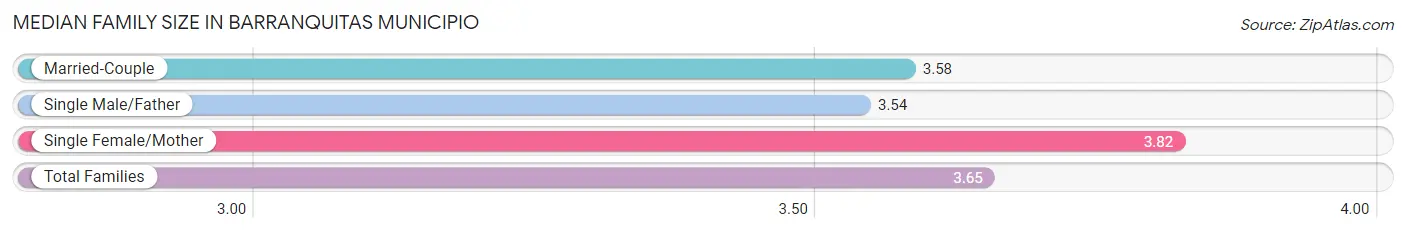
| Family Type | # Families | Family Size |
| Married-Couple | 3,574 (52.3%) | 3.58 |
| Single Male/Father | 1,005 (14.7%) | 3.54 |
| Single Female/Mother | 2,256 (33.0%) | 3.82 |
| Total Families | 6,835 (100.0%) | 3.65 |
Median Household Size in Barranquitas Municipio
The median household size in Barranquitas Municipio is 3.15 persons per household, with single male/father households (1,005 | 11.1%) accounting for the largest median household size of 4.06 persons per household. non-family households (2,263 | 24.9%) represent the smallest median household size with 1.16 persons per household.
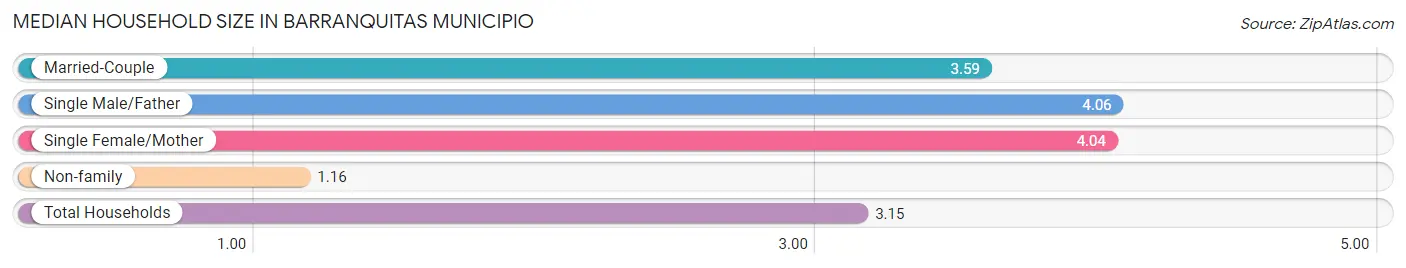
| Household Type | # Households | Household Size |
| Married-Couple | 3,574 (39.3%) | 3.59 |
| Single Male/Father | 1,005 (11.1%) | 4.06 |
| Single Female/Mother | 2,256 (24.8%) | 4.04 |
| Non-family | 2,263 (24.9%) | 1.16 |
| Total Households | 9,098 (100.0%) | 3.15 |
Household Size by Marriage Status in Barranquitas Municipio
Out of a total of 9,098 households in Barranquitas Municipio, 6,835 (75.1%) are family households, while 2,263 (24.9%) are nonfamily households. The most numerous type of family households are 2-person households, comprising 2,746, and the most common type of nonfamily households are 1-person households, comprising 1,896.
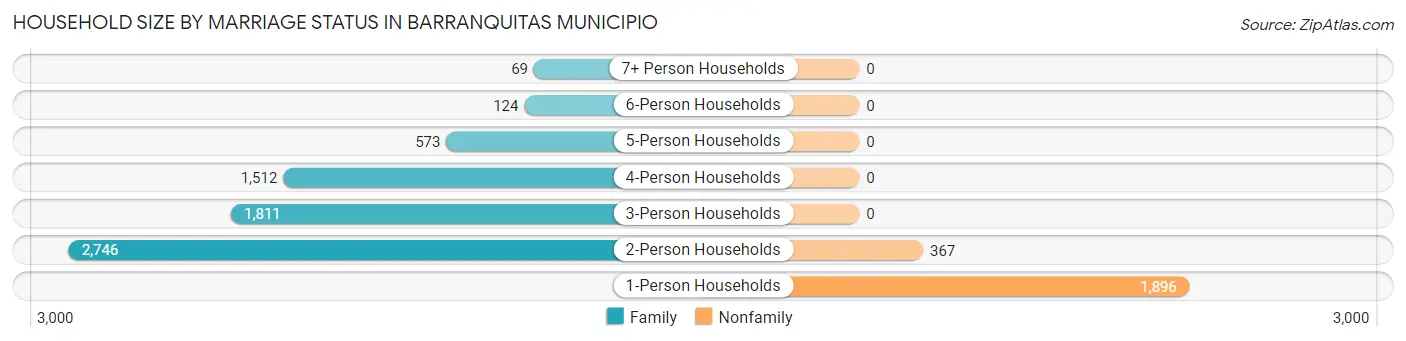
| Household Size | Family Households | Nonfamily Households |
| 1-Person Households | - | 1,896 (20.8%) |
| 2-Person Households | 2,746 (30.2%) | 367 (4.0%) |
| 3-Person Households | 1,811 (19.9%) | 0 (0.0%) |
| 4-Person Households | 1,512 (16.6%) | 0 (0.0%) |
| 5-Person Households | 573 (6.3%) | 0 (0.0%) |
| 6-Person Households | 124 (1.4%) | 0 (0.0%) |
| 7+ Person Households | 69 (0.8%) | 0 (0.0%) |
| Total | 6,835 (75.1%) | 2,263 (24.9%) |
Female Fertility in Barranquitas Municipio
Fertility by Age in Barranquitas Municipio
Average fertility rate in Barranquitas Municipio is 46.0 births per 1,000 women. Women in the age bracket of 20 to 34 years have the highest fertility rate with 100.0 births per 1,000 women. Women in the age bracket of 20 to 34 years acount for 96.1% of all women with births.
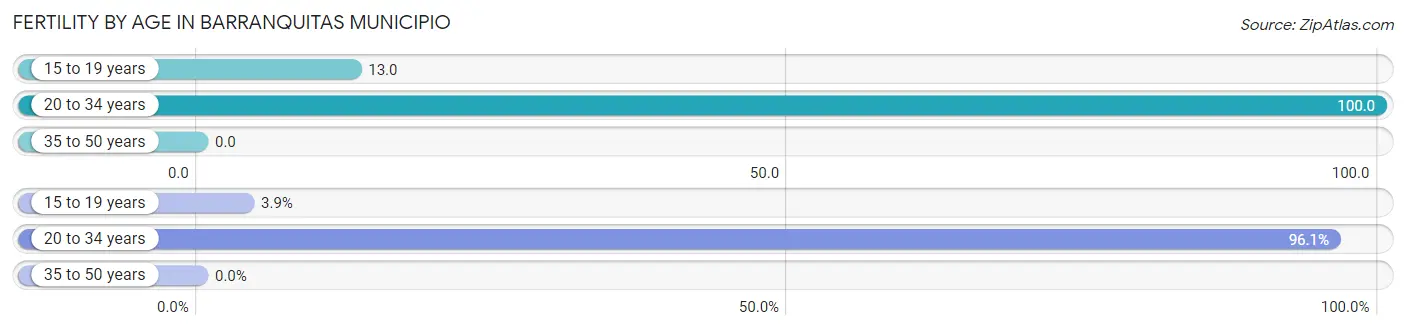
| Age Bracket | Women with Births | Births / 1,000 Women |
| 15 to 19 years | 12 (3.9%) | 13.0 |
| 20 to 34 years | 295 (96.1%) | 100.0 |
| 35 to 50 years | 0 (0.0%) | 0.0 |
| Total | 307 (100.0%) | 46.0 |
Fertility by Age by Marriage Status in Barranquitas Municipio
40.7% of women with births (307) in Barranquitas Municipio are married. The highest percentage of unmarried women with births falls into 20 to 34 years age bracket with 61.7% of them unmarried at the time of birth, while the lowest percentage of unmarried women with births belong to 15 to 19 years age bracket with 0.0% of them unmarried.
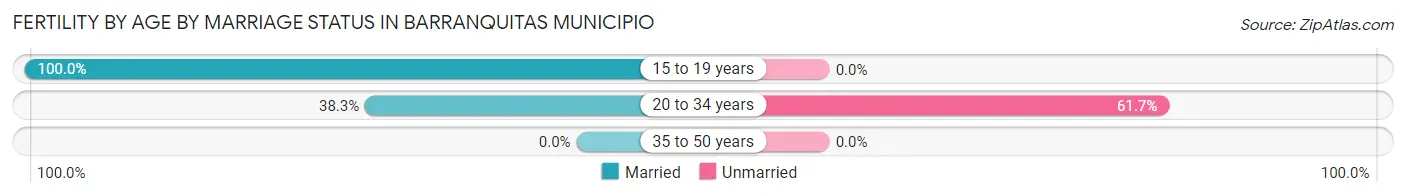
| Age Bracket | Married | Unmarried |
| 15 to 19 years | 12 (100.0%) | 0 (0.0%) |
| 20 to 34 years | 113 (38.3%) | 182 (61.7%) |
| 35 to 50 years | 0 (0.0%) | 0 (0.0%) |
| Total | 125 (40.7%) | 182 (59.3%) |
Fertility by Education in Barranquitas Municipio
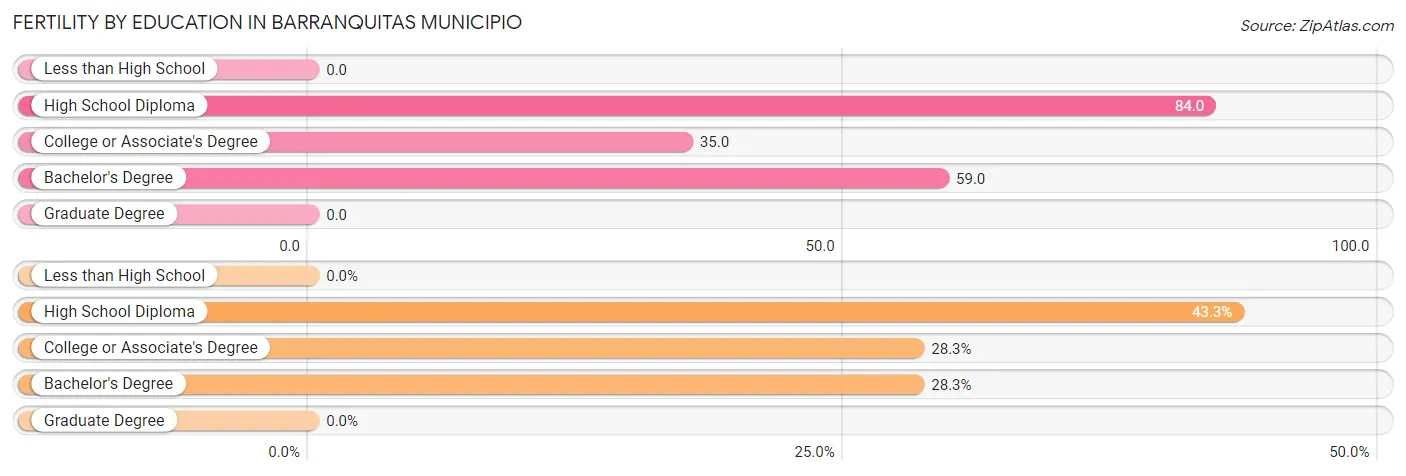
| Educational Attainment | Women with Births | Births / 1,000 Women |
| Less than High School | 0 (0.0%) | 0.0 |
| High School Diploma | 133 (43.3%) | 84.0 |
| College or Associate's Degree | 87 (28.3%) | 35.0 |
| Bachelor's Degree | 87 (28.3%) | 59.0 |
| Graduate Degree | 0 (0.0%) | 0.0 |
| Total | 307 (100.0%) | 46.0 |
Fertility by Education by Marriage Status in Barranquitas Municipio
59.3% of women with births in Barranquitas Municipio are unmarried. Women with the educational attainment of bachelor's degree are most likely to be married with 100.0% of them married at childbirth, while women with the educational attainment of high school diploma are least likely to be married with 100.0% of them unmarried at childbirth.
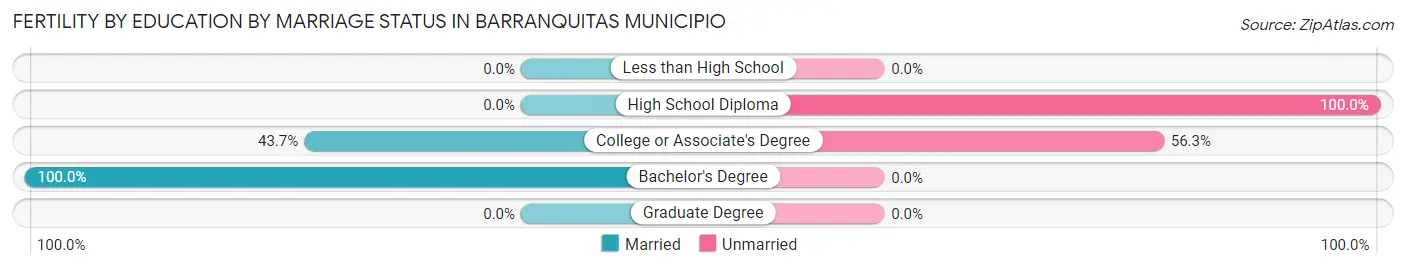
| Educational Attainment | Married | Unmarried |
| Less than High School | 0 (0.0%) | 0 (0.0%) |
| High School Diploma | 0 (0.0%) | 133 (100.0%) |
| College or Associate's Degree | 38 (43.7%) | 49 (56.3%) |
| Bachelor's Degree | 87 (100.0%) | 0 (0.0%) |
| Graduate Degree | 0 (0.0%) | 0 (0.0%) |
| Total | 125 (40.7%) | 182 (59.3%) |
Employment Characteristics in Barranquitas Municipio
Employment by Class of Employer in Barranquitas Municipio
Among the 8,609 employed individuals in Barranquitas Municipio, private company employees (5,128 | 59.6%), self-employed (incorporated) (1,081 | 12.6%), and state government employees (805 | 9.3%) make up the most common classes of employment.
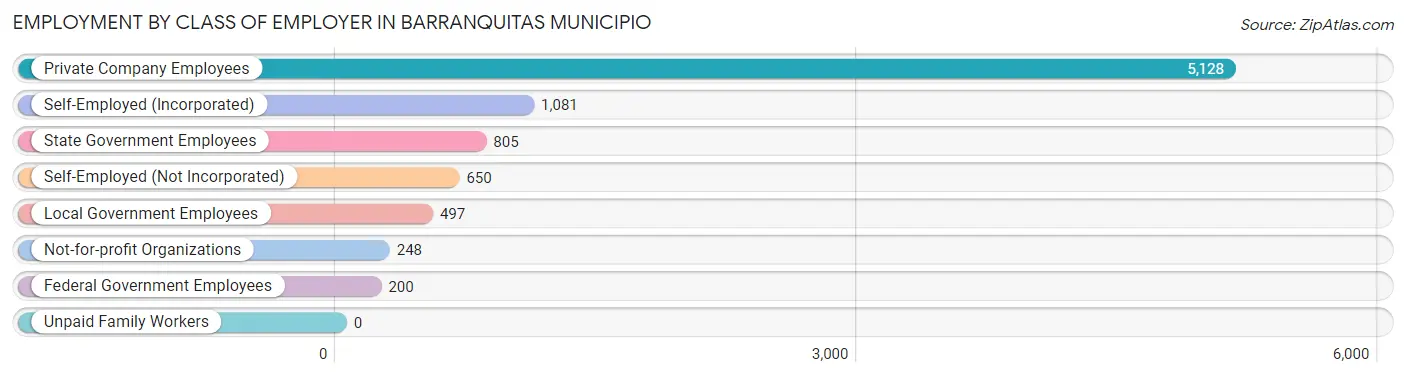
| Employer Class | # Employees | % Employees |
| Private Company Employees | 5,128 | 59.6% |
| Self-Employed (Incorporated) | 1,081 | 12.6% |
| Self-Employed (Not Incorporated) | 650 | 7.5% |
| Not-for-profit Organizations | 248 | 2.9% |
| Local Government Employees | 497 | 5.8% |
| State Government Employees | 805 | 9.3% |
| Federal Government Employees | 200 | 2.3% |
| Unpaid Family Workers | 0 | 0.0% |
| Total | 8,609 | 100.0% |
Employment Status by Age in Barranquitas Municipio
According to the labor force statistics for Barranquitas Municipio, out of the total population over 16 years of age (23,743), 43.7% or 10,376 individuals are in the labor force, with 15.5% or 1,608 of them unemployed. The age group with the highest labor force participation rate is 30 to 34 years, with 80.6% or 1,547 individuals in the labor force. Within the labor force, the 16 to 19 years age range has the highest percentage of unemployed individuals, with 81.0% or 111 of them being unemployed.
| Age Bracket | In Labor Force | Unemployed |
| 16 to 19 Years | 137 (9.3%) | 111 (81.0%) |
| 20 to 24 Years | 1,152 (55.0%) | 431 (37.4%) |
| 25 to 29 Years | 1,625 (77.0%) | 193 (11.9%) |
| 30 to 34 Years | 1,547 (80.6%) | 200 (12.9%) |
| 35 to 44 Years | 2,627 (74.3%) | 342 (13.0%) |
| 45 to 54 Years | 1,789 (52.0%) | 161 (9.0%) |
| 55 to 59 Years | 1,106 (49.1%) | 160 (14.5%) |
| 60 to 64 Years | 229 (13.1%) | 0 (0.0%) |
| 65 to 74 Years | 126 (4.3%) | 13 (10.4%) |
| 75 Years and over | 36 (1.6%) | 0 (0.0%) |
| Total | 10,376 (43.7%) | 1,608 (15.5%) |
Employment Status by Educational Attainment in Barranquitas Municipio
According to labor force statistics for Barranquitas Municipio, 59.5% of individuals (8,927) out of the total population between 25 and 64 years of age (15,004) are in the labor force, with 11.8% or 1,053 of them being unemployed. The group with the highest labor force participation rate are those with the educational attainment of bachelor's degree or higher, with 72.9% or 2,668 individuals in the labor force. Within the labor force, individuals with high school diploma education have the highest percentage of unemployment, with 16.9% or 469 of them being unemployed.
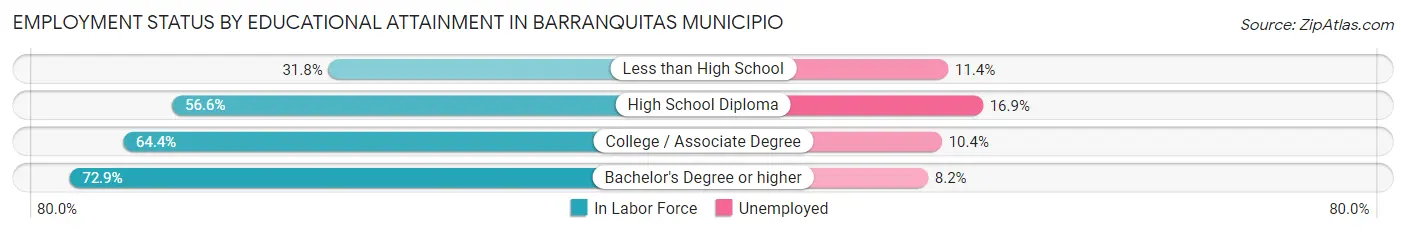
| Educational Attainment | In Labor Force | Unemployed |
| Less than High School | 650 (31.8%) | 233 (11.4%) |
| High School Diploma | 2,775 (56.6%) | 829 (16.9%) |
| College / Associate Degree | 2,831 (64.4%) | 457 (10.4%) |
| Bachelor's Degree or higher | 2,668 (72.9%) | 300 (8.2%) |
| Total | 8,927 (59.5%) | 1,770 (11.8%) |
Employment Occupations by Sex in Barranquitas Municipio
Management, Business, Science and Arts Occupations
The most common Management, Business, Science and Arts occupations in Barranquitas Municipio are Health Diagnosing & Treating (804 | 9.2%), Health Technologists (677 | 7.7%), Community & Social Service (571 | 6.5%), Education Instruction & Library (437 | 5.0%), and Management (308 | 3.5%).
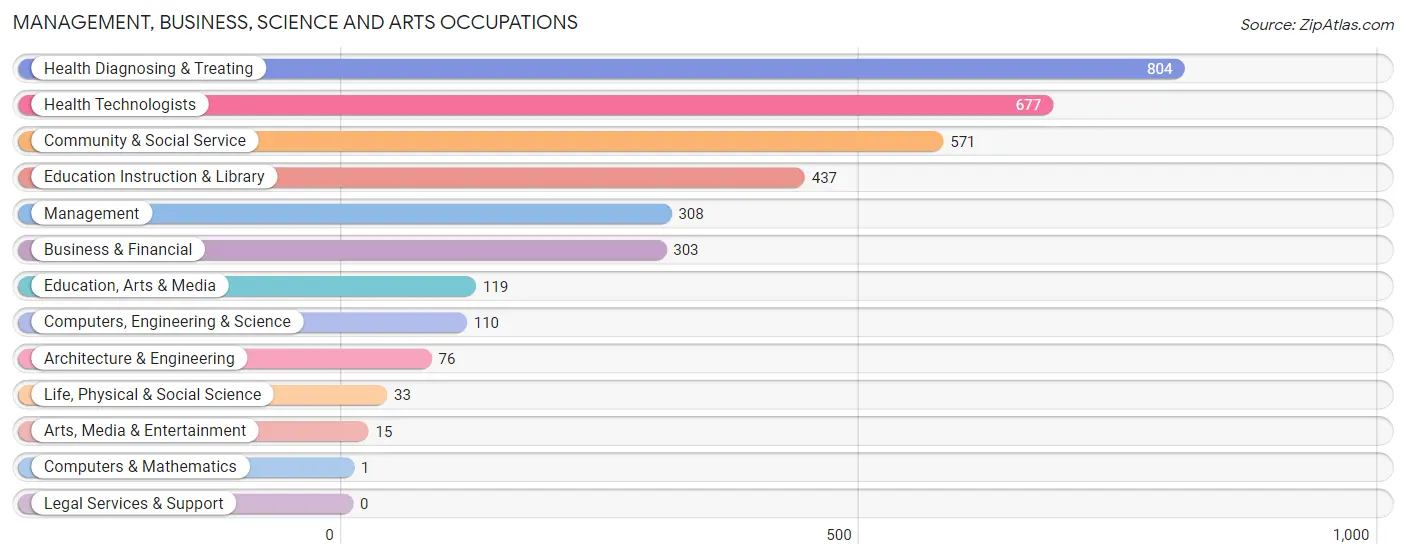
Management, Business, Science and Arts Occupations by Sex
Within the Management, Business, Science and Arts occupations in Barranquitas Municipio, the most male-oriented occupations are Computers & Mathematics (100.0%), Architecture & Engineering (100.0%), and Arts, Media & Entertainment (100.0%), while the most female-oriented occupations are Education Instruction & Library (69.8%), Health Diagnosing & Treating (66.2%), and Business & Financial (65.0%).
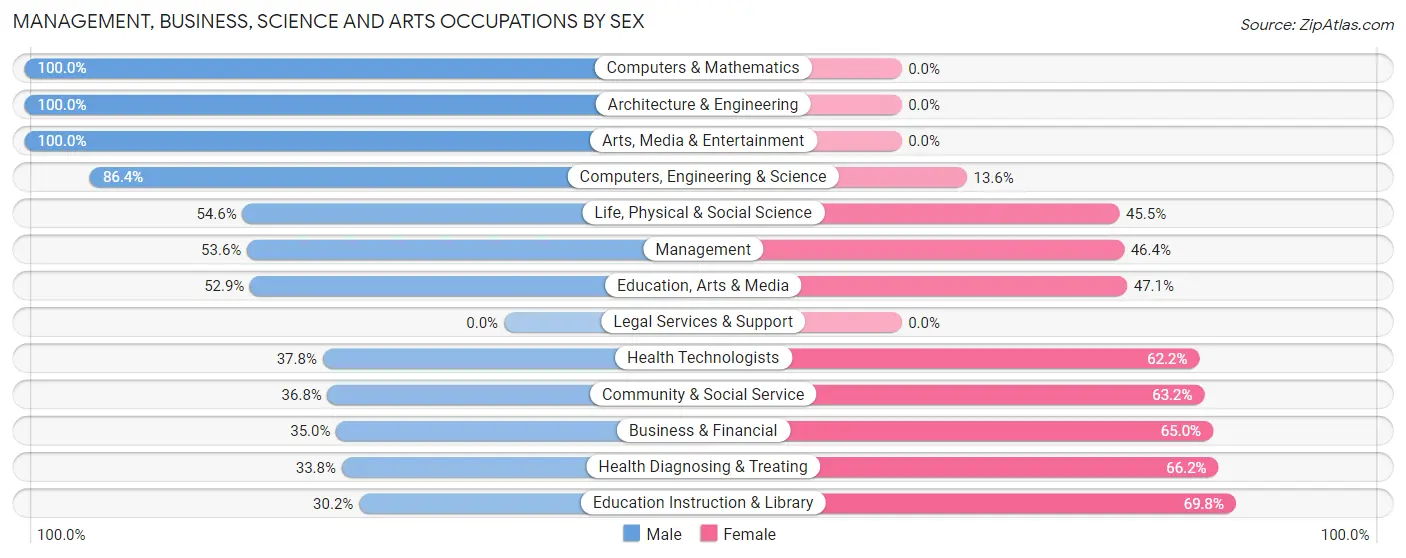
| Occupation | Male | Female |
| Management | 165 (53.6%) | 143 (46.4%) |
| Business & Financial | 106 (35.0%) | 197 (65.0%) |
| Computers, Engineering & Science | 95 (86.4%) | 15 (13.6%) |
| Computers & Mathematics | 1 (100.0%) | 0 (0.0%) |
| Architecture & Engineering | 76 (100.0%) | 0 (0.0%) |
| Life, Physical & Social Science | 18 (54.5%) | 15 (45.5%) |
| Community & Social Service | 210 (36.8%) | 361 (63.2%) |
| Education, Arts & Media | 63 (52.9%) | 56 (47.1%) |
| Legal Services & Support | 0 (0.0%) | 0 (0.0%) |
| Education Instruction & Library | 132 (30.2%) | 305 (69.8%) |
| Arts, Media & Entertainment | 15 (100.0%) | 0 (0.0%) |
| Health Diagnosing & Treating | 272 (33.8%) | 532 (66.2%) |
| Health Technologists | 256 (37.8%) | 421 (62.2%) |
| Total (Category) | 848 (40.5%) | 1,248 (59.5%) |
| Total (Overall) | 5,324 (60.8%) | 3,435 (39.2%) |
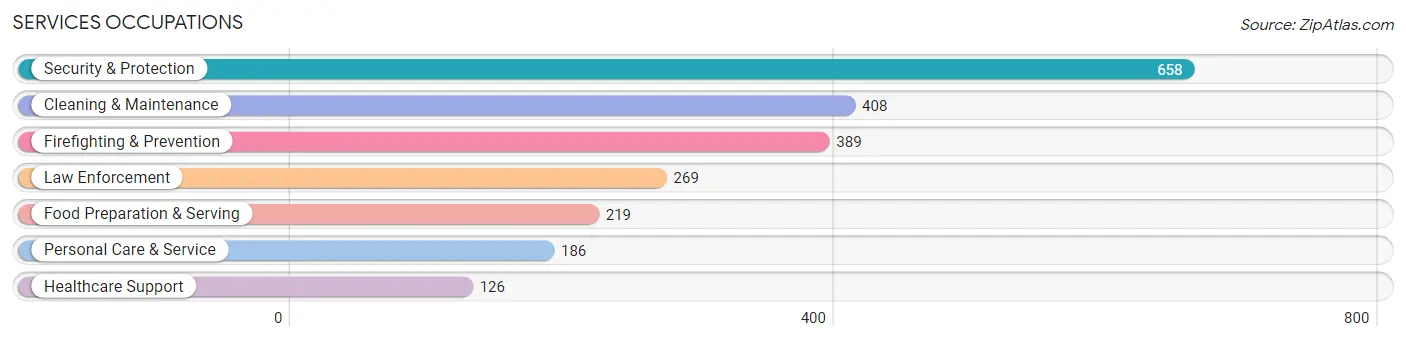
Services Occupations
The most common Services occupations in Barranquitas Municipio are Security & Protection (658 | 7.5%), Cleaning & Maintenance (408 | 4.7%), Firefighting & Prevention (389 | 4.4%), Law Enforcement (269 | 3.1%), and Food Preparation & Serving (219 | 2.5%).
Services Occupations by Sex
Within the Services occupations in Barranquitas Municipio, the most male-oriented occupations are Firefighting & Prevention (87.7%), Security & Protection (87.1%), and Law Enforcement (86.3%), while the most female-oriented occupations are Food Preparation & Serving (78.5%), Healthcare Support (70.6%), and Personal Care & Service (42.5%).
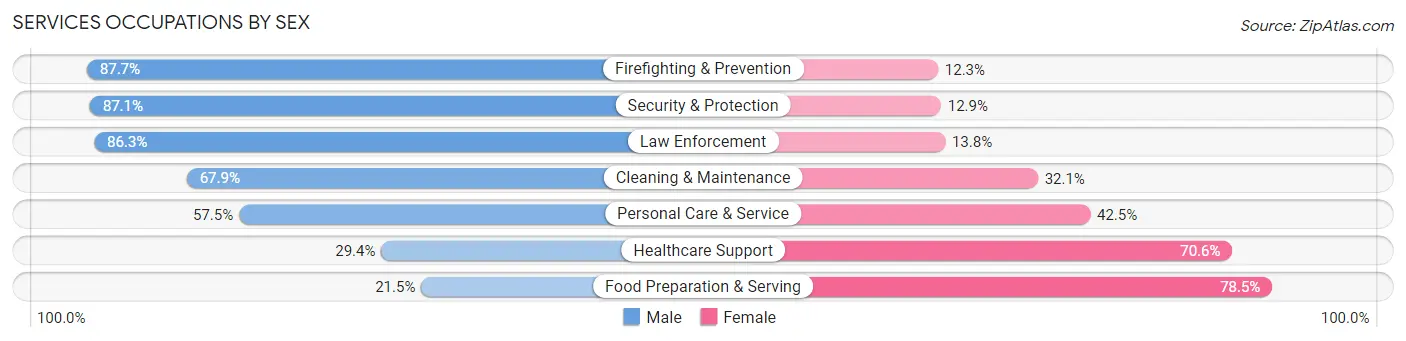
| Occupation | Male | Female |
| Healthcare Support | 37 (29.4%) | 89 (70.6%) |
| Security & Protection | 573 (87.1%) | 85 (12.9%) |
| Firefighting & Prevention | 341 (87.7%) | 48 (12.3%) |
| Law Enforcement | 232 (86.3%) | 37 (13.8%) |
| Food Preparation & Serving | 47 (21.5%) | 172 (78.5%) |
| Cleaning & Maintenance | 277 (67.9%) | 131 (32.1%) |
| Personal Care & Service | 107 (57.5%) | 79 (42.5%) |
| Total (Category) | 1,041 (65.2%) | 556 (34.8%) |
| Total (Overall) | 5,324 (60.8%) | 3,435 (39.2%) |
Sales and Office Occupations
The most common Sales and Office occupations in Barranquitas Municipio are Sales & Related (1,273 | 14.5%), and Office & Administration (1,048 | 12.0%).

Sales and Office Occupations by Sex

| Occupation | Male | Female |
| Sales & Related | 505 (39.7%) | 768 (60.3%) |
| Office & Administration | 561 (53.5%) | 487 (46.5%) |
| Total (Category) | 1,066 (45.9%) | 1,255 (54.1%) |
| Total (Overall) | 5,324 (60.8%) | 3,435 (39.2%) |
Natural Resources, Construction and Maintenance Occupations
The most common Natural Resources, Construction and Maintenance occupations in Barranquitas Municipio are Construction & Extraction (1,003 | 11.5%), Farming, Fishing & Forestry (175 | 2.0%), and Installation, Maintenance & Repair (130 | 1.5%).

Natural Resources, Construction and Maintenance Occupations by Sex
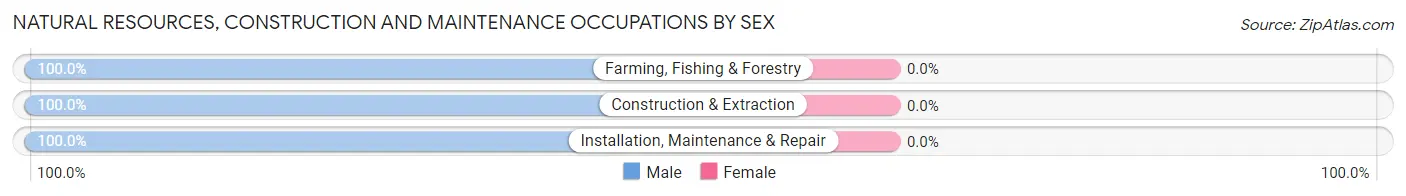
| Occupation | Male | Female |
| Farming, Fishing & Forestry | 175 (100.0%) | 0 (0.0%) |
| Construction & Extraction | 1,003 (100.0%) | 0 (0.0%) |
| Installation, Maintenance & Repair | 130 (100.0%) | 0 (0.0%) |
| Total (Category) | 1,308 (100.0%) | 0 (0.0%) |
| Total (Overall) | 5,324 (60.8%) | 3,435 (39.2%) |
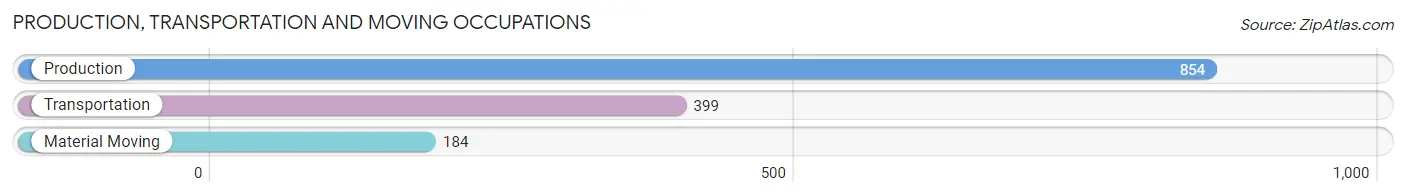
Production, Transportation and Moving Occupations
The most common Production, Transportation and Moving occupations in Barranquitas Municipio are Production (854 | 9.8%), Transportation (399 | 4.6%), and Material Moving (184 | 2.1%).
Production, Transportation and Moving Occupations by Sex
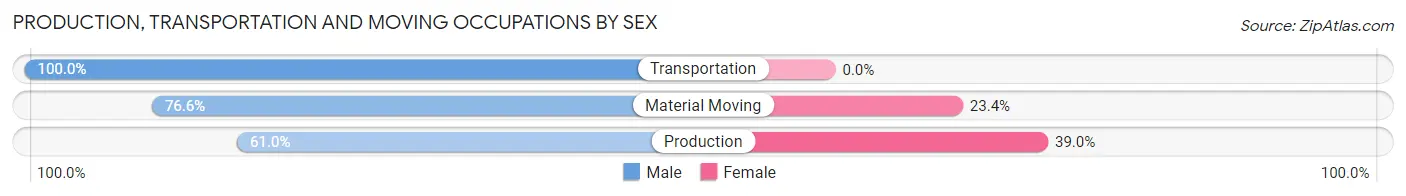
| Occupation | Male | Female |
| Production | 521 (61.0%) | 333 (39.0%) |
| Transportation | 399 (100.0%) | 0 (0.0%) |
| Material Moving | 141 (76.6%) | 43 (23.4%) |
| Total (Category) | 1,061 (73.8%) | 376 (26.2%) |
| Total (Overall) | 5,324 (60.8%) | 3,435 (39.2%) |
Employment Industries by Sex in Barranquitas Municipio
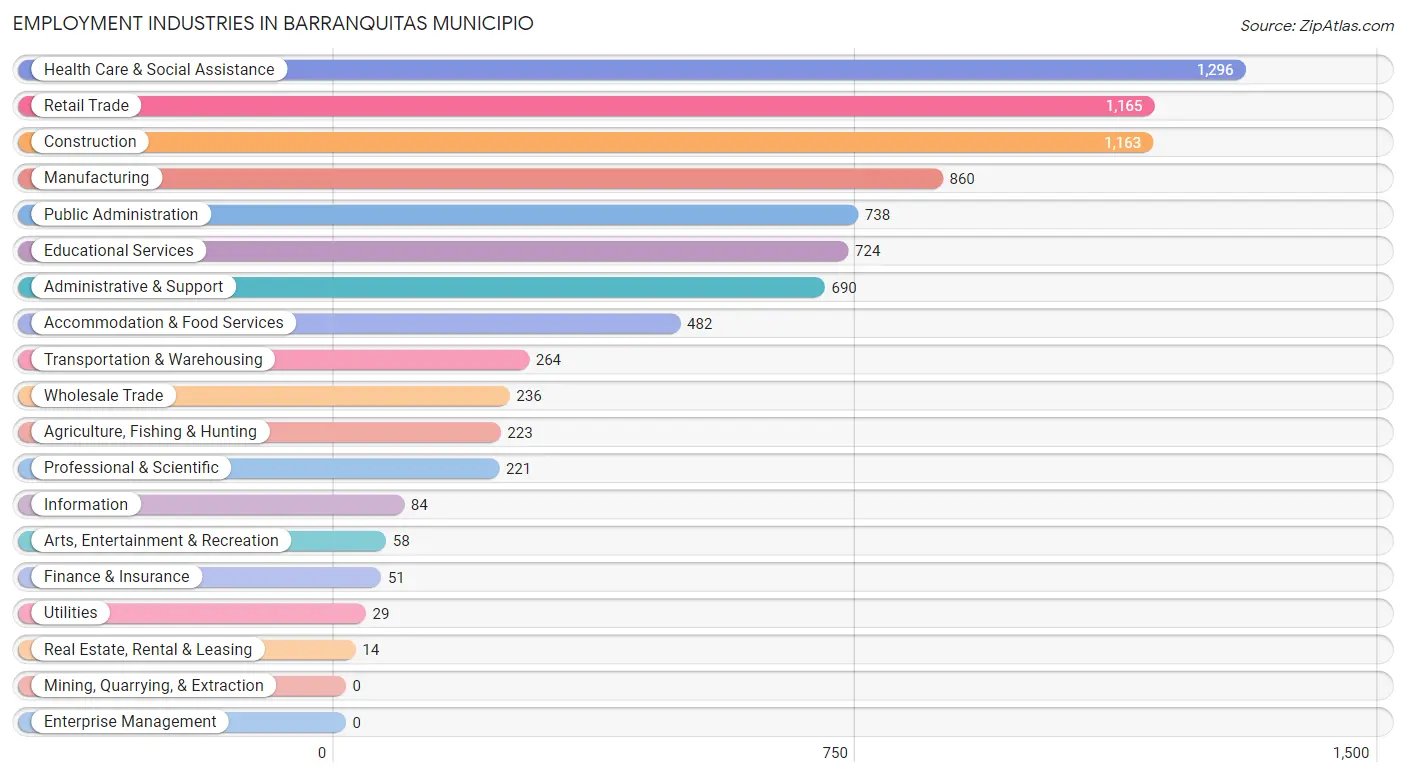
Employment Industries in Barranquitas Municipio
The major employment industries in Barranquitas Municipio include Health Care & Social Assistance (1,296 | 14.8%), Retail Trade (1,165 | 13.3%), Construction (1,163 | 13.3%), Manufacturing (860 | 9.8%), and Public Administration (738 | 8.4%).
Employment Industries by Sex in Barranquitas Municipio
The Barranquitas Municipio industries that see more men than women are Agriculture, Fishing & Hunting (100.0%), Construction (100.0%), and Wholesale Trade (100.0%), whereas the industries that tend to have a higher number of women are Accommodation & Food Services (82.2%), Educational Services (71.6%), and Professional & Scientific (70.1%).
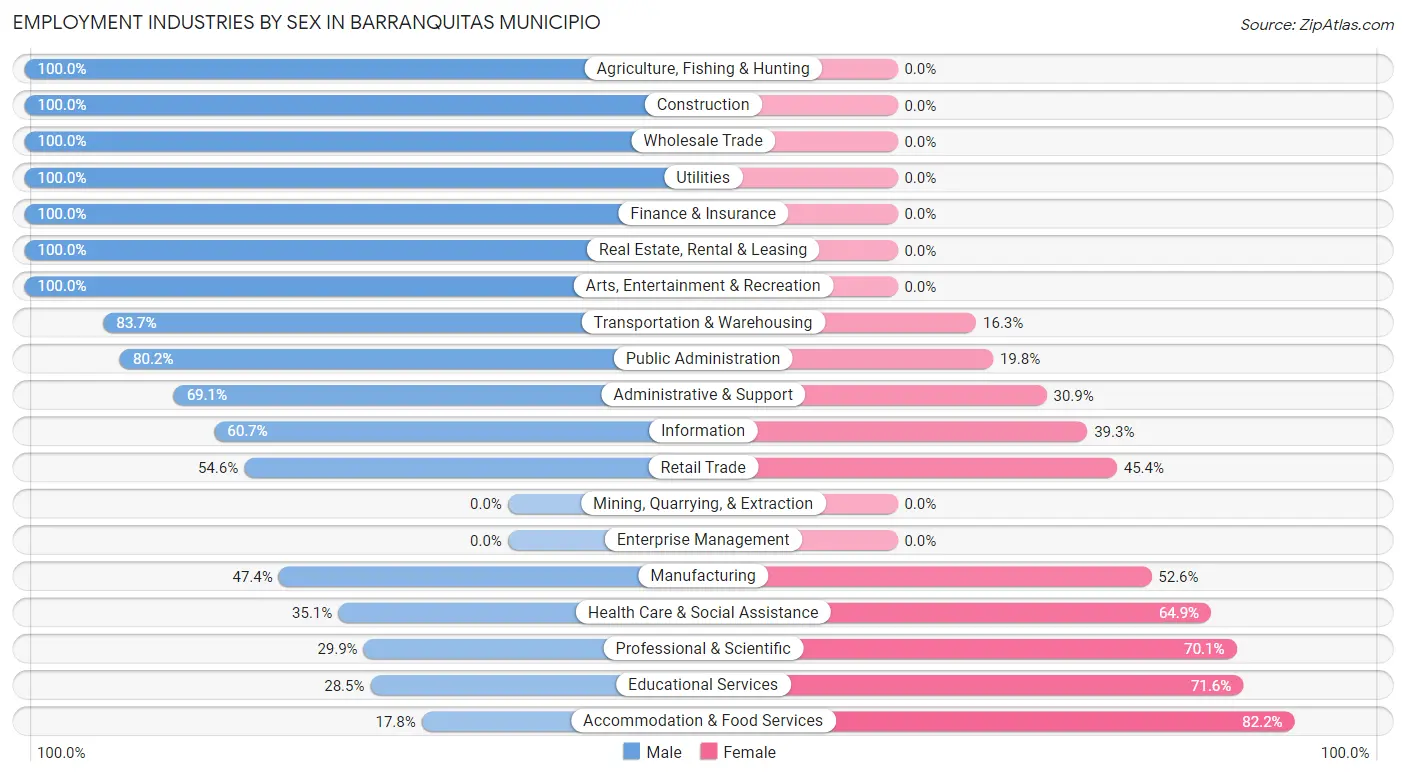
| Industry | Male | Female |
| Agriculture, Fishing & Hunting | 223 (100.0%) | 0 (0.0%) |
| Mining, Quarrying, & Extraction | 0 (0.0%) | 0 (0.0%) |
| Construction | 1,163 (100.0%) | 0 (0.0%) |
| Manufacturing | 408 (47.4%) | 452 (52.6%) |
| Wholesale Trade | 236 (100.0%) | 0 (0.0%) |
| Retail Trade | 636 (54.6%) | 529 (45.4%) |
| Transportation & Warehousing | 221 (83.7%) | 43 (16.3%) |
| Utilities | 29 (100.0%) | 0 (0.0%) |
| Information | 51 (60.7%) | 33 (39.3%) |
| Finance & Insurance | 51 (100.0%) | 0 (0.0%) |
| Real Estate, Rental & Leasing | 14 (100.0%) | 0 (0.0%) |
| Professional & Scientific | 66 (29.9%) | 155 (70.1%) |
| Enterprise Management | 0 (0.0%) | 0 (0.0%) |
| Administrative & Support | 477 (69.1%) | 213 (30.9%) |
| Educational Services | 206 (28.4%) | 518 (71.6%) |
| Health Care & Social Assistance | 455 (35.1%) | 841 (64.9%) |
| Arts, Entertainment & Recreation | 58 (100.0%) | 0 (0.0%) |
| Accommodation & Food Services | 86 (17.8%) | 396 (82.2%) |
| Public Administration | 592 (80.2%) | 146 (19.8%) |
| Total | 5,324 (60.8%) | 3,435 (39.2%) |
Education in Barranquitas Municipio
School Enrollment in Barranquitas Municipio
The most common levels of schooling among the 7,068 students in Barranquitas Municipio are college / undergraduate (1,805 | 25.5%), high school (1,672 | 23.7%), and middle school (1,381 | 19.5%).
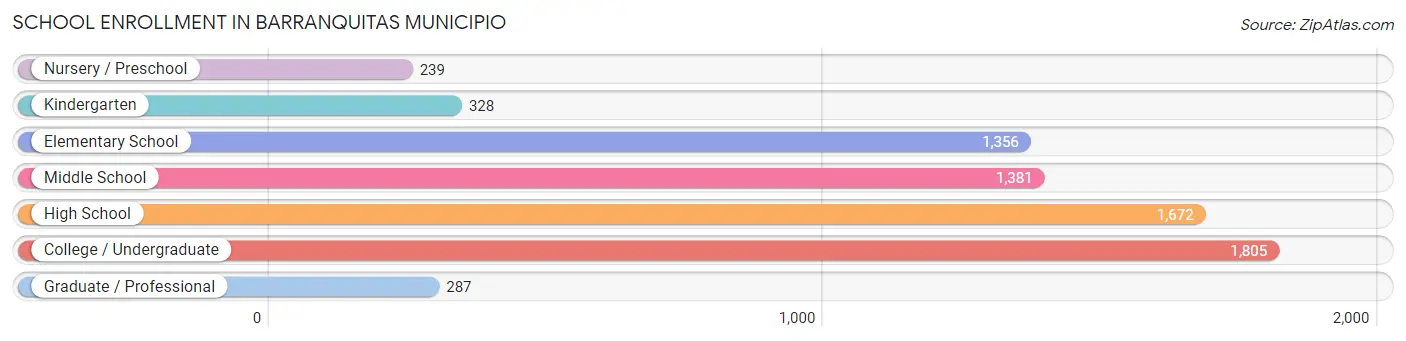
| School Level | # Students | % Students |
| Nursery / Preschool | 239 | 3.4% |
| Kindergarten | 328 | 4.6% |
| Elementary School | 1,356 | 19.2% |
| Middle School | 1,381 | 19.5% |
| High School | 1,672 | 23.7% |
| College / Undergraduate | 1,805 | 25.5% |
| Graduate / Professional | 287 | 4.1% |
| Total | 7,068 | 100.0% |
School Enrollment by Age by Funding Source in Barranquitas Municipio
Out of a total of 7,068 students who are enrolled in schools in Barranquitas Municipio, 1,965 (27.8%) attend a private institution, while the remaining 5,103 (72.2%) are enrolled in public schools. The age group of 25 to 34 year olds has the highest likelihood of being enrolled in private schools, with 449 (78.4% in the age bracket) enrolled. Conversely, the age group of 10 to 14 year olds has the lowest likelihood of being enrolled in a private school, with 1,716 (97.0% in the age bracket) attending a public institution.
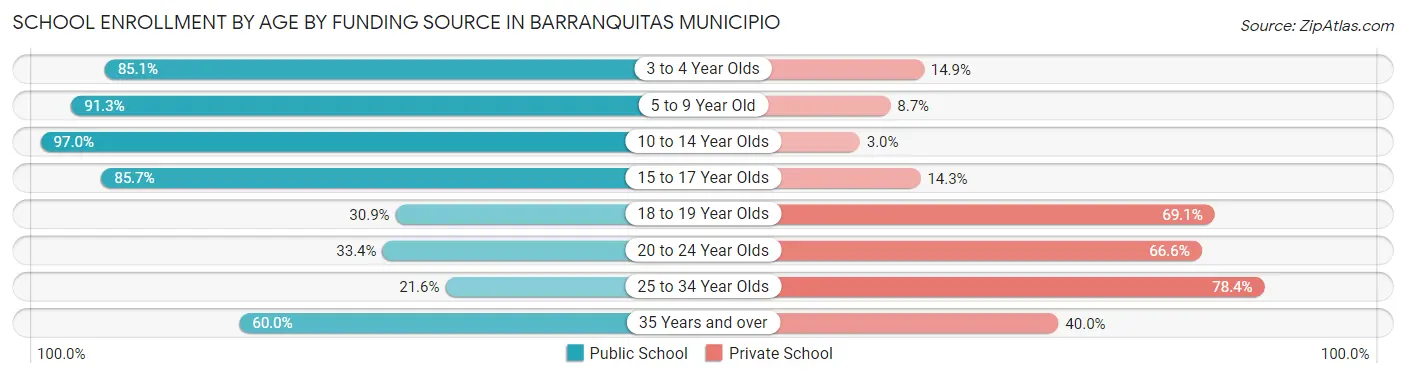
| Age Bracket | Public School | Private School |
| 3 to 4 Year Olds | 188 (85.1%) | 33 (14.9%) |
| 5 to 9 Year Old | 1,554 (91.3%) | 148 (8.7%) |
| 10 to 14 Year Olds | 1,716 (97.0%) | 53 (3.0%) |
| 15 to 17 Year Olds | 953 (85.7%) | 159 (14.3%) |
| 18 to 19 Year Olds | 150 (30.9%) | 335 (69.1%) |
| 20 to 24 Year Olds | 379 (33.4%) | 757 (66.6%) |
| 25 to 34 Year Olds | 124 (21.6%) | 449 (78.4%) |
| 35 Years and over | 42 (60.0%) | 28 (40.0%) |
| Total | 5,103 (72.2%) | 1,965 (27.8%) |
Educational Attainment by Field of Study in Barranquitas Municipio
Education (1,305 | 28.8%), business (1,079 | 23.8%), science & technology (1,036 | 22.8%), arts & humanities (255 | 5.6%), and engineering (223 | 4.9%) are the most common fields of study among 4,538 individuals in Barranquitas Municipio who have obtained a bachelor's degree or higher.
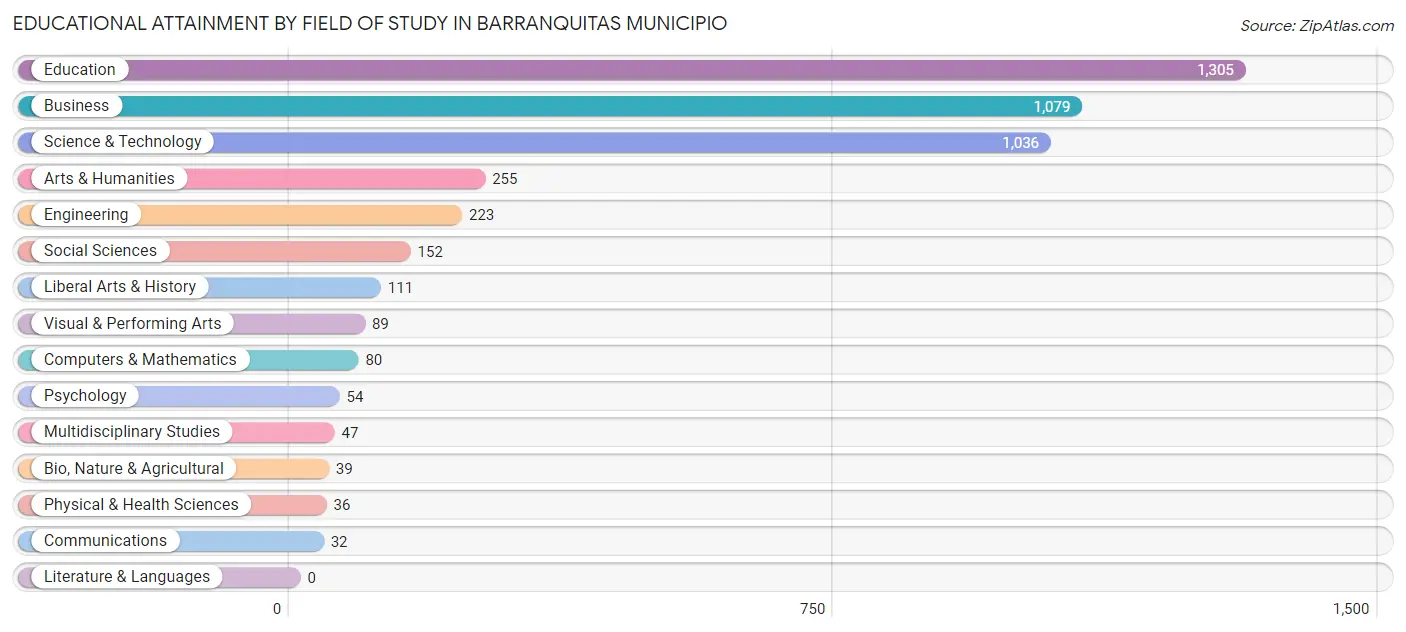
| Field of Study | # Graduates | % Graduates |
| Computers & Mathematics | 80 | 1.8% |
| Bio, Nature & Agricultural | 39 | 0.9% |
| Physical & Health Sciences | 36 | 0.8% |
| Psychology | 54 | 1.2% |
| Social Sciences | 152 | 3.4% |
| Engineering | 223 | 4.9% |
| Multidisciplinary Studies | 47 | 1.0% |
| Science & Technology | 1,036 | 22.8% |
| Business | 1,079 | 23.8% |
| Education | 1,305 | 28.8% |
| Literature & Languages | 0 | 0.0% |
| Liberal Arts & History | 111 | 2.5% |
| Visual & Performing Arts | 89 | 2.0% |
| Communications | 32 | 0.7% |
| Arts & Humanities | 255 | 5.6% |
| Total | 4,538 | 100.0% |
Transportation & Commute in Barranquitas Municipio
Vehicle Availability by Sex in Barranquitas Municipio
The most prevalent vehicle ownership categories in Barranquitas Municipio are males with 2 vehicles (1,935, accounting for 36.8%) and females with 2 vehicles (980, making up 58.0%).
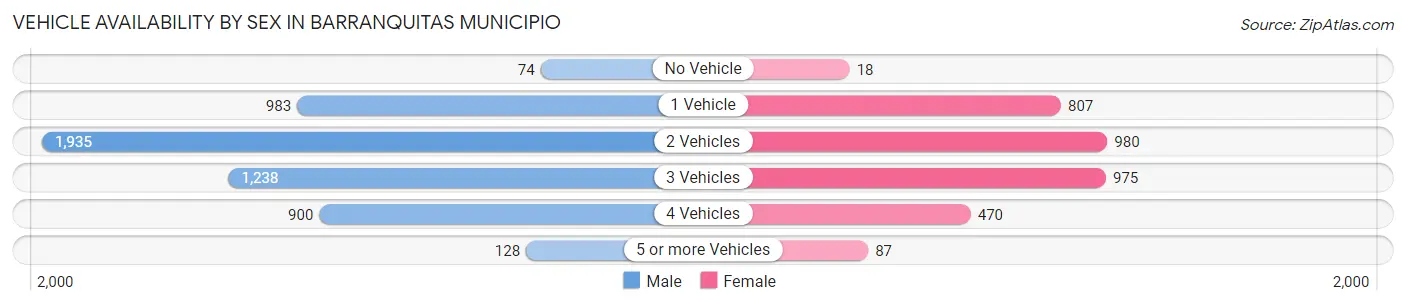
| Vehicles Available | Male | Female |
| No Vehicle | 74 (1.4%) | 18 (0.5%) |
| 1 Vehicle | 983 (18.7%) | 807 (24.2%) |
| 2 Vehicles | 1,935 (36.8%) | 980 (29.4%) |
| 3 Vehicles | 1,238 (23.5%) | 975 (29.2%) |
| 4 Vehicles | 900 (17.1%) | 470 (14.1%) |
| 5 or more Vehicles | 128 (2.4%) | 87 (2.6%) |
| Total | 5,258 (100.0%) | 3,337 (100.0%) |
Commute Time in Barranquitas Municipio
The most frequently occuring commute durations in Barranquitas Municipio are 15 to 19 minutes (1,289 commuters, 15.1%), 30 to 34 minutes (1,126 commuters, 13.2%), and 10 to 14 minutes (1,104 commuters, 13.0%).
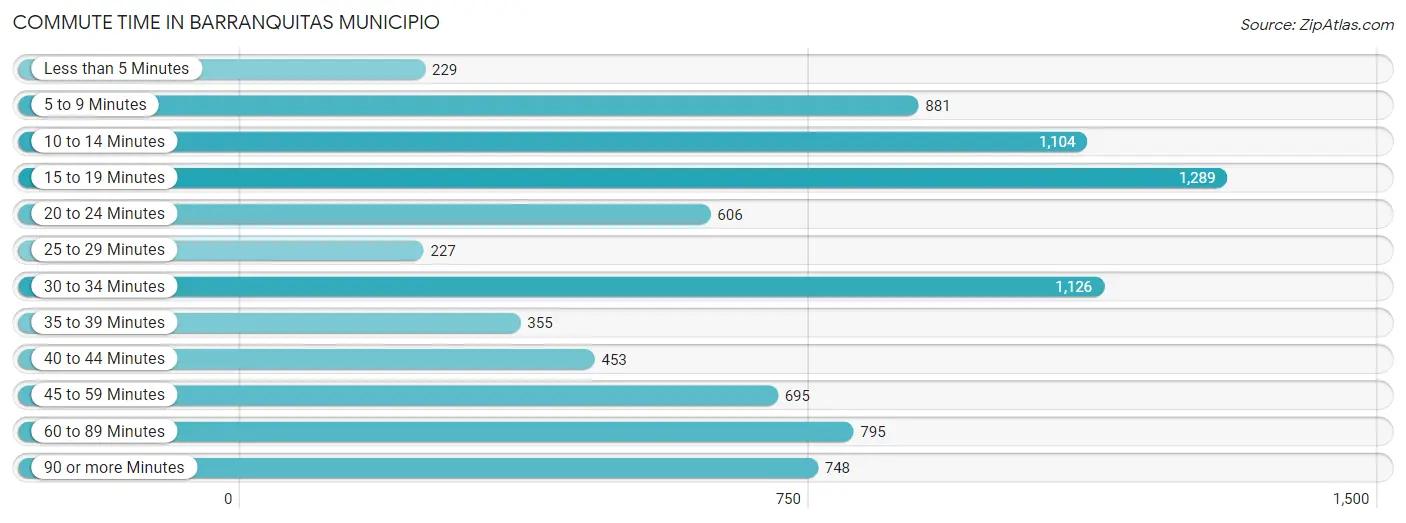
| Commute Time | # Commuters | % Commuters |
| Less than 5 Minutes | 229 | 2.7% |
| 5 to 9 Minutes | 881 | 10.3% |
| 10 to 14 Minutes | 1,104 | 13.0% |
| 15 to 19 Minutes | 1,289 | 15.1% |
| 20 to 24 Minutes | 606 | 7.1% |
| 25 to 29 Minutes | 227 | 2.7% |
| 30 to 34 Minutes | 1,126 | 13.2% |
| 35 to 39 Minutes | 355 | 4.2% |
| 40 to 44 Minutes | 453 | 5.3% |
| 45 to 59 Minutes | 695 | 8.2% |
| 60 to 89 Minutes | 795 | 9.3% |
| 90 or more Minutes | 748 | 8.8% |
Commute Time by Sex in Barranquitas Municipio
The most common commute times in Barranquitas Municipio are 10 to 14 minutes (909 commuters, 17.5%) for males and 15 to 19 minutes (631 commuters, 19.1%) for females.
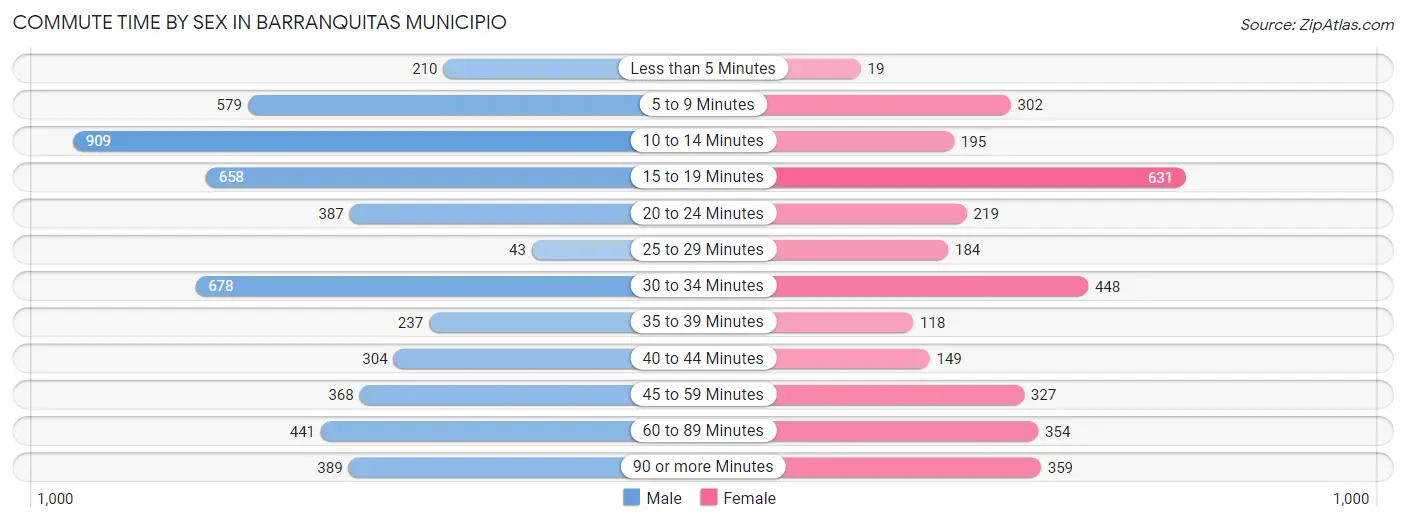
| Commute Time | Male | Female |
| Less than 5 Minutes | 210 (4.0%) | 19 (0.6%) |
| 5 to 9 Minutes | 579 (11.1%) | 302 (9.1%) |
| 10 to 14 Minutes | 909 (17.5%) | 195 (5.9%) |
| 15 to 19 Minutes | 658 (12.7%) | 631 (19.1%) |
| 20 to 24 Minutes | 387 (7.4%) | 219 (6.6%) |
| 25 to 29 Minutes | 43 (0.8%) | 184 (5.6%) |
| 30 to 34 Minutes | 678 (13.0%) | 448 (13.6%) |
| 35 to 39 Minutes | 237 (4.6%) | 118 (3.6%) |
| 40 to 44 Minutes | 304 (5.8%) | 149 (4.5%) |
| 45 to 59 Minutes | 368 (7.1%) | 327 (9.9%) |
| 60 to 89 Minutes | 441 (8.5%) | 354 (10.7%) |
| 90 or more Minutes | 389 (7.5%) | 359 (10.9%) |
Time of Departure to Work by Sex in Barranquitas Municipio
The most frequent times of departure to work in Barranquitas Municipio are 7:00 AM to 7:29 AM (1,166, 22.4%) for males and 6:00 AM to 6:29 AM (688, 20.8%) for females.
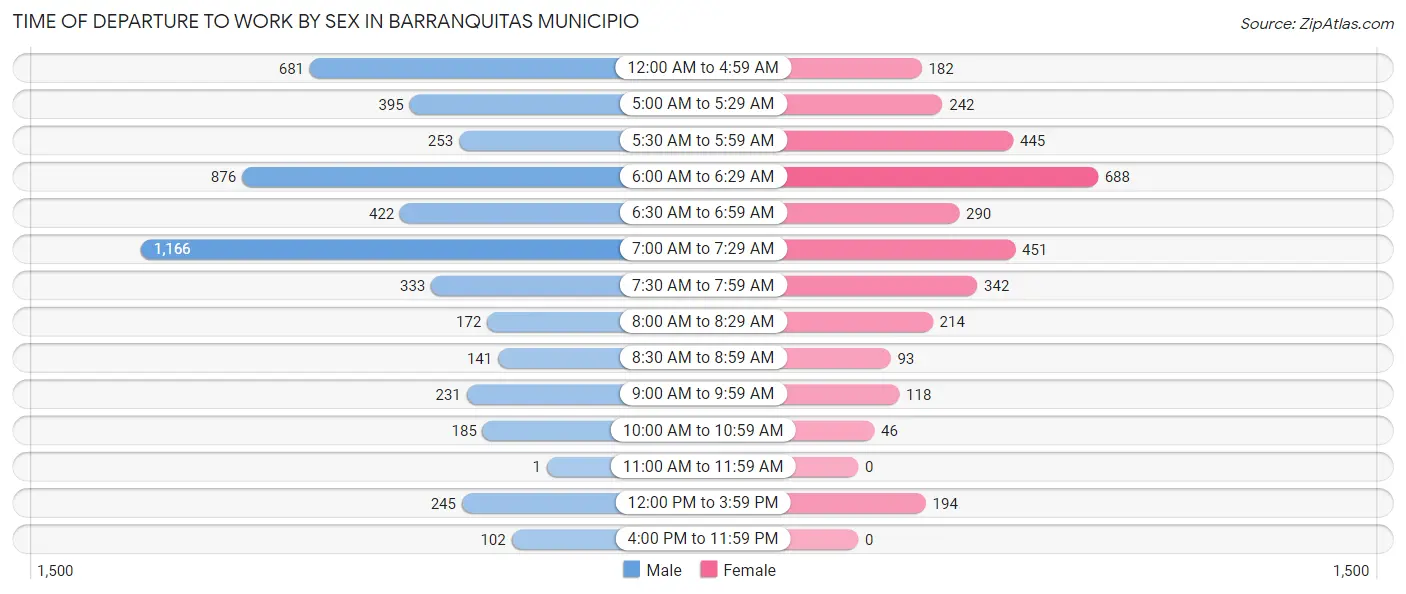
| Time of Departure | Male | Female |
| 12:00 AM to 4:59 AM | 681 (13.1%) | 182 (5.5%) |
| 5:00 AM to 5:29 AM | 395 (7.6%) | 242 (7.3%) |
| 5:30 AM to 5:59 AM | 253 (4.9%) | 445 (13.5%) |
| 6:00 AM to 6:29 AM | 876 (16.8%) | 688 (20.8%) |
| 6:30 AM to 6:59 AM | 422 (8.1%) | 290 (8.8%) |
| 7:00 AM to 7:29 AM | 1,166 (22.4%) | 451 (13.7%) |
| 7:30 AM to 7:59 AM | 333 (6.4%) | 342 (10.3%) |
| 8:00 AM to 8:29 AM | 172 (3.3%) | 214 (6.5%) |
| 8:30 AM to 8:59 AM | 141 (2.7%) | 93 (2.8%) |
| 9:00 AM to 9:59 AM | 231 (4.4%) | 118 (3.6%) |
| 10:00 AM to 10:59 AM | 185 (3.6%) | 46 (1.4%) |
| 11:00 AM to 11:59 AM | 1 (0.0%) | 0 (0.0%) |
| 12:00 PM to 3:59 PM | 245 (4.7%) | 194 (5.9%) |
| 4:00 PM to 11:59 PM | 102 (2.0%) | 0 (0.0%) |
| Total | 5,203 (100.0%) | 3,305 (100.0%) |
Housing Occupancy in Barranquitas Municipio
Occupancy by Ownership in Barranquitas Municipio
Of the total 9,098 dwellings in Barranquitas Municipio, owner-occupied units account for 6,149 (67.6%), while renter-occupied units make up 2,949 (32.4%).
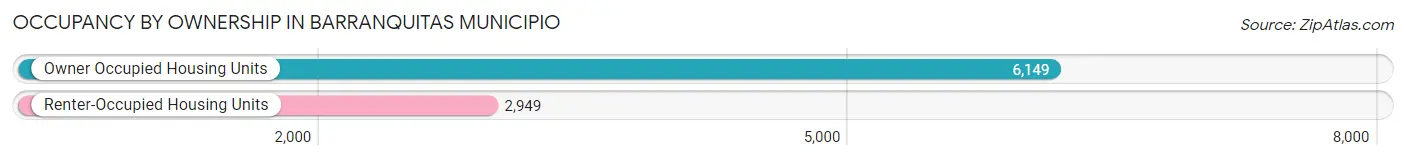
| Occupancy | # Housing Units | % Housing Units |
| Owner Occupied Housing Units | 6,149 | 67.6% |
| Renter-Occupied Housing Units | 2,949 | 32.4% |
| Total Occupied Housing Units | 9,098 | 100.0% |
Occupancy by Household Size in Barranquitas Municipio
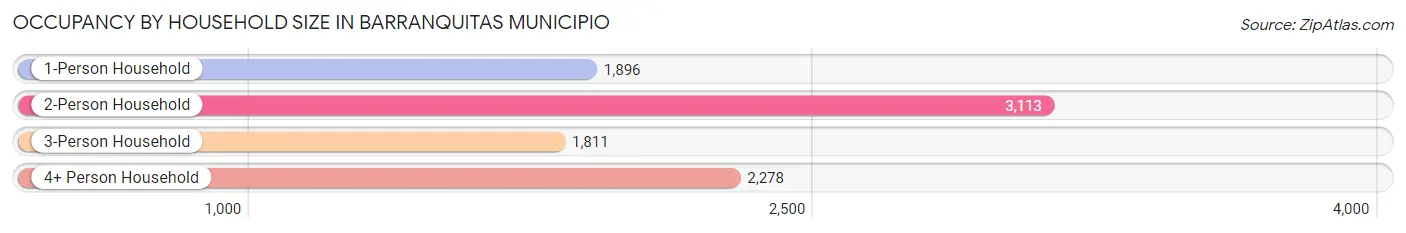
| Household Size | # Housing Units | % Housing Units |
| 1-Person Household | 1,896 | 20.8% |
| 2-Person Household | 3,113 | 34.2% |
| 3-Person Household | 1,811 | 19.9% |
| 4+ Person Household | 2,278 | 25.0% |
| Total Housing Units | 9,098 | 100.0% |
Occupancy by Ownership by Household Size in Barranquitas Municipio
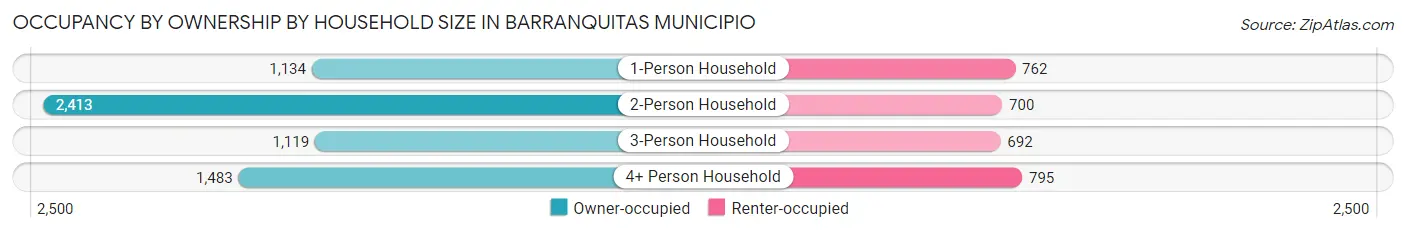
| Household Size | Owner-occupied | Renter-occupied |
| 1-Person Household | 1,134 (59.8%) | 762 (40.2%) |
| 2-Person Household | 2,413 (77.5%) | 700 (22.5%) |
| 3-Person Household | 1,119 (61.8%) | 692 (38.2%) |
| 4+ Person Household | 1,483 (65.1%) | 795 (34.9%) |
| Total Housing Units | 6,149 (67.6%) | 2,949 (32.4%) |
Occupancy by Educational Attainment in Barranquitas Municipio
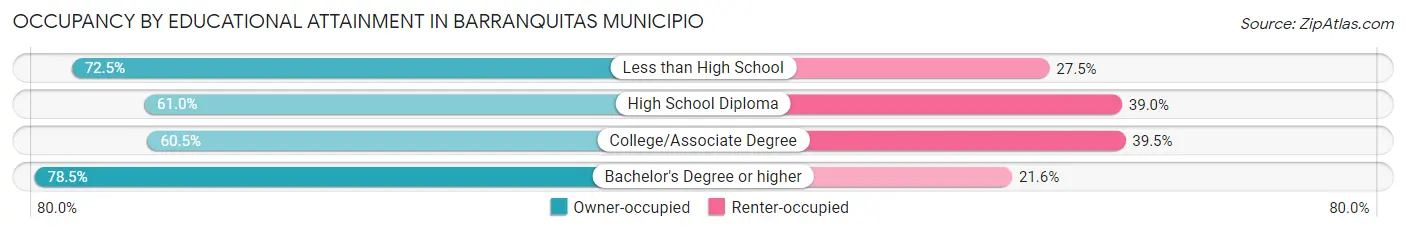
| Household Size | Owner-occupied | Renter-occupied |
| Less than High School | 1,554 (72.5%) | 589 (27.5%) |
| High School Diploma | 1,538 (61.0%) | 982 (39.0%) |
| College/Associate Degree | 1,422 (60.5%) | 929 (39.5%) |
| Bachelor's Degree or higher | 1,635 (78.4%) | 449 (21.5%) |
Occupancy by Age of Householder in Barranquitas Municipio
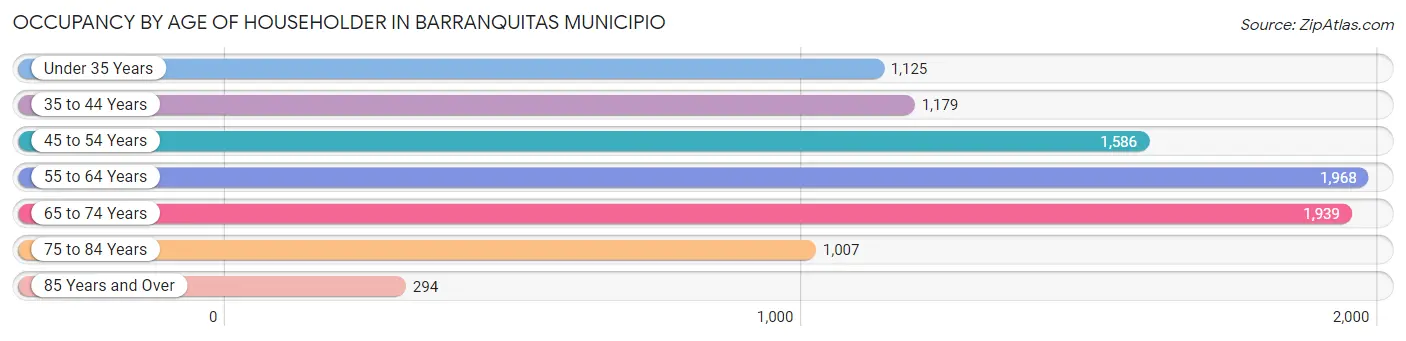
| Age Bracket | # Households | % Households |
| Under 35 Years | 1,125 | 12.4% |
| 35 to 44 Years | 1,179 | 13.0% |
| 45 to 54 Years | 1,586 | 17.4% |
| 55 to 64 Years | 1,968 | 21.6% |
| 65 to 74 Years | 1,939 | 21.3% |
| 75 to 84 Years | 1,007 | 11.1% |
| 85 Years and Over | 294 | 3.2% |
| Total | 9,098 | 100.0% |
Housing Finances in Barranquitas Municipio
Median Income by Occupancy in Barranquitas Municipio
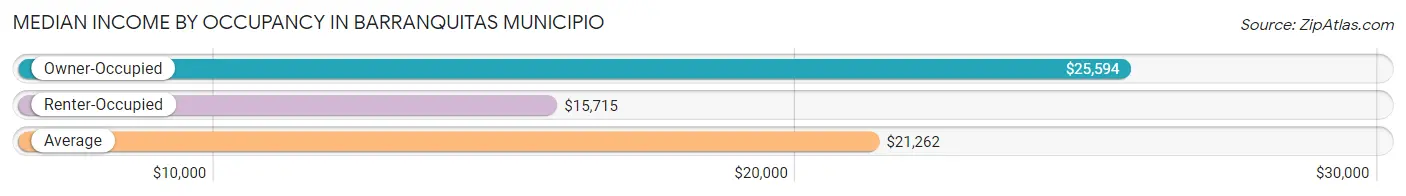
| Occupancy Type | # Households | Median Income |
| Owner-Occupied | 6,149 (67.6%) | $25,594 |
| Renter-Occupied | 2,949 (32.4%) | $15,715 |
| Average | 9,098 (100.0%) | $21,262 |
Occupancy by Householder Income Bracket in Barranquitas Municipio
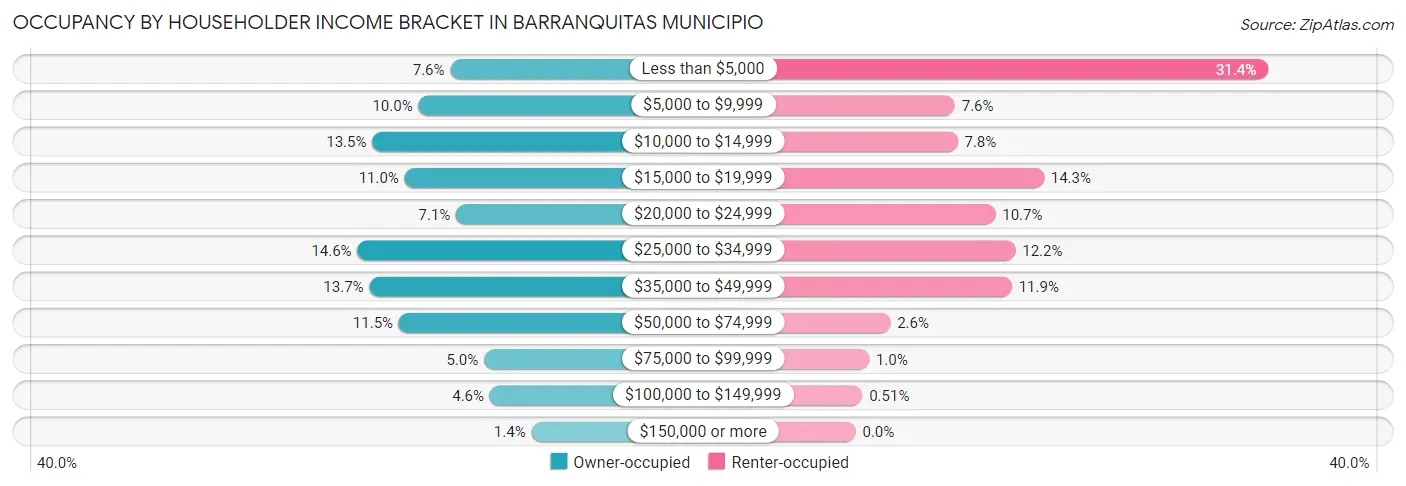
| Income Bracket | Owner-occupied | Renter-occupied |
| Less than $5,000 | 465 (7.6%) | 927 (31.4%) |
| $5,000 to $9,999 | 614 (10.0%) | 223 (7.6%) |
| $10,000 to $14,999 | 831 (13.5%) | 229 (7.8%) |
| $15,000 to $19,999 | 679 (11.0%) | 423 (14.3%) |
| $20,000 to $24,999 | 438 (7.1%) | 314 (10.6%) |
| $25,000 to $34,999 | 900 (14.6%) | 359 (12.2%) |
| $35,000 to $49,999 | 844 (13.7%) | 351 (11.9%) |
| $50,000 to $74,999 | 706 (11.5%) | 78 (2.6%) |
| $75,000 to $99,999 | 307 (5.0%) | 30 (1.0%) |
| $100,000 to $149,999 | 280 (4.5%) | 15 (0.5%) |
| $150,000 or more | 85 (1.4%) | 0 (0.0%) |
| Total | 6,149 (100.0%) | 2,949 (100.0%) |
Monthly Housing Cost Tiers in Barranquitas Municipio
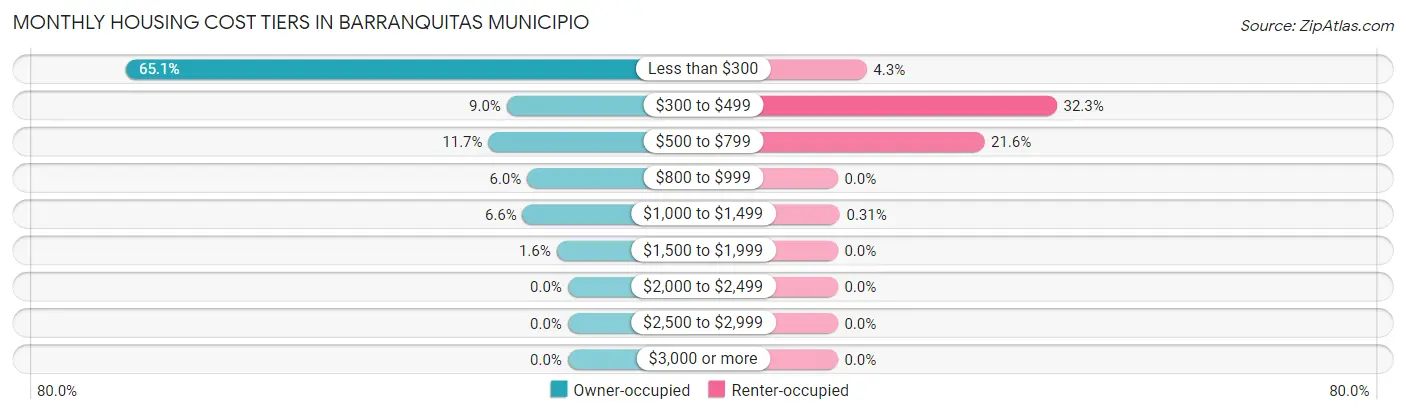
| Monthly Cost | Owner-occupied | Renter-occupied |
| Less than $300 | 4,000 (65.0%) | 126 (4.3%) |
| $300 to $499 | 553 (9.0%) | 952 (32.3%) |
| $500 to $799 | 719 (11.7%) | 637 (21.6%) |
| $800 to $999 | 368 (6.0%) | 0 (0.0%) |
| $1,000 to $1,499 | 408 (6.6%) | 9 (0.3%) |
| $1,500 to $1,999 | 101 (1.6%) | 0 (0.0%) |
| $2,000 to $2,499 | 0 (0.0%) | 0 (0.0%) |
| $2,500 to $2,999 | 0 (0.0%) | 0 (0.0%) |
| $3,000 or more | 0 (0.0%) | 0 (0.0%) |
| Total | 6,149 (100.0%) | 2,949 (100.0%) |
Physical Housing Characteristics in Barranquitas Municipio
Housing Structures in Barranquitas Municipio
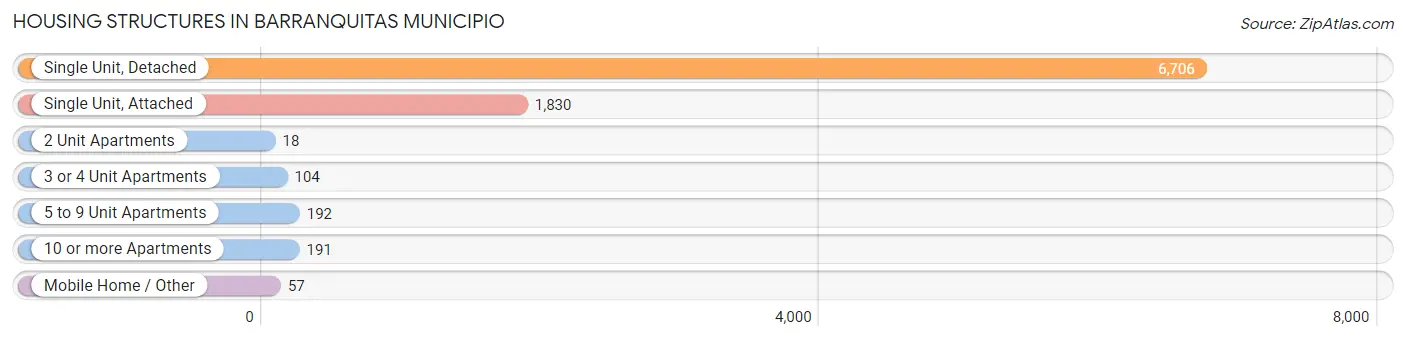
| Structure Type | # Housing Units | % Housing Units |
| Single Unit, Detached | 6,706 | 73.7% |
| Single Unit, Attached | 1,830 | 20.1% |
| 2 Unit Apartments | 18 | 0.2% |
| 3 or 4 Unit Apartments | 104 | 1.1% |
| 5 to 9 Unit Apartments | 192 | 2.1% |
| 10 or more Apartments | 191 | 2.1% |
| Mobile Home / Other | 57 | 0.6% |
| Total | 9,098 | 100.0% |
Housing Structures by Occupancy in Barranquitas Municipio
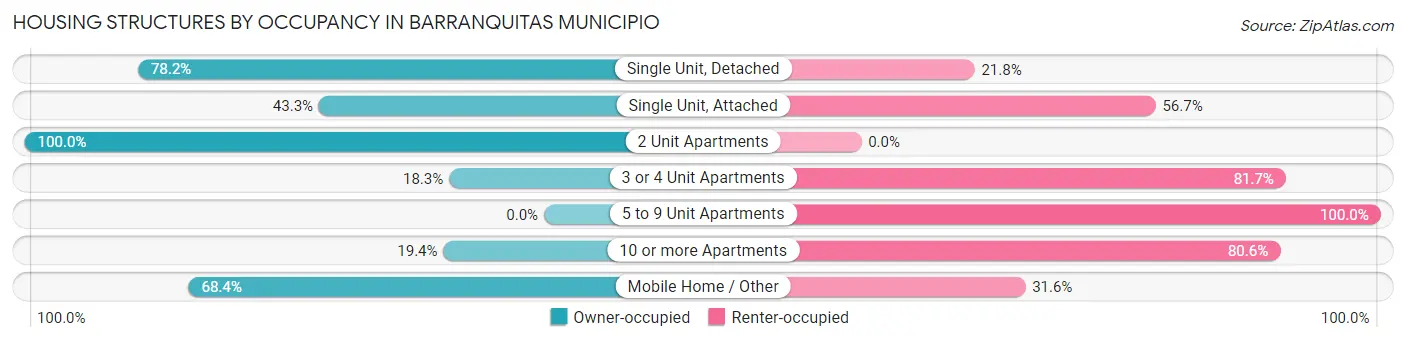
| Structure Type | Owner-occupied | Renter-occupied |
| Single Unit, Detached | 5,243 (78.2%) | 1,463 (21.8%) |
| Single Unit, Attached | 793 (43.3%) | 1,037 (56.7%) |
| 2 Unit Apartments | 18 (100.0%) | 0 (0.0%) |
| 3 or 4 Unit Apartments | 19 (18.3%) | 85 (81.7%) |
| 5 to 9 Unit Apartments | 0 (0.0%) | 192 (100.0%) |
| 10 or more Apartments | 37 (19.4%) | 154 (80.6%) |
| Mobile Home / Other | 39 (68.4%) | 18 (31.6%) |
| Total | 6,149 (67.6%) | 2,949 (32.4%) |
Housing Structures by Number of Rooms in Barranquitas Municipio
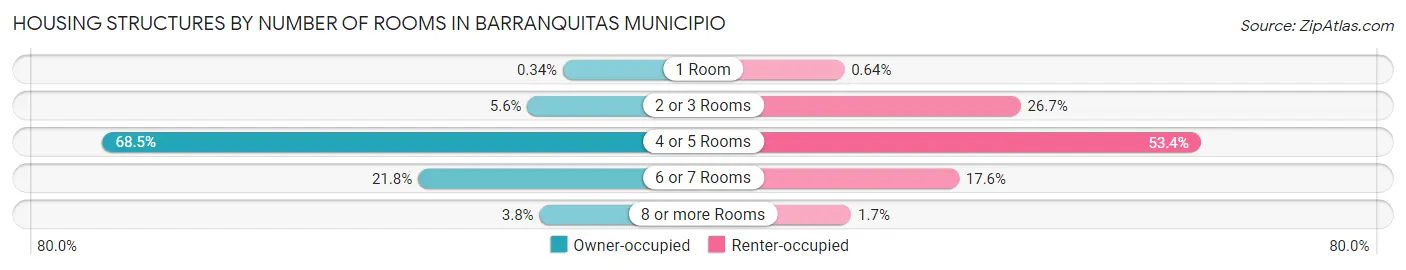
| Number of Rooms | Owner-occupied | Renter-occupied |
| 1 Room | 21 (0.3%) | 19 (0.6%) |
| 2 or 3 Rooms | 344 (5.6%) | 788 (26.7%) |
| 4 or 5 Rooms | 4,209 (68.4%) | 1,574 (53.4%) |
| 6 or 7 Rooms | 1,340 (21.8%) | 519 (17.6%) |
| 8 or more Rooms | 235 (3.8%) | 49 (1.7%) |
| Total | 6,149 (100.0%) | 2,949 (100.0%) |
Housing Structure by Heating Type in Barranquitas Municipio
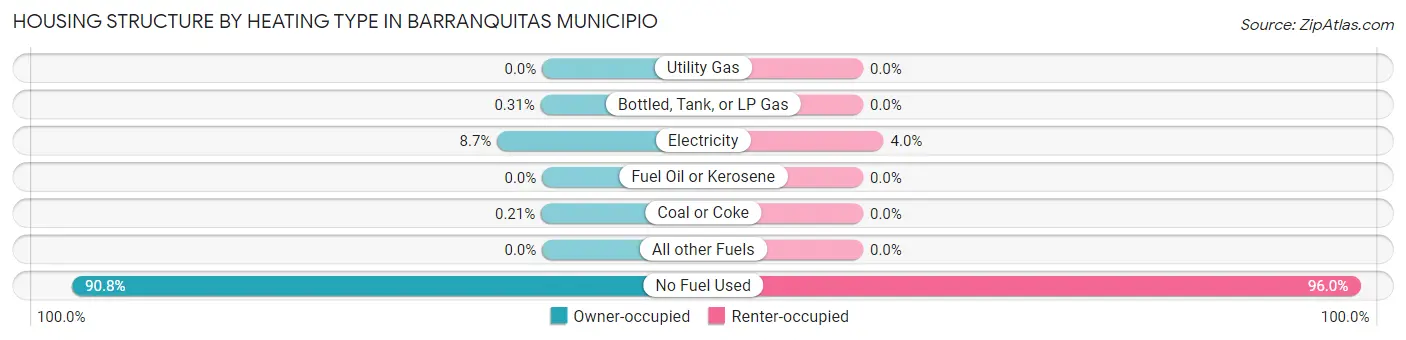
| Heating Type | Owner-occupied | Renter-occupied |
| Utility Gas | 0 (0.0%) | 0 (0.0%) |
| Bottled, Tank, or LP Gas | 19 (0.3%) | 0 (0.0%) |
| Electricity | 534 (8.7%) | 117 (4.0%) |
| Fuel Oil or Kerosene | 0 (0.0%) | 0 (0.0%) |
| Coal or Coke | 13 (0.2%) | 0 (0.0%) |
| All other Fuels | 0 (0.0%) | 0 (0.0%) |
| No Fuel Used | 5,583 (90.8%) | 2,832 (96.0%) |
| Total | 6,149 (100.0%) | 2,949 (100.0%) |
Household Vehicle Usage in Barranquitas Municipio
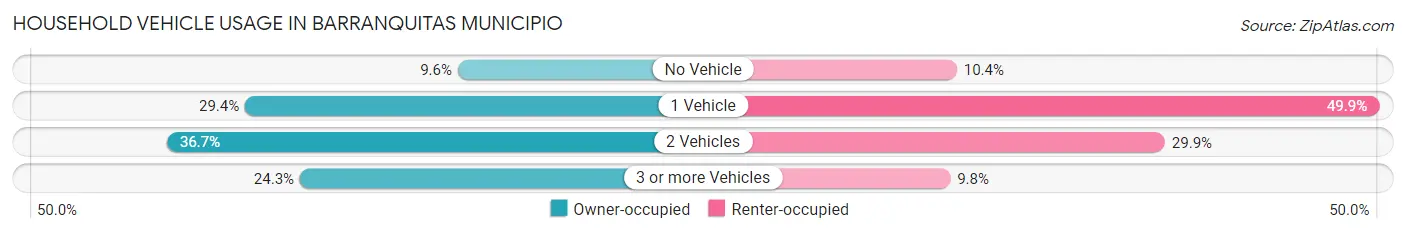
| Vehicles per Household | Owner-occupied | Renter-occupied |
| No Vehicle | 588 (9.6%) | 308 (10.4%) |
| 1 Vehicle | 1,809 (29.4%) | 1,470 (49.8%) |
| 2 Vehicles | 2,258 (36.7%) | 881 (29.9%) |
| 3 or more Vehicles | 1,494 (24.3%) | 290 (9.8%) |
| Total | 6,149 (100.0%) | 2,949 (100.0%) |
Real Estate & Mortgages in Barranquitas Municipio
Real Estate and Mortgage Overview in Barranquitas Municipio
| Characteristic | Without Mortgage | With Mortgage |
| Housing Units | 4,305 | 1,844 |
| Median Property Value | $111,800 | $135,200 |
| Median Household Income | $20,367 | $52 |
| Monthly Housing Costs | $141 | $0 |
| Real Estate Taxes | $287 | $1,725 |
Property Value by Mortgage Status in Barranquitas Municipio
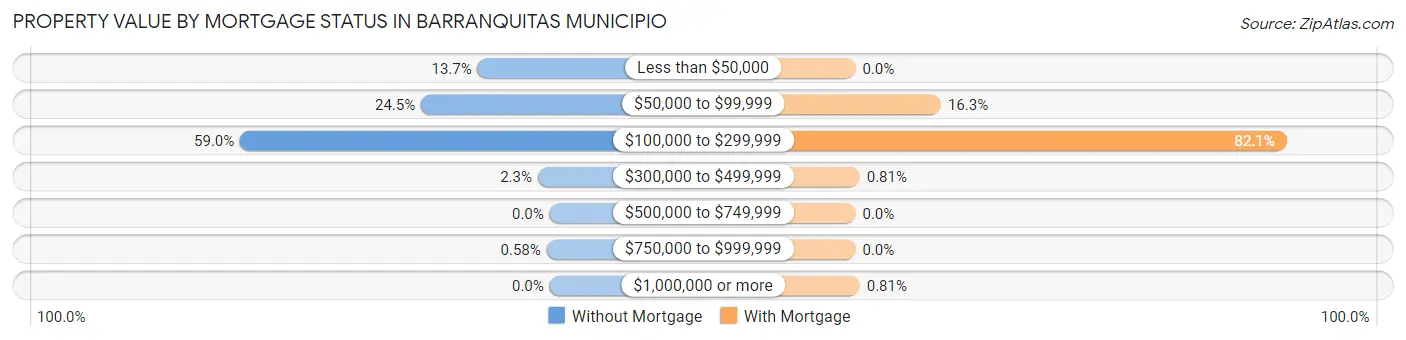
| Property Value | Without Mortgage | With Mortgage |
| Less than $50,000 | 591 (13.7%) | 0 (0.0%) |
| $50,000 to $99,999 | 1,054 (24.5%) | 300 (16.3%) |
| $100,000 to $299,999 | 2,538 (59.0%) | 1,514 (82.1%) |
| $300,000 to $499,999 | 97 (2.2%) | 15 (0.8%) |
| $500,000 to $749,999 | 0 (0.0%) | 0 (0.0%) |
| $750,000 to $999,999 | 25 (0.6%) | 0 (0.0%) |
| $1,000,000 or more | 0 (0.0%) | 15 (0.8%) |
| Total | 4,305 (100.0%) | 1,844 (100.0%) |
Household Income by Mortgage Status in Barranquitas Municipio
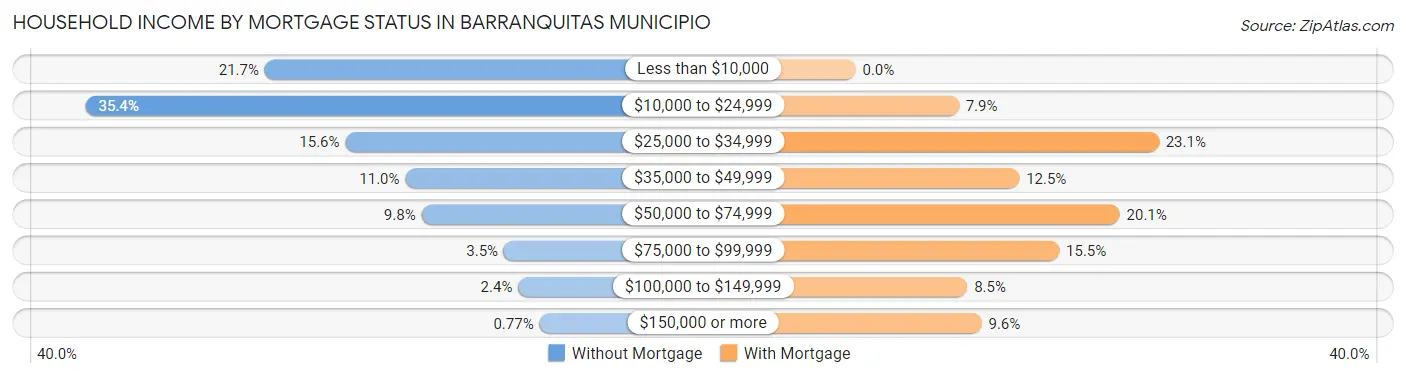
| Household Income | Without Mortgage | With Mortgage |
| Less than $10,000 | 934 (21.7%) | 0 (0.0%) |
| $10,000 to $24,999 | 1,522 (35.3%) | 145 (7.9%) |
| $25,000 to $34,999 | 670 (15.6%) | 426 (23.1%) |
| $35,000 to $49,999 | 473 (11.0%) | 230 (12.5%) |
| $50,000 to $74,999 | 420 (9.8%) | 371 (20.1%) |
| $75,000 to $99,999 | 150 (3.5%) | 286 (15.5%) |
| $100,000 to $149,999 | 103 (2.4%) | 157 (8.5%) |
| $150,000 or more | 33 (0.8%) | 177 (9.6%) |
| Total | 4,305 (100.0%) | 1,844 (100.0%) |
Property Value to Household Income Ratio in Barranquitas Municipio
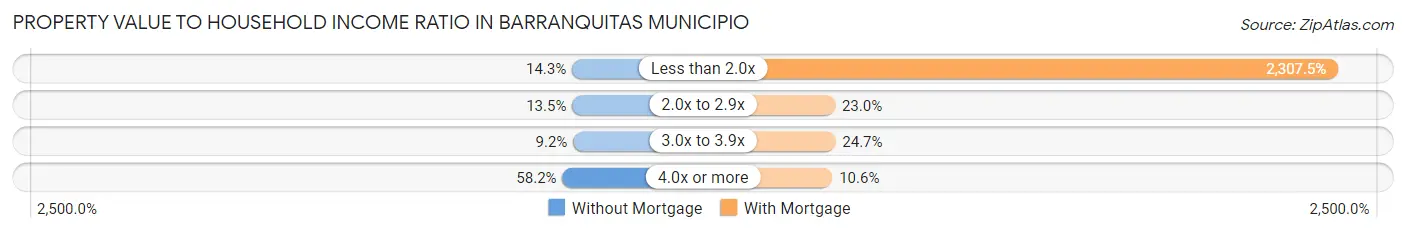
| Value-to-Income Ratio | Without Mortgage | With Mortgage |
| Less than 2.0x | 615 (14.3%) | 42,551 (2,307.5%) |
| 2.0x to 2.9x | 581 (13.5%) | 424 (23.0%) |
| 3.0x to 3.9x | 394 (9.1%) | 455 (24.7%) |
| 4.0x or more | 2,507 (58.2%) | 196 (10.6%) |
| Total | 4,305 (100.0%) | 1,844 (100.0%) |
Real Estate Taxes by Mortgage Status in Barranquitas Municipio
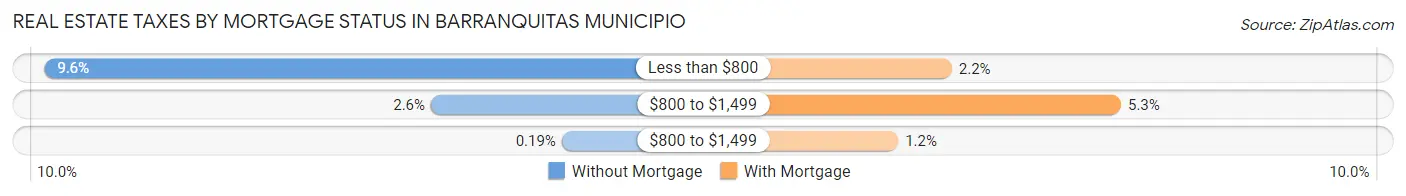
| Property Taxes | Without Mortgage | With Mortgage |
| Less than $800 | 415 (9.6%) | 40 (2.2%) |
| $800 to $1,499 | 111 (2.6%) | 97 (5.3%) |
| $800 to $1,499 | 8 (0.2%) | 22 (1.2%) |
| Total | 4,305 (100.0%) | 1,844 (100.0%) |
Health & Disability in Barranquitas Municipio
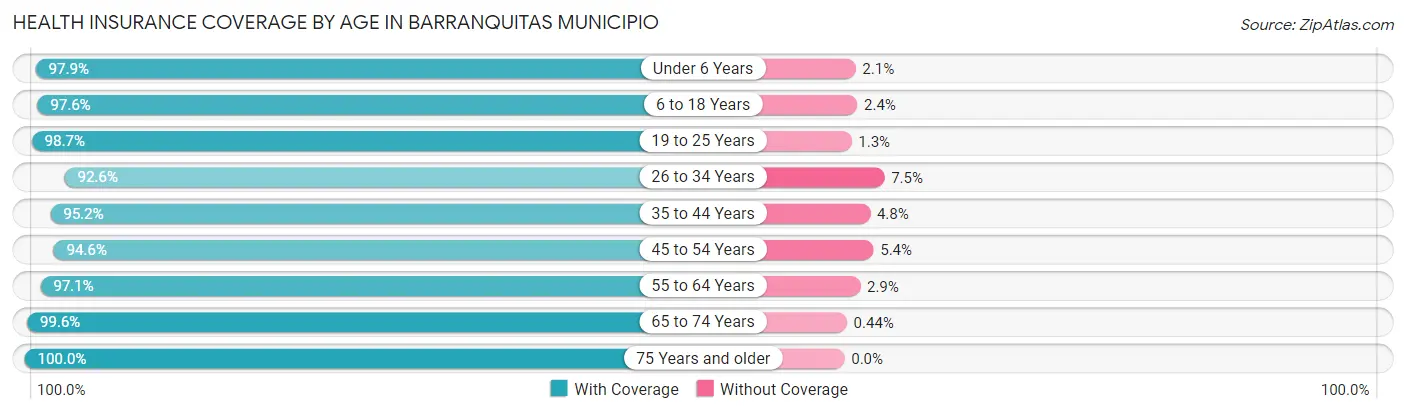
Health Insurance Coverage by Age in Barranquitas Municipio
| Age Bracket | With Coverage | Without Coverage |
| Under 6 Years | 1,560 (97.9%) | 33 (2.1%) |
| 6 to 18 Years | 4,533 (97.6%) | 111 (2.4%) |
| 19 to 25 Years | 3,004 (98.7%) | 40 (1.3%) |
| 26 to 34 Years | 3,132 (92.5%) | 252 (7.4%) |
| 35 to 44 Years | 3,360 (95.2%) | 169 (4.8%) |
| 45 to 54 Years | 3,252 (94.6%) | 186 (5.4%) |
| 55 to 64 Years | 3,880 (97.1%) | 117 (2.9%) |
| 65 to 74 Years | 2,911 (99.6%) | 13 (0.4%) |
| 75 Years and older | 2,200 (100.0%) | 0 (0.0%) |
| Total | 27,832 (96.8%) | 921 (3.2%) |
Health Insurance Coverage by Citizenship Status in Barranquitas Municipio

| Citizenship Status | With Coverage | Without Coverage |
| Native Born | 1,560 (97.9%) | 33 (2.1%) |
| Foreign Born, Citizen | 4,533 (97.6%) | 111 (2.4%) |
| Foreign Born, not a Citizen | 3,004 (98.7%) | 40 (1.3%) |
Health Insurance Coverage by Household Income in Barranquitas Municipio
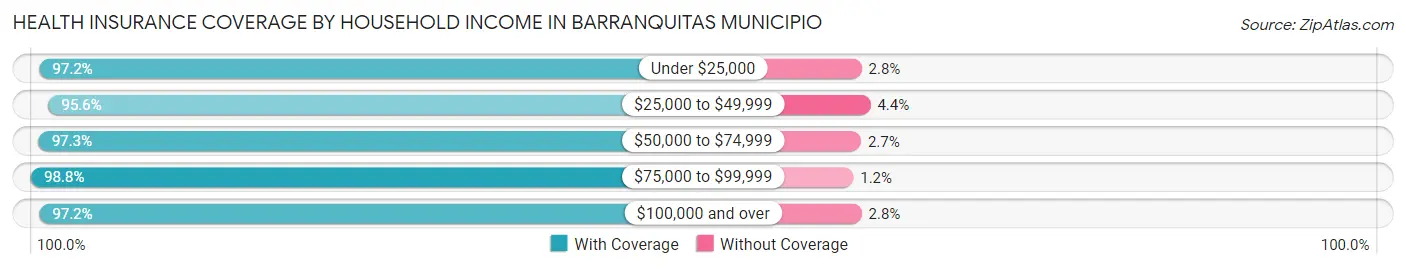
| Household Income | With Coverage | Without Coverage |
| Under $25,000 | 13,439 (97.2%) | 384 (2.8%) |
| $25,000 to $49,999 | 8,424 (95.6%) | 391 (4.4%) |
| $50,000 to $74,999 | 2,672 (97.3%) | 73 (2.7%) |
| $75,000 to $99,999 | 1,379 (98.8%) | 17 (1.2%) |
| $100,000 and over | 1,823 (97.2%) | 52 (2.8%) |
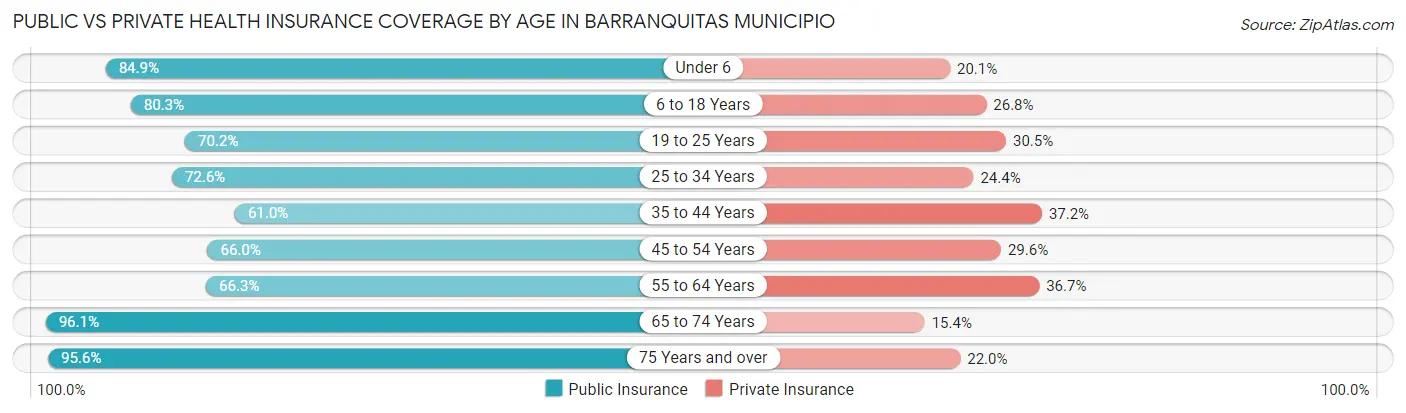
Public vs Private Health Insurance Coverage by Age in Barranquitas Municipio
| Age Bracket | Public Insurance | Private Insurance |
| Under 6 | 1,353 (84.9%) | 320 (20.1%) |
| 6 to 18 Years | 3,728 (80.3%) | 1,246 (26.8%) |
| 19 to 25 Years | 2,137 (70.2%) | 928 (30.5%) |
| 25 to 34 Years | 2,458 (72.6%) | 827 (24.4%) |
| 35 to 44 Years | 2,151 (61.0%) | 1,311 (37.1%) |
| 45 to 54 Years | 2,270 (66.0%) | 1,016 (29.5%) |
| 55 to 64 Years | 2,650 (66.3%) | 1,465 (36.6%) |
| 65 to 74 Years | 2,809 (96.1%) | 450 (15.4%) |
| 75 Years and over | 2,104 (95.6%) | 484 (22.0%) |
| Total | 21,660 (75.3%) | 8,047 (28.0%) |
Disability Status by Sex by Age in Barranquitas Municipio
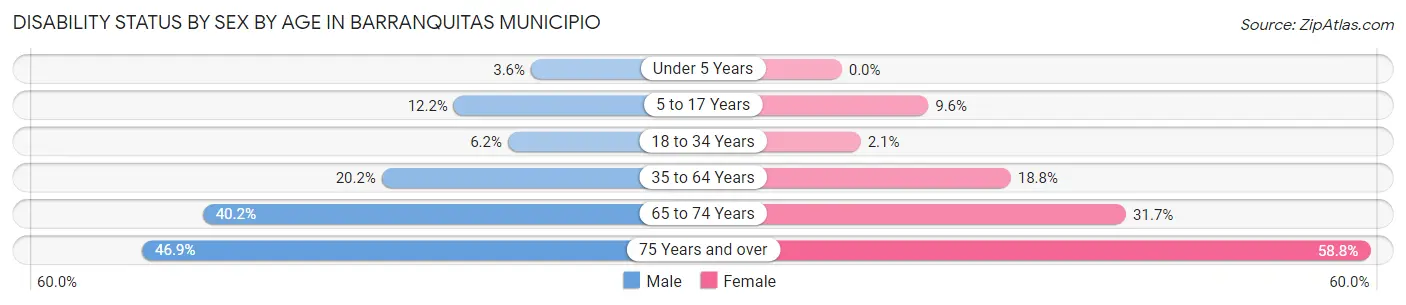
| Age Bracket | Male | Female |
| Under 5 Years | 22 (3.6%) | 0 (0.0%) |
| 5 to 17 Years | 286 (12.2%) | 221 (9.6%) |
| 18 to 34 Years | 217 (6.2%) | 70 (2.1%) |
| 35 to 64 Years | 1,070 (20.2%) | 1,068 (18.8%) |
| 65 to 74 Years | 563 (40.2%) | 482 (31.7%) |
| 75 Years and over | 418 (46.9%) | 770 (58.8%) |
Disability Class by Sex by Age in Barranquitas Municipio
Disability Class: Hearing Difficulty
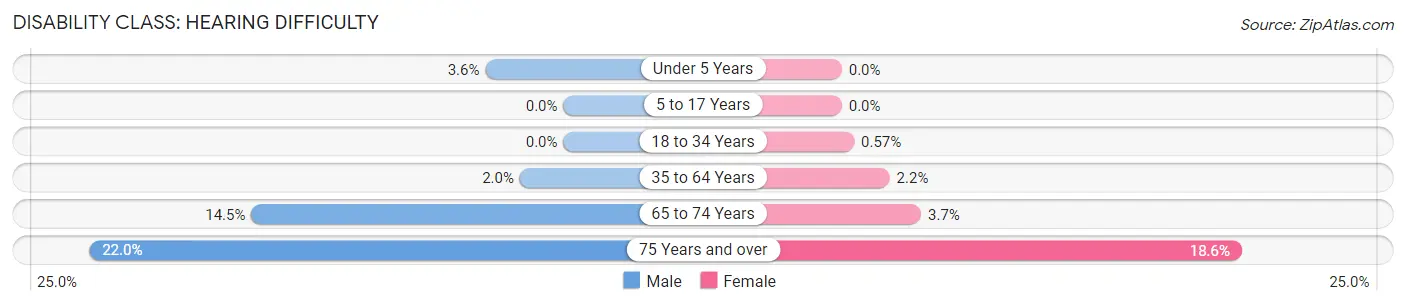
| Age Bracket | Male | Female |
| Under 5 Years | 22 (3.6%) | 0 (0.0%) |
| 5 to 17 Years | 0 (0.0%) | 0 (0.0%) |
| 18 to 34 Years | 0 (0.0%) | 19 (0.6%) |
| 35 to 64 Years | 107 (2.0%) | 126 (2.2%) |
| 65 to 74 Years | 203 (14.5%) | 56 (3.7%) |
| 75 Years and over | 196 (22.0%) | 243 (18.6%) |
Disability Class: Vision Difficulty
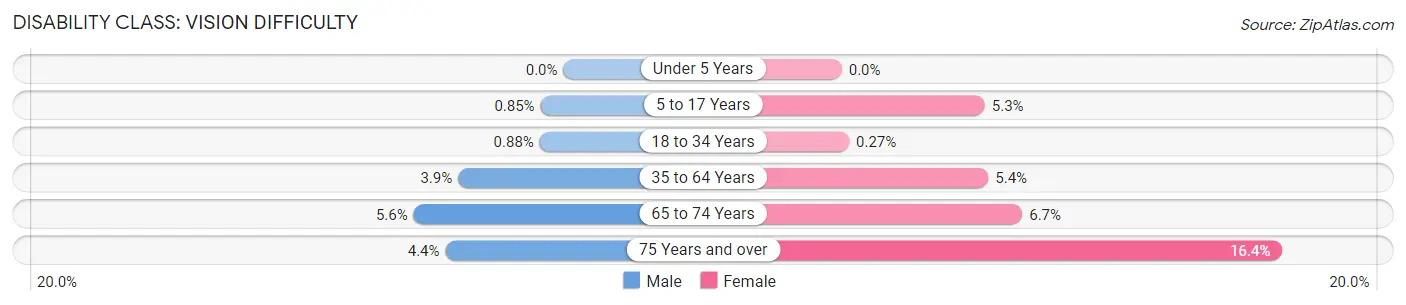
| Age Bracket | Male | Female |
| Under 5 Years | 0 (0.0%) | 0 (0.0%) |
| 5 to 17 Years | 20 (0.9%) | 122 (5.3%) |
| 18 to 34 Years | 31 (0.9%) | 9 (0.3%) |
| 35 to 64 Years | 207 (3.9%) | 309 (5.4%) |
| 65 to 74 Years | 78 (5.6%) | 102 (6.7%) |
| 75 Years and over | 39 (4.4%) | 214 (16.4%) |
Disability Class: Cognitive Difficulty
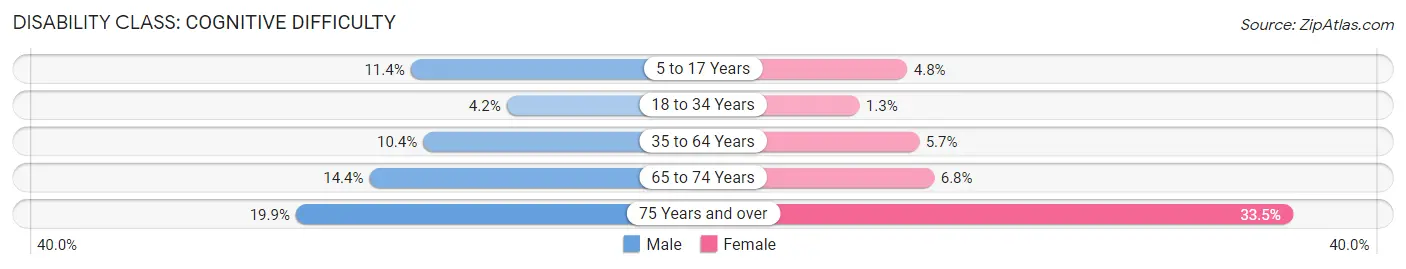
| Age Bracket | Male | Female |
| 5 to 17 Years | 266 (11.4%) | 111 (4.8%) |
| 18 to 34 Years | 148 (4.2%) | 42 (1.3%) |
| 35 to 64 Years | 551 (10.4%) | 324 (5.7%) |
| 65 to 74 Years | 202 (14.4%) | 104 (6.8%) |
| 75 Years and over | 177 (19.9%) | 438 (33.5%) |
Disability Class: Ambulatory Difficulty
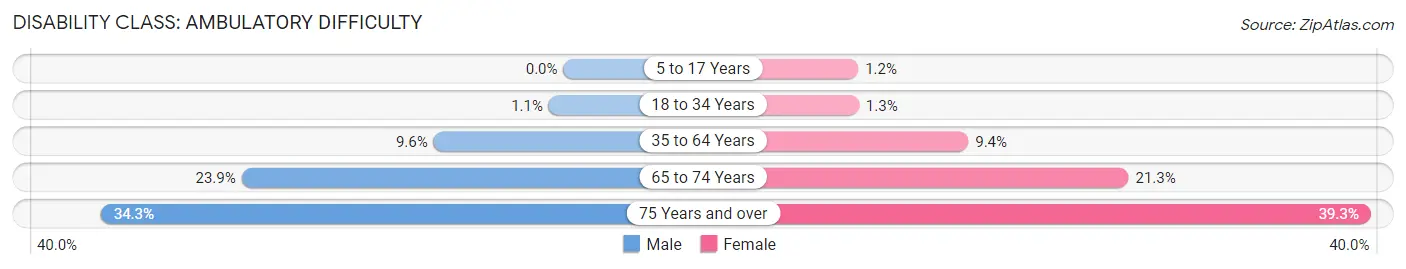
| Age Bracket | Male | Female |
| 5 to 17 Years | 0 (0.0%) | 28 (1.2%) |
| 18 to 34 Years | 38 (1.1%) | 42 (1.3%) |
| 35 to 64 Years | 510 (9.6%) | 533 (9.4%) |
| 65 to 74 Years | 335 (23.9%) | 324 (21.3%) |
| 75 Years and over | 306 (34.3%) | 514 (39.3%) |
Disability Class: Self-Care Difficulty
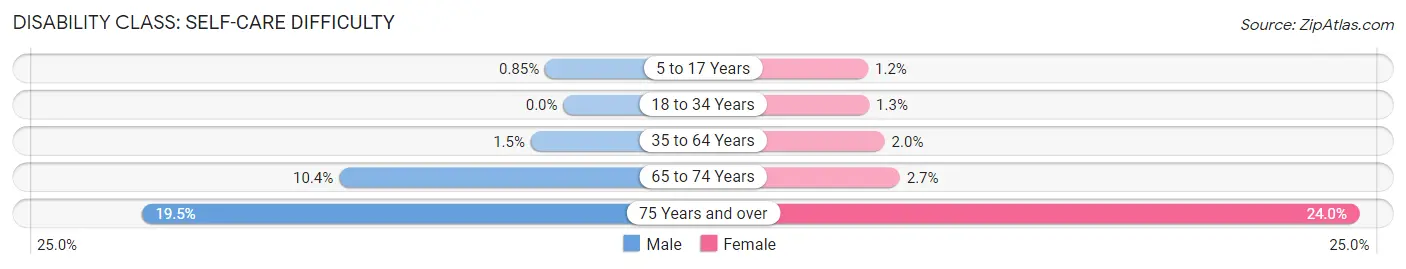
| Age Bracket | Male | Female |
| 5 to 17 Years | 20 (0.9%) | 28 (1.2%) |
| 18 to 34 Years | 0 (0.0%) | 42 (1.3%) |
| 35 to 64 Years | 80 (1.5%) | 113 (2.0%) |
| 65 to 74 Years | 146 (10.4%) | 41 (2.7%) |
| 75 Years and over | 174 (19.5%) | 314 (24.0%) |
Technology Access in Barranquitas Municipio
Computing Device Access in Barranquitas Municipio
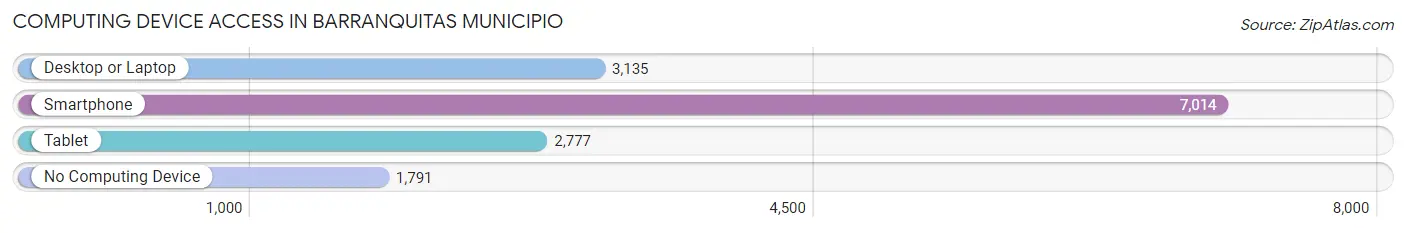
| Device Type | # Households | % Households |
| Desktop or Laptop | 3,135 | 34.5% |
| Smartphone | 7,014 | 77.1% |
| Tablet | 2,777 | 30.5% |
| No Computing Device | 1,791 | 19.7% |
| Total | 9,098 | 100.0% |
Internet Access in Barranquitas Municipio
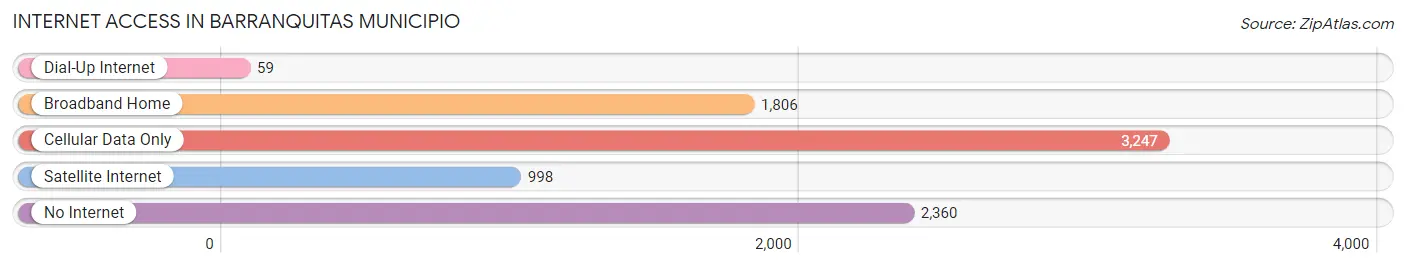
| Internet Type | # Households | % Households |
| Dial-Up Internet | 59 | 0.6% |
| Broadband Home | 1,806 | 19.9% |
| Cellular Data Only | 3,247 | 35.7% |
| Satellite Internet | 998 | 11.0% |
| No Internet | 2,360 | 25.9% |
| Total | 9,098 | 100.0% |
Barranquitas Municipio Summary
Barranquitas Municipio is located in the central region of Puerto Rico, in the Cordillera Central mountain range. It is bordered by the municipalities of Corozal, Naranjito, Orocovis, and Comerío. The municipality covers an area of approximately 48 square miles and has a population of approximately 28,000 people.
History
Barranquitas Municipio was founded in 1803 by Don Juan de la Cruz. The name of the municipality is derived from the Spanish word “barranco”, which means “ravine”. The area was originally inhabited by the Taino Indians, who were the first inhabitants of Puerto Rico. The Taino Indians were eventually displaced by the Spanish, who established the town of Barranquitas in 1803.
The town of Barranquitas was an important center of commerce and industry during the 19th century. It was home to several sugar mills, as well as a tobacco factory. The town also had a thriving agricultural sector, with coffee, tobacco, and sugarcane being the main crops.
In the early 20th century, Barranquitas Municipio experienced a period of economic decline. This was due to the decline of the sugar industry, as well as the introduction of new technologies that made the production of sugar more efficient. The town also suffered from a lack of investment in infrastructure and public services.
Geography
Barranquitas Municipio is located in the central region of Puerto Rico, in the Cordillera Central mountain range. The municipality covers an area of approximately 48 square miles and is bordered by the municipalities of Corozal, Naranjito, Orocovis, and Comerío.
The terrain of Barranquitas Municipio is mostly mountainous, with the highest point being Cerro de Punta, which is located at an elevation of 1,945 feet. The municipality is also home to several rivers, including the Rio Grande de Manatí, Rio Grande de Loíza, and Rio Grande de Arecibo.
Economy
The economy of Barranquitas Municipio is largely based on agriculture and tourism. The main agricultural products are coffee, tobacco, and sugarcane. The municipality is also home to several small-scale industries, such as furniture manufacturing, metalworking, and food processing.
Tourism is an important part of the economy of Barranquitas Municipio. The municipality is home to several attractions, including the Cueva Ventana, a natural cave with a spectacular view of the surrounding mountains. The municipality is also home to several historical sites, such as the ruins of the old sugar mills.
Demographics
As of the 2010 census, the population of Barranquitas Municipio was 28,000. The majority of the population is of Puerto Rican descent, with a small minority of African and European descent. The majority of the population is Roman Catholic, with a small minority of other religious denominations.
The median household income in Barranquitas Municipio is $17,000, which is lower than the national average. The unemployment rate is also higher than the national average, at 11.3%. The poverty rate is also higher than the national average, at 28.3%.
Conclusion
Barranquitas Municipio is a small municipality located in the central region of Puerto Rico. The municipality has a rich history, with the town being founded in 1803. The economy of the municipality is largely based on agriculture and tourism, with coffee, tobacco, and sugarcane being the main agricultural products. The population of Barranquitas Municipio is 28,000, with the majority of the population being of Puerto Rican descent. The median household income is lower than the national average, and the poverty rate is higher than the national average.
Common Questions
What is Per Capita Income in Barranquitas Municipio?
Per Capita income in Barranquitas Municipio is $11,396.
What is the Median Family Income in Barranquitas Municipio?
Median Family Income in Barranquitas Municipio is $23,903.
What is the Median Household income in Barranquitas Municipio?
Median Household Income in Barranquitas Municipio is $21,262.
What is Income or Wage Gap in Barranquitas Municipio?
Income or Wage Gap in Barranquitas Municipio is 4.4%.
Women in Barranquitas Municipio earn 95.6 cents for every dollar earned by a man.
What is Family Income Deficit in Barranquitas Municipio?
Family Income Deficit in Barranquitas Municipio is $13,161.
Families that are below poverty line in Barranquitas Municipio earn $13,161 less on average than the poverty threshold level.
What is Inequality or Gini Index in Barranquitas Municipio?
Inequality or Gini Index in Barranquitas Municipio is 0.50.
What is the Total Population of Barranquitas Municipio?
Total Population of Barranquitas Municipio is 28,899.
What is the Total Male Population of Barranquitas Municipio?
Total Male Population of Barranquitas Municipio is 14,172.
What is the Total Female Population of Barranquitas Municipio?
Total Female Population of Barranquitas Municipio is 14,727.
What is the Ratio of Males per 100 Females in Barranquitas Municipio?
There are 96.23 Males per 100 Females in Barranquitas Municipio.
What is the Ratio of Females per 100 Males in Barranquitas Municipio?
There are 103.92 Females per 100 Males in Barranquitas Municipio.
What is the Median Population Age in Barranquitas Municipio?
Median Population Age in Barranquitas Municipio is 38.9 Years.
What is the Average Family Size in Barranquitas Municipio
Average Family Size in Barranquitas Municipio is 3.6 People.
What is the Average Household Size in Barranquitas Municipio
Average Household Size in Barranquitas Municipio is 3.1 People.
How Large is the Labor Force in Barranquitas Municipio?
There are 10,376 People in the Labor Forcein in Barranquitas Municipio.
What is the Percentage of People in the Labor Force in Barranquitas Municipio?
43.7% of People are in the Labor Force in Barranquitas Municipio.
What is the Unemployment Rate in Barranquitas Municipio?
Unemployment Rate in Barranquitas Municipio is 15.5%.