Zip Codes with the Highest Percentage of Population with a Degree in Visual and Performing Arts in Sammamish, WA
RELATED REPORTS & OPTIONS
Visual and Performing Arts
Sammamish
Compare Zip Codes
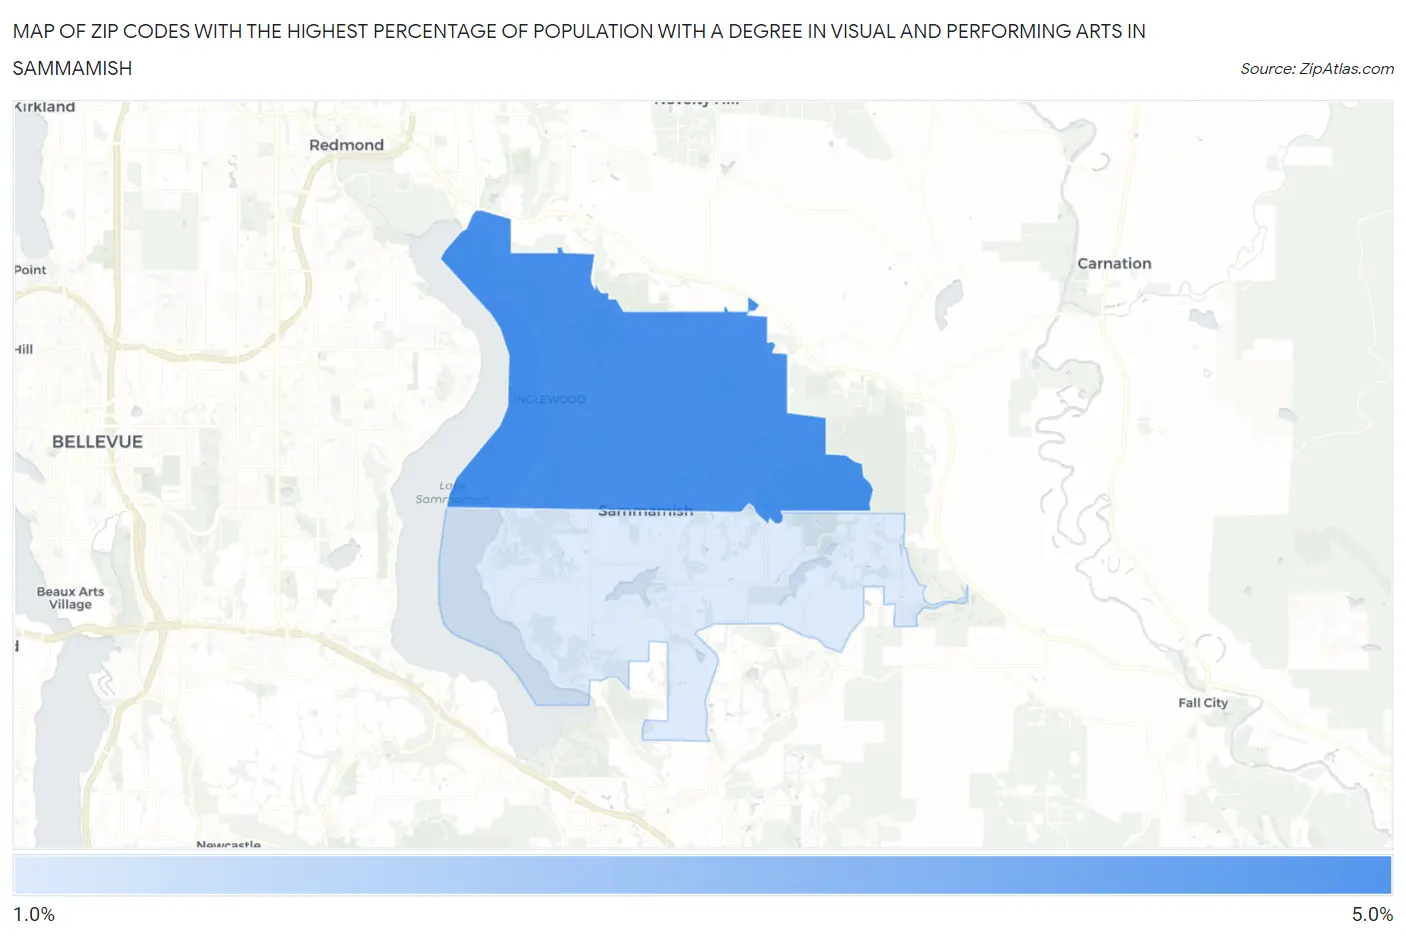
Map of Zip Codes with the Highest Percentage of Population with a Degree in Visual and Performing Arts in Sammamish
1.9%
4.3%
Zip Codes with the Highest Percentage of Population with a Degree in Visual and Performing Arts in Sammamish, WA
| Zip Code | % Graduates | vs State | vs National | |
| 1. | 98074 | 4.3% | 4.6%(-0.348)#221 | 4.3%(+0.019)#8,432 |
| 2. | 98075 | 1.9% | 4.6%(-2.73)#386 | 4.3%(-2.36)#16,824 |
1
Common Questions
What are the Top Zip Codes with the Highest Percentage of Population with a Degree in Visual and Performing Arts in Sammamish, WA?
Top Zip Codes with the Highest Percentage of Population with a Degree in Visual and Performing Arts in Sammamish, WA are:
What zip code has the Highest Percentage of Population with a Degree in Visual and Performing Arts in Sammamish, WA?
98074 has the Highest Percentage of Population with a Degree in Visual and Performing Arts in Sammamish, WA with 4.3%.
What is the Percentage of Population with a Degree in Visual and Performing Arts in Sammamish, WA?
Percentage of Population with a Degree in Visual and Performing Arts in Sammamish is 3.2%.
What is the Percentage of Population with a Degree in Visual and Performing Arts in Washington?
Percentage of Population with a Degree in Visual and Performing Arts in Washington is 4.6%.
What is the Percentage of Population with a Degree in Visual and Performing Arts in the United States?
Percentage of Population with a Degree in Visual and Performing Arts in the United States is 4.3%.