Bradford, VT Map & Demographics
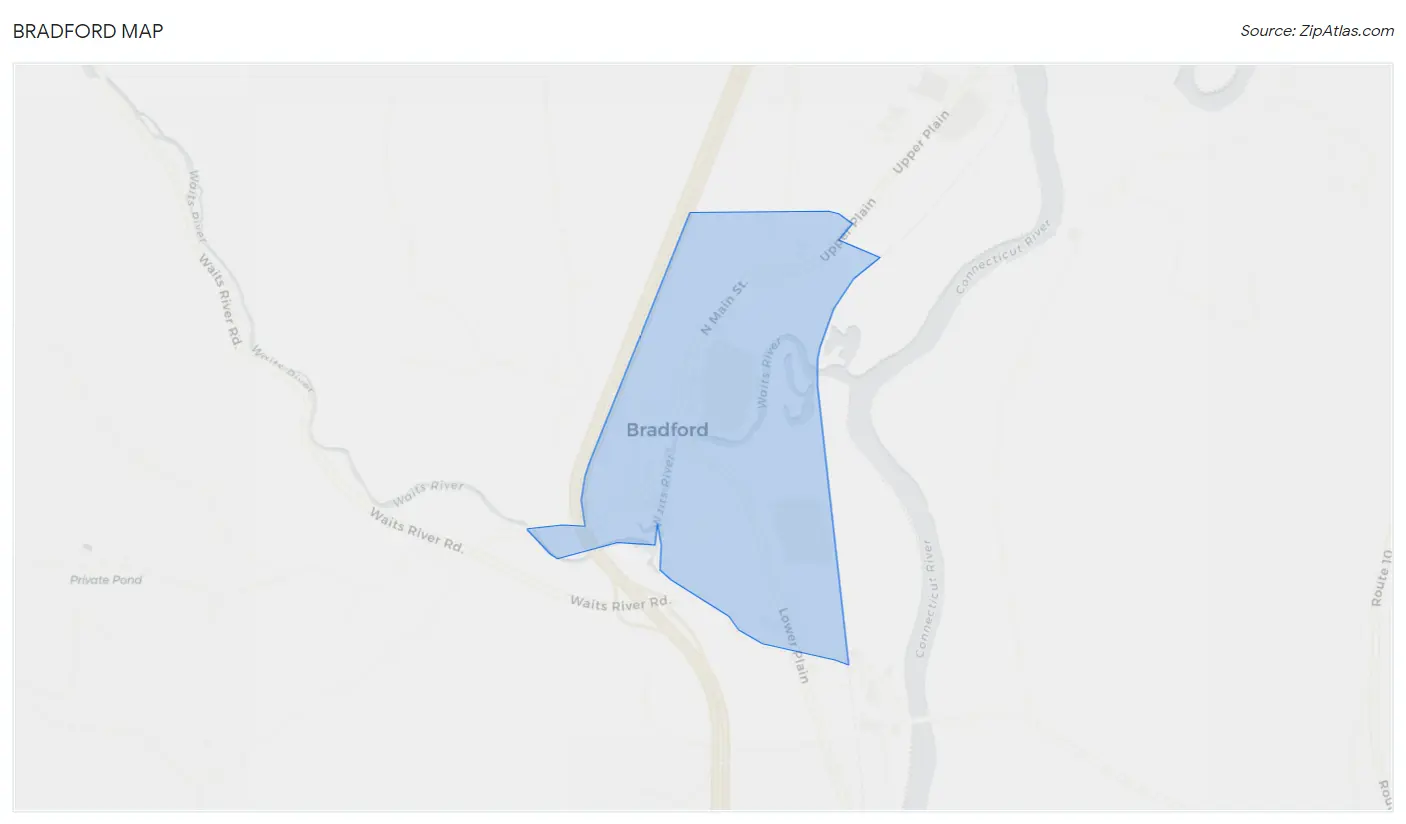
Bradford Map
Bradford Overview
$34,580
PER CAPITA INCOME
$108,710
AVG FAMILY INCOME
$95,199
AVG HOUSEHOLD INCOME
0.37
INEQUALITY / GINI INDEX
1,272
TOTAL POPULATION
721
MALE POPULATION
551
FEMALE POPULATION
130.85
MALES / 100 FEMALES
76.42
FEMALES / 100 MALES
42.2
MEDIAN AGE
2.8
AVG FAMILY SIZE
2.4
AVG HOUSEHOLD SIZE
746
LABOR FORCE [ PEOPLE ]
66.0%
PERCENT IN LABOR FORCE
4.2%
UNEMPLOYMENT RATE
Bradford Zip Codes
Bradford Area Codes
Income in Bradford
Income Overview in Bradford
Per Capita Income in Bradford is $34,580, while median incomes of families and households are $108,710 and $95,199 respectively.
| Characteristic | Number | Measure |
| Per Capita Income | 1,272 | $34,580 |
| Median Family Income | 346 | $108,710 |
| Mean Family Income | 346 | $106,848 |
| Median Household Income | 499 | $95,199 |
| Mean Household Income | 499 | $85,240 |
| Income Deficit | 346 | $0 |
| Wage / Income Gap (%) | 1,272 | 0.00% |
| Wage / Income Gap ($) | 1,272 | 100.00¢ per $1 |
| Gini / Inequality Index | 1,272 | 0.37 |
Earnings by Sex in Bradford
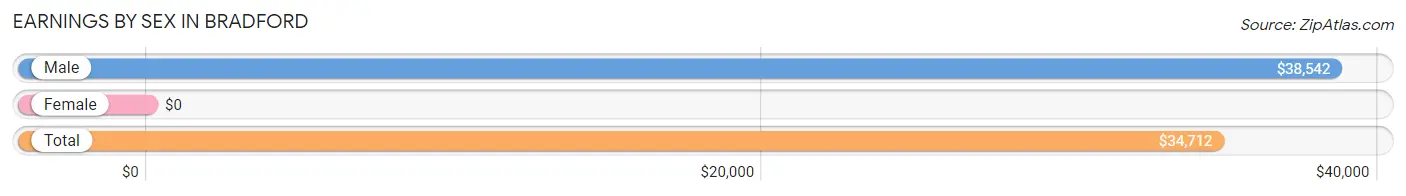
| Sex | Number | Average Earnings |
| Male | 466 (55.6%) | $38,542 |
| Female | 372 (44.4%) | $0 |
| Total | 838 (100.0%) | $34,712 |
Earnings by Sex by Income Bracket in Bradford
The most common earnings brackets in Bradford are $100,000+ for men (81 | 17.4%) and $55,000 to $64,999 for women (70 | 18.8%).
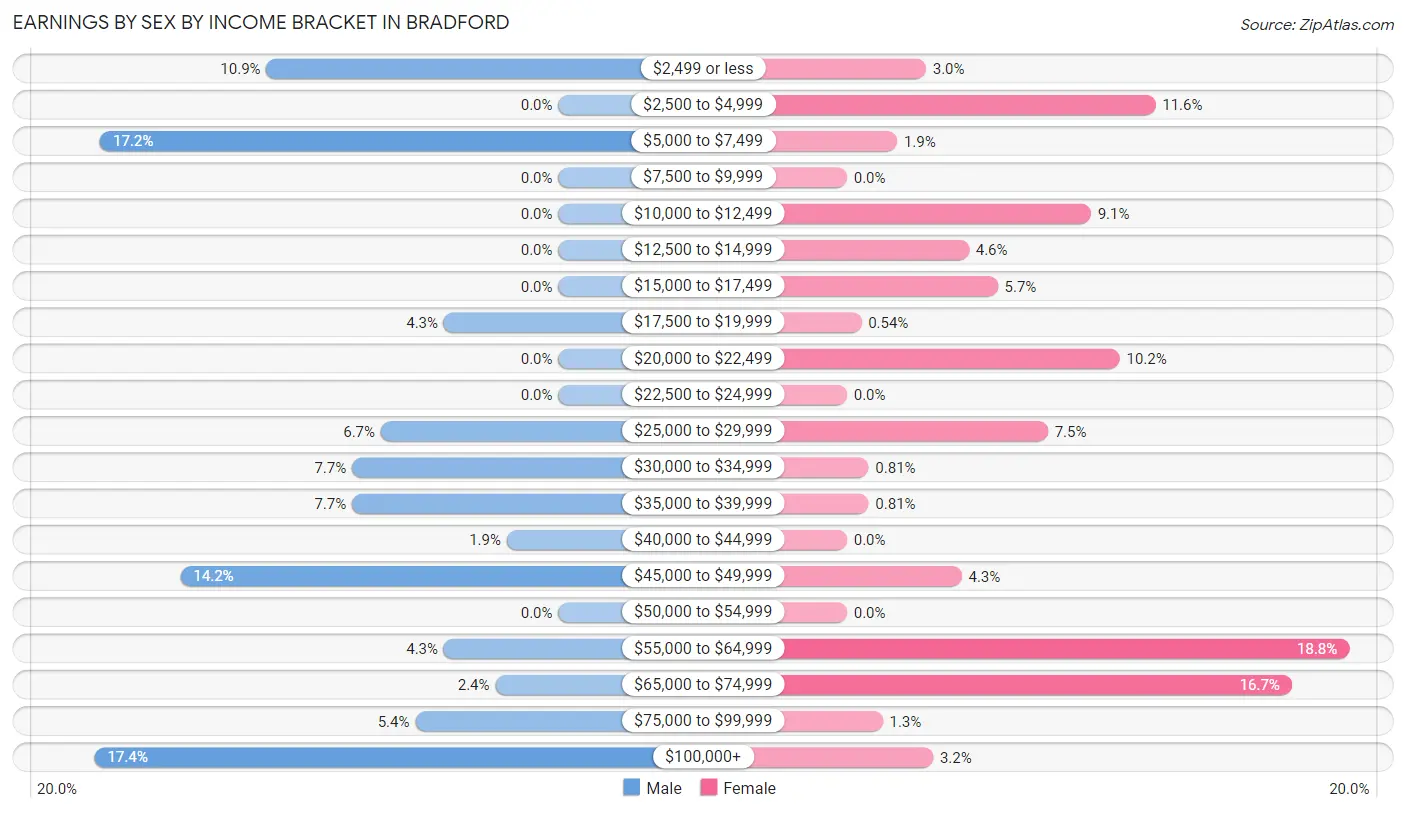
| Income | Male | Female |
| $2,499 or less | 51 (10.9%) | 11 (3.0%) |
| $2,500 to $4,999 | 0 (0.0%) | 43 (11.6%) |
| $5,000 to $7,499 | 80 (17.2%) | 7 (1.9%) |
| $7,500 to $9,999 | 0 (0.0%) | 0 (0.0%) |
| $10,000 to $12,499 | 0 (0.0%) | 34 (9.1%) |
| $12,500 to $14,999 | 0 (0.0%) | 17 (4.6%) |
| $15,000 to $17,499 | 0 (0.0%) | 21 (5.7%) |
| $17,500 to $19,999 | 20 (4.3%) | 2 (0.5%) |
| $20,000 to $22,499 | 0 (0.0%) | 38 (10.2%) |
| $22,500 to $24,999 | 0 (0.0%) | 0 (0.0%) |
| $25,000 to $29,999 | 31 (6.7%) | 28 (7.5%) |
| $30,000 to $34,999 | 36 (7.7%) | 3 (0.8%) |
| $35,000 to $39,999 | 36 (7.7%) | 3 (0.8%) |
| $40,000 to $44,999 | 9 (1.9%) | 0 (0.0%) |
| $45,000 to $49,999 | 66 (14.2%) | 16 (4.3%) |
| $50,000 to $54,999 | 0 (0.0%) | 0 (0.0%) |
| $55,000 to $64,999 | 20 (4.3%) | 70 (18.8%) |
| $65,000 to $74,999 | 11 (2.4%) | 62 (16.7%) |
| $75,000 to $99,999 | 25 (5.4%) | 5 (1.3%) |
| $100,000+ | 81 (17.4%) | 12 (3.2%) |
| Total | 466 (100.0%) | 372 (100.0%) |
Earnings by Sex by Educational Attainment in Bradford
Average earnings in Bradford are $45,871 for men and $55,071 for women, a difference of 16.7%. Men with an educational attainment of high school diploma enjoy the highest average annual earnings of $45,852, while those with bachelor's degree education earn the least with $2,499. Women with an educational attainment of bachelor's degree earn the most with the average annual earnings of $55,317, while those with bachelor's degree education have the smallest earnings of $55,317.
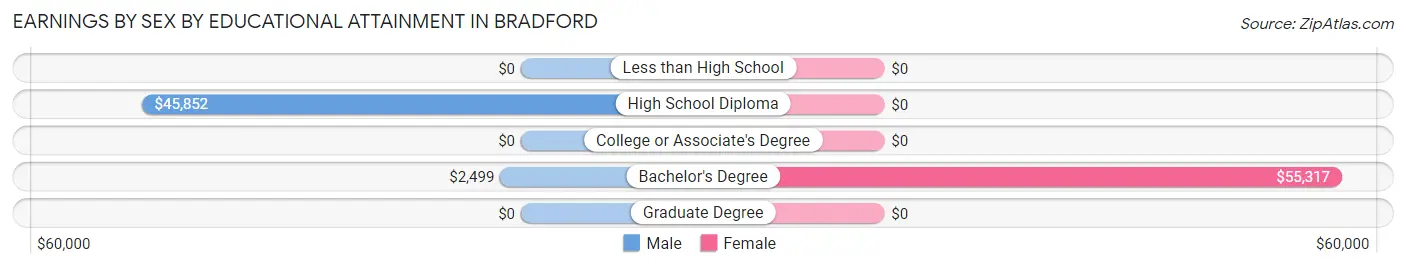
| Educational Attainment | Male Income | Female Income |
| Less than High School | - | - |
| High School Diploma | $45,852 | $0 |
| College or Associate's Degree | - | - |
| Bachelor's Degree | $2,499 | $55,317 |
| Graduate Degree | - | - |
| Total | $45,871 | $55,071 |
Family Income in Bradford
Family Income Brackets in Bradford
According to the Bradford family income data, there are 133 families falling into the $100,000 to $149,999 income range, which is the most common income bracket and makes up 38.4% of all families.
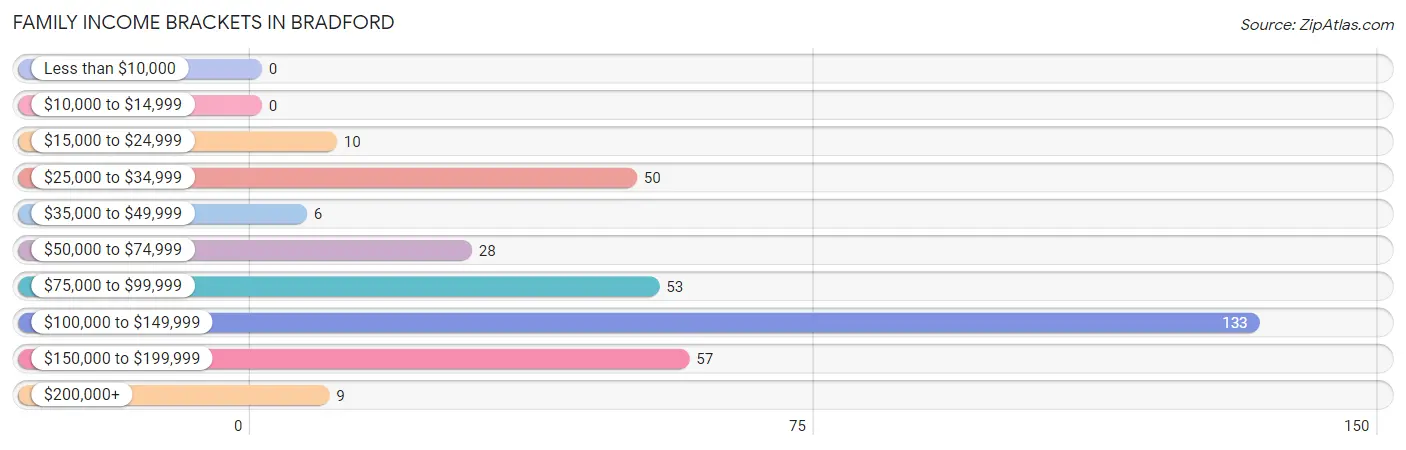
| Income Bracket | # Families | % Families |
| Less than $10,000 | 0 | 0.0% |
| $10,000 to $14,999 | 0 | 0.0% |
| $15,000 to $24,999 | 10 | 2.9% |
| $25,000 to $34,999 | 50 | 14.5% |
| $35,000 to $49,999 | 6 | 1.7% |
| $50,000 to $74,999 | 28 | 8.1% |
| $75,000 to $99,999 | 53 | 15.3% |
| $100,000 to $149,999 | 133 | 38.4% |
| $150,000 to $199,999 | 57 | 16.5% |
| $200,000+ | 9 | 2.6% |
Family Income by Famaliy Size in Bradford
4-person families (22 | 6.4%) account for the highest median family income in Bradford with $113,750 per family, while 2-person families (115 | 33.2%) have the highest median income of $30,625 per family member.
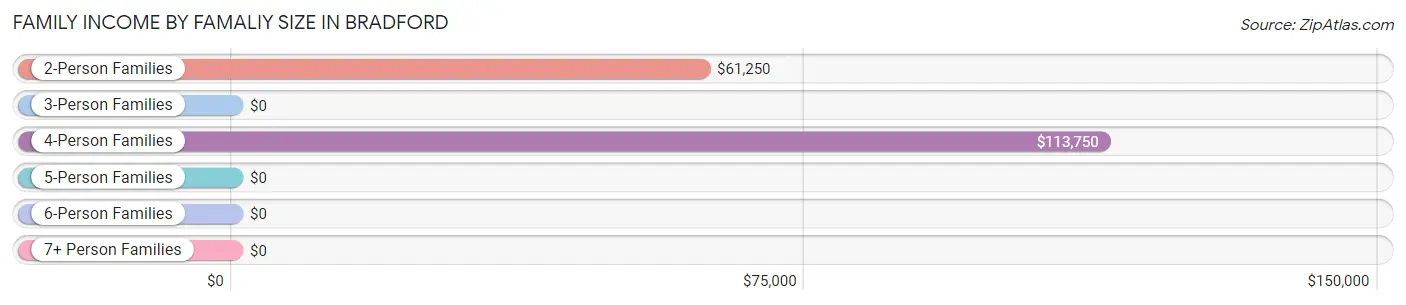
| Income Bracket | # Families | Median Income |
| 2-Person Families | 115 (33.2%) | $61,250 |
| 3-Person Families | 134 (38.7%) | $0 |
| 4-Person Families | 22 (6.4%) | $113,750 |
| 5-Person Families | 0 (0.0%) | $0 |
| 6-Person Families | 75 (21.7%) | $0 |
| 7+ Person Families | 0 (0.0%) | $0 |
| Total | 346 (100.0%) | $108,710 |
Family Income by Number of Earners in Bradford
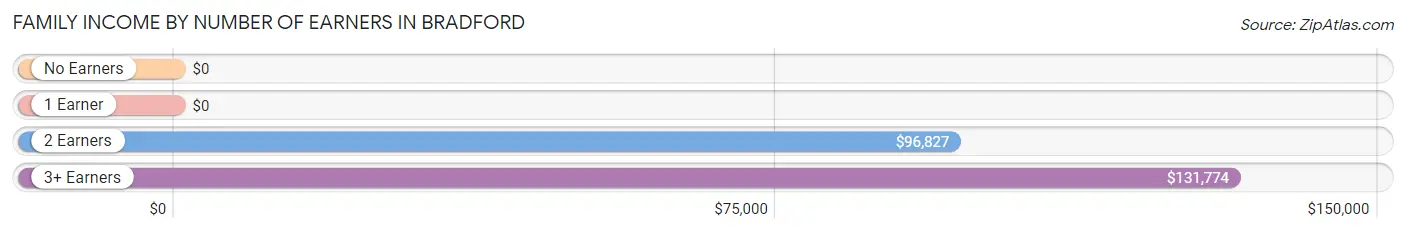
| Number of Earners | # Families | Median Income |
| No Earners | 35 (10.1%) | $0 |
| 1 Earner | 82 (23.7%) | $0 |
| 2 Earners | 79 (22.8%) | $96,827 |
| 3+ Earners | 150 (43.3%) | $131,774 |
| Total | 346 (100.0%) | $108,710 |
Household Income in Bradford
Household Income Brackets in Bradford
With 143 households falling in the category, the $100,000 to $149,999 income range is the most frequent in Bradford, accounting for 28.7% of all households. In contrast, only 8 households (1.6%) fall into the $10,000 to $14,999 income bracket, making it the least populous group.
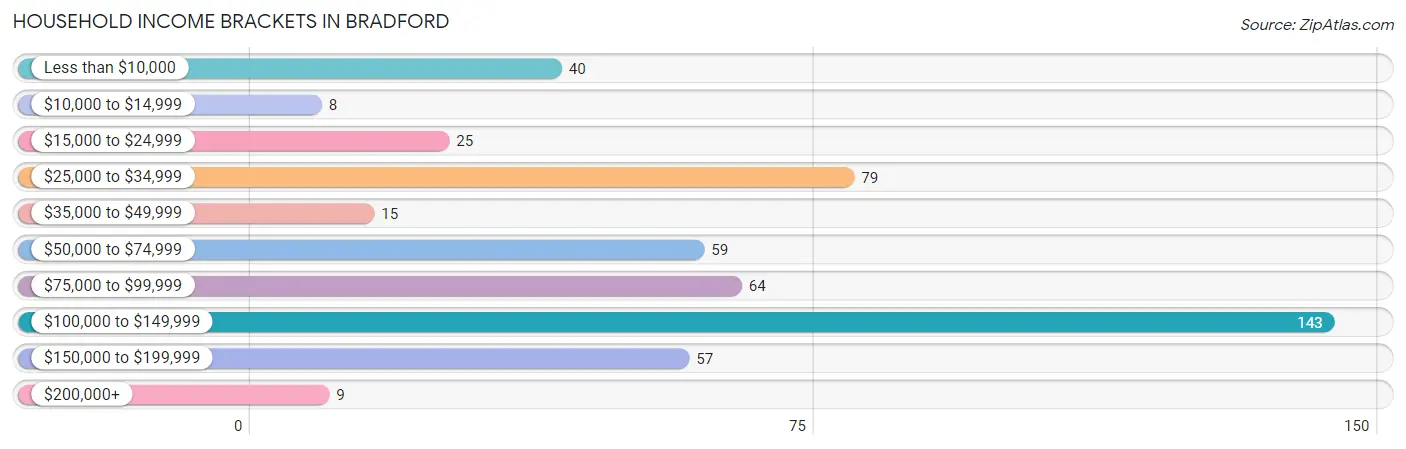
| Income Bracket | # Households | % Households |
| Less than $10,000 | 40 | 8.0% |
| $10,000 to $14,999 | 8 | 1.6% |
| $15,000 to $24,999 | 25 | 5.0% |
| $25,000 to $34,999 | 79 | 15.8% |
| $35,000 to $49,999 | 15 | 3.0% |
| $50,000 to $74,999 | 59 | 11.8% |
| $75,000 to $99,999 | 64 | 12.8% |
| $100,000 to $149,999 | 143 | 28.7% |
| $150,000 to $199,999 | 57 | 11.4% |
| $200,000+ | 9 | 1.8% |
Household Income by Householder Age in Bradford
The median household income in Bradford is $95,199, with the highest median household income of $131,045 found in the 25 to 44 years age bracket for the primary householder. A total of 186 households (37.3%) fall into this category. Meanwhile, the 15 to 24 years age bracket for the primary householder has the lowest median household income of $0, with 35 households (7.0%) in this group.
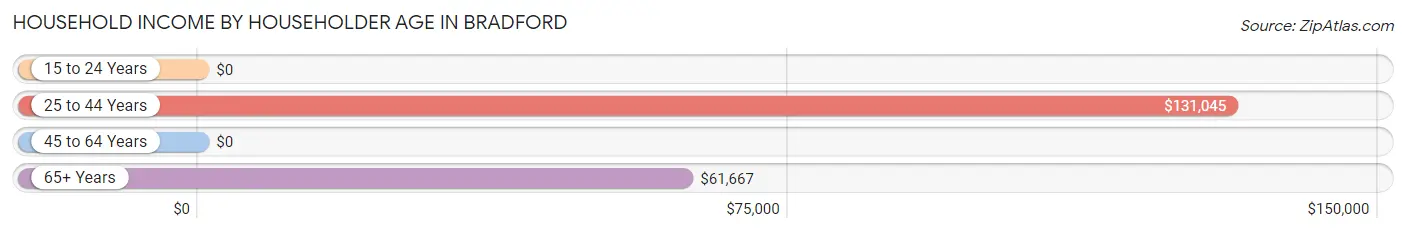
| Income Bracket | # Households | Median Income |
| 15 to 24 Years | 35 (7.0%) | $0 |
| 25 to 44 Years | 186 (37.3%) | $131,045 |
| 45 to 64 Years | 98 (19.6%) | $0 |
| 65+ Years | 180 (36.1%) | $61,667 |
| Total | 499 (100.0%) | $95,199 |
Poverty in Bradford
Income Below Poverty by Sex and Age in Bradford
With 14.0% poverty level for males and 11.6% for females among the residents of Bradford, 55 to 64 year old males and 18 to 24 year old females are the most vulnerable to poverty, with 58 males (67.4%) and 30 females (93.8%) in their respective age groups living below the poverty level.
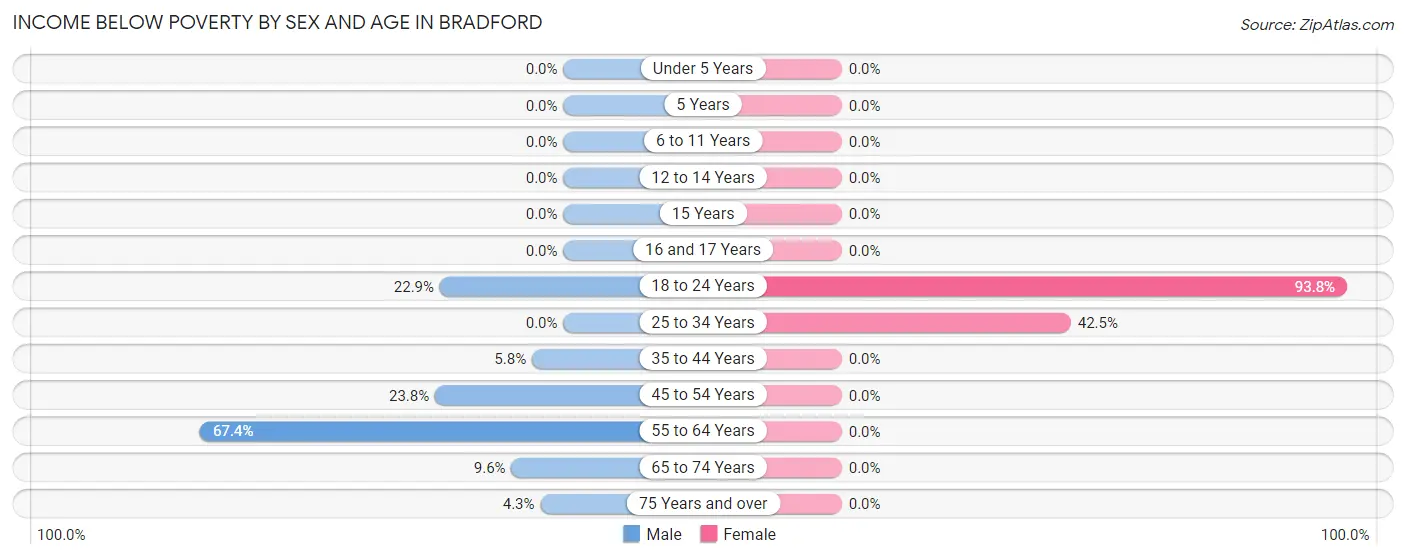
| Age Bracket | Male | Female |
| Under 5 Years | 0 (0.0%) | 0 (0.0%) |
| 5 Years | 0 (0.0%) | 0 (0.0%) |
| 6 to 11 Years | 0 (0.0%) | 0 (0.0%) |
| 12 to 14 Years | 0 (0.0%) | 0 (0.0%) |
| 15 Years | 0 (0.0%) | 0 (0.0%) |
| 16 and 17 Years | 0 (0.0%) | 0 (0.0%) |
| 18 to 24 Years | 11 (22.9%) | 30 (93.8%) |
| 25 to 34 Years | 0 (0.0%) | 34 (42.5%) |
| 35 to 44 Years | 11 (5.8%) | 0 (0.0%) |
| 45 to 54 Years | 10 (23.8%) | 0 (0.0%) |
| 55 to 64 Years | 58 (67.4%) | 0 (0.0%) |
| 65 to 74 Years | 8 (9.6%) | 0 (0.0%) |
| 75 Years and over | 2 (4.3%) | 0 (0.0%) |
| Total | 100 (14.0%) | 64 (11.6%) |
Income Above Poverty by Sex and Age in Bradford
According to the poverty statistics in Bradford, males aged under 5 years and females aged under 5 years are the age groups that are most secure financially, with 100.0% of males and 100.0% of females in these age groups living above the poverty line.
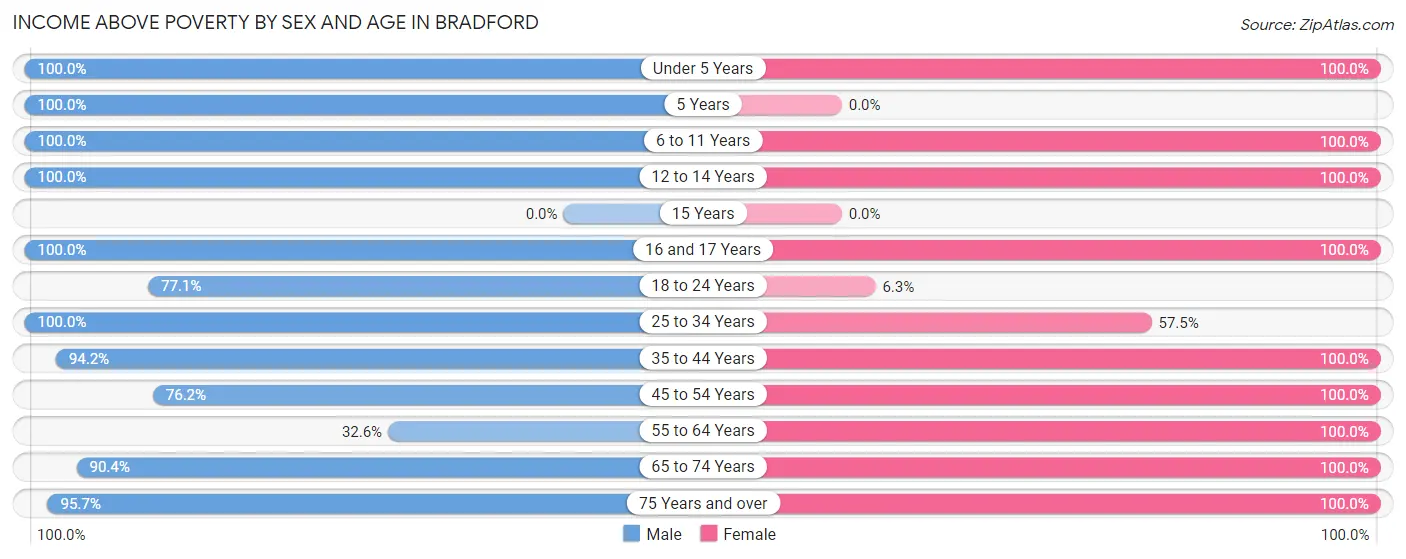
| Age Bracket | Male | Female |
| Under 5 Years | 40 (100.0%) | 12 (100.0%) |
| 5 Years | 21 (100.0%) | 0 (0.0%) |
| 6 to 11 Years | 23 (100.0%) | 12 (100.0%) |
| 12 to 14 Years | 4 (100.0%) | 24 (100.0%) |
| 15 Years | 0 (0.0%) | 0 (0.0%) |
| 16 and 17 Years | 85 (100.0%) | 54 (100.0%) |
| 18 to 24 Years | 37 (77.1%) | 2 (6.2%) |
| 25 to 34 Years | 46 (100.0%) | 46 (57.5%) |
| 35 to 44 Years | 178 (94.2%) | 155 (100.0%) |
| 45 to 54 Years | 32 (76.2%) | 18 (100.0%) |
| 55 to 64 Years | 28 (32.6%) | 26 (100.0%) |
| 65 to 74 Years | 75 (90.4%) | 74 (100.0%) |
| 75 Years and over | 45 (95.7%) | 63 (100.0%) |
| Total | 614 (86.0%) | 486 (88.4%) |
Income Below Poverty Among Married-Couple Families in Bradford
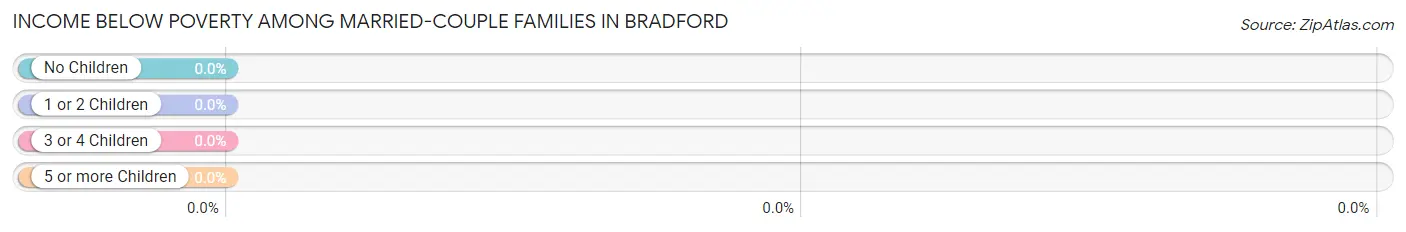
| Children | Above Poverty | Below Poverty |
| No Children | 131 (100.0%) | 0 (0.0%) |
| 1 or 2 Children | 74 (100.0%) | 0 (0.0%) |
| 3 or 4 Children | 75 (100.0%) | 0 (0.0%) |
| 5 or more Children | 0 (0.0%) | 0 (0.0%) |
| Total | 280 (100.0%) | 0 (0.0%) |
Income Below Poverty Among Single-Parent Households in Bradford
| Children | Single Father | Single Mother |
| No Children | 0 (0.0%) | 0 (0.0%) |
| 1 or 2 Children | 0 (0.0%) | 0 (0.0%) |
| 3 or 4 Children | 0 (0.0%) | 0 (0.0%) |
| 5 or more Children | 0 (0.0%) | 0 (0.0%) |
| Total | 0 (0.0%) | 0 (0.0%) |
Income Below Poverty Among Married-Couple vs Single-Parent Households in Bradford
| Children | Married-Couple Families | Single-Parent Households |
| No Children | 0 (0.0%) | 0 (0.0%) |
| 1 or 2 Children | 0 (0.0%) | 0 (0.0%) |
| 3 or 4 Children | 0 (0.0%) | 0 (0.0%) |
| 5 or more Children | 0 (0.0%) | 0 (0.0%) |
| Total | 0 (0.0%) | 0 (0.0%) |
Race in Bradford
The most populous races in Bradford are White / Caucasian (1,185 | 93.2%), Two or more Races (60 | 4.7%), and Hispanic or Latino (51 | 4.0%).
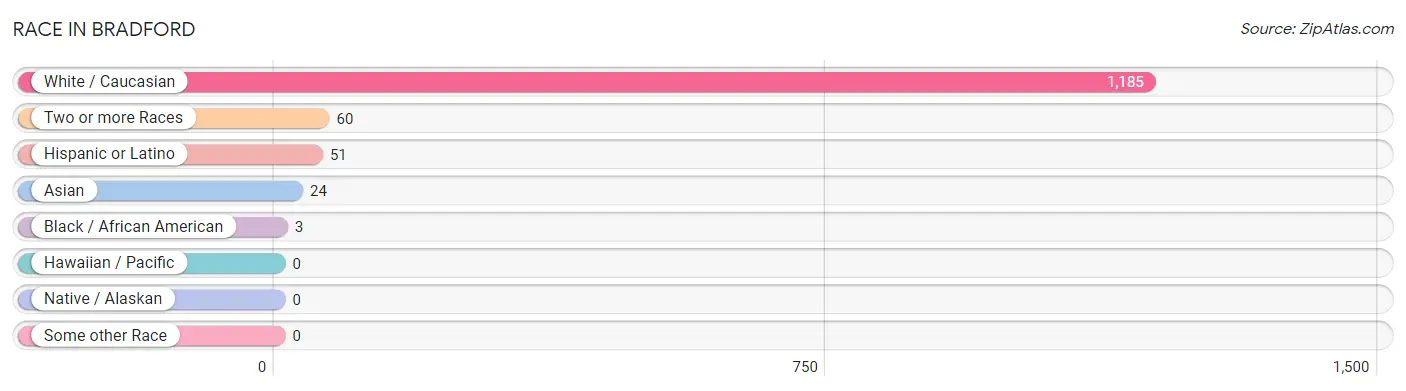
| Race | # Population | % Population |
| Asian | 24 | 1.9% |
| Black / African American | 3 | 0.2% |
| Hawaiian / Pacific | 0 | 0.0% |
| Hispanic or Latino | 51 | 4.0% |
| Native / Alaskan | 0 | 0.0% |
| White / Caucasian | 1,185 | 93.2% |
| Two or more Races | 60 | 4.7% |
| Some other Race | 0 | 0.0% |
| Total | 1,272 | 100.0% |
Ancestry in Bradford
The most populous ancestries reported in Bradford are English (339 | 26.7%), Irish (190 | 14.9%), German (177 | 13.9%), French (176 | 13.8%), and Polish (157 | 12.3%), together accounting for 81.7% of all Bradford residents.
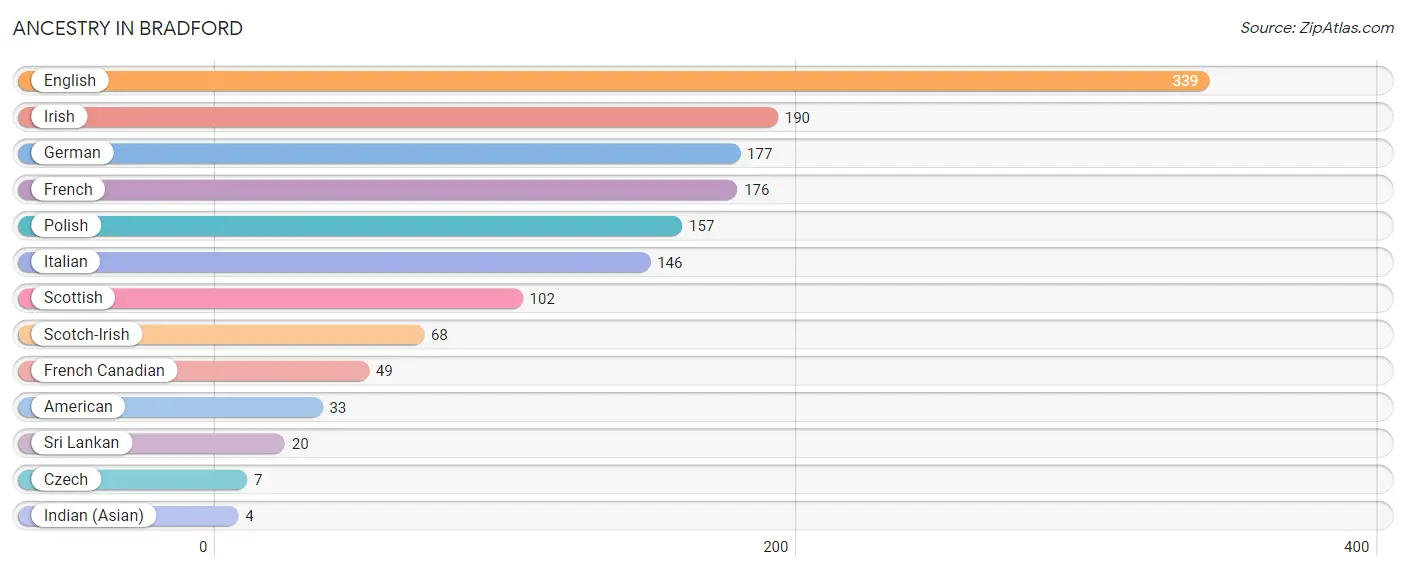
| Ancestry | # Population | % Population |
| American | 33 | 2.6% |
| Czech | 7 | 0.5% |
| English | 339 | 26.7% |
| French | 176 | 13.8% |
| French Canadian | 49 | 3.8% |
| German | 177 | 13.9% |
| Indian (Asian) | 4 | 0.3% |
| Irish | 190 | 14.9% |
| Italian | 146 | 11.5% |
| Polish | 157 | 12.3% |
| Scotch-Irish | 68 | 5.3% |
| Scottish | 102 | 8.0% |
| Sri Lankan | 20 | 1.6% | View All 13 Rows |
Immigrants in Bradford
The most numerous immigrant groups reported in Bradford came from Asia (24 | 1.9%), South Eastern Asia (20 | 1.6%), Vietnam (20 | 1.6%), Africa (13 | 1.0%), and Morocco (13 | 1.0%), together accounting for 7.1% of all Bradford residents.
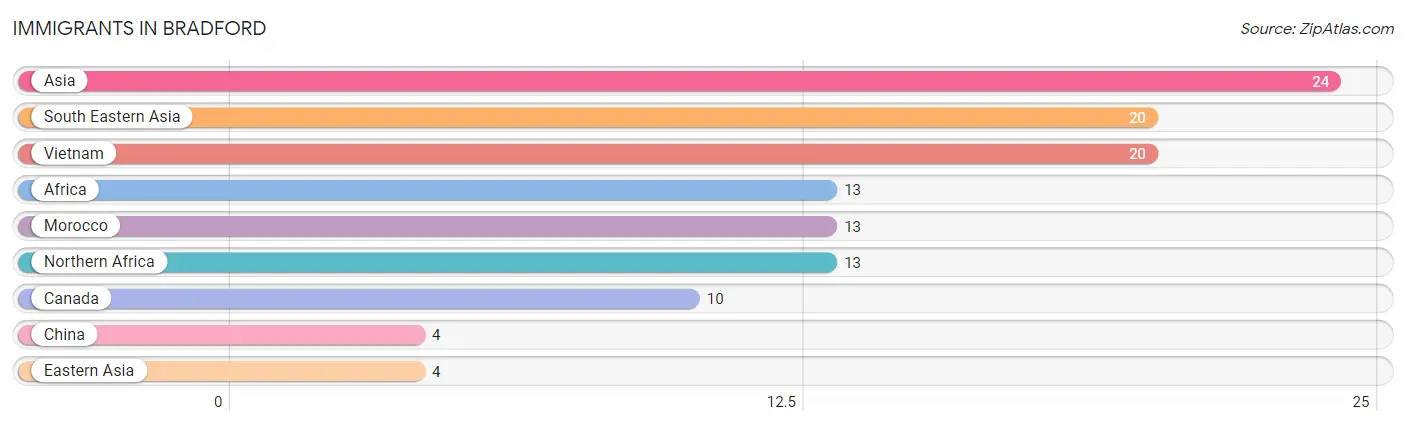
| Immigration Origin | # Population | % Population |
| Africa | 13 | 1.0% |
| Asia | 24 | 1.9% |
| Canada | 10 | 0.8% |
| China | 4 | 0.3% |
| Eastern Asia | 4 | 0.3% |
| Morocco | 13 | 1.0% |
| Northern Africa | 13 | 1.0% |
| South Eastern Asia | 20 | 1.6% |
| Vietnam | 20 | 1.6% | View All 9 Rows |
Sex and Age in Bradford
Sex and Age in Bradford
The most populous age groups in Bradford are 40 to 44 Years (151 | 20.9%) for men and 40 to 44 Years (141 | 25.6%) for women.
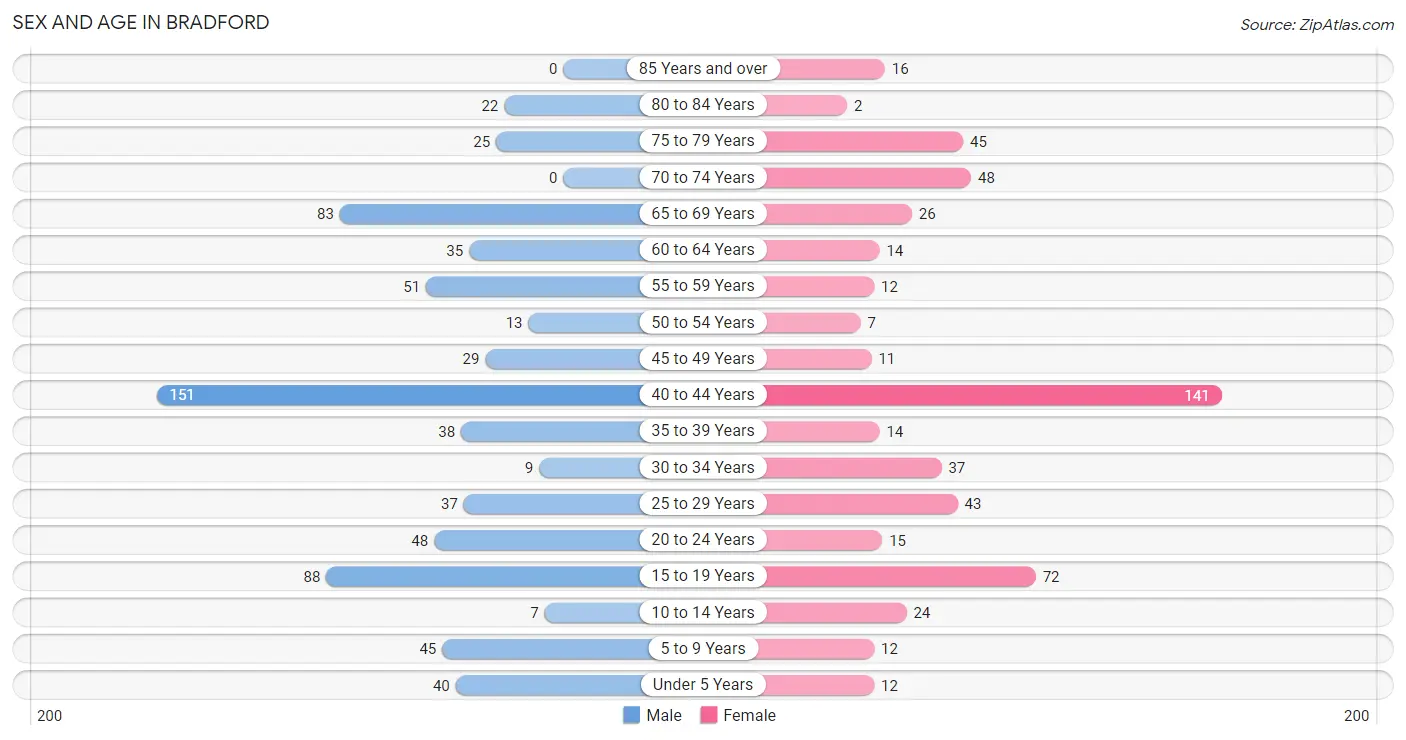
| Age Bracket | Male | Female |
| Under 5 Years | 40 (5.6%) | 12 (2.2%) |
| 5 to 9 Years | 45 (6.2%) | 12 (2.2%) |
| 10 to 14 Years | 7 (1.0%) | 24 (4.4%) |
| 15 to 19 Years | 88 (12.2%) | 72 (13.1%) |
| 20 to 24 Years | 48 (6.7%) | 15 (2.7%) |
| 25 to 29 Years | 37 (5.1%) | 43 (7.8%) |
| 30 to 34 Years | 9 (1.3%) | 37 (6.7%) |
| 35 to 39 Years | 38 (5.3%) | 14 (2.5%) |
| 40 to 44 Years | 151 (20.9%) | 141 (25.6%) |
| 45 to 49 Years | 29 (4.0%) | 11 (2.0%) |
| 50 to 54 Years | 13 (1.8%) | 7 (1.3%) |
| 55 to 59 Years | 51 (7.1%) | 12 (2.2%) |
| 60 to 64 Years | 35 (4.9%) | 14 (2.5%) |
| 65 to 69 Years | 83 (11.5%) | 26 (4.7%) |
| 70 to 74 Years | 0 (0.0%) | 48 (8.7%) |
| 75 to 79 Years | 25 (3.5%) | 45 (8.2%) |
| 80 to 84 Years | 22 (3.0%) | 2 (0.4%) |
| 85 Years and over | 0 (0.0%) | 16 (2.9%) |
| Total | 721 (100.0%) | 551 (100.0%) |
Families and Households in Bradford
Median Family Size in Bradford
The median family size in Bradford is 2.78 persons per family, with married-couple families (280 | 80.9%) accounting for the largest median family size of 2.88 persons per family. On the other hand, single female/mother families (37 | 10.7%) represent the smallest median family size with 2.16 persons per family.
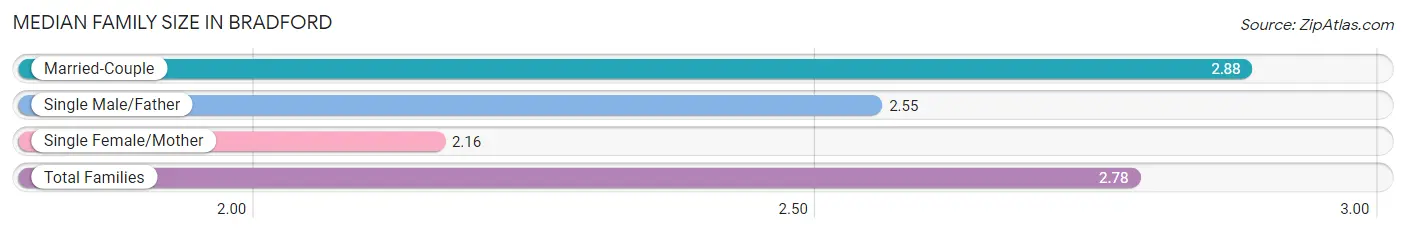
| Family Type | # Families | Family Size |
| Married-Couple | 280 (80.9%) | 2.88 |
| Single Male/Father | 29 (8.4%) | 2.55 |
| Single Female/Mother | 37 (10.7%) | 2.16 |
| Total Families | 346 (100.0%) | 2.78 |
Median Household Size in Bradford
The median household size in Bradford is 2.35 persons per household, with single male/father households (29 | 5.8%) accounting for the largest median household size of 3.07 persons per household. non-family households (153 | 30.7%) represent the smallest median household size with 1.29 persons per household.
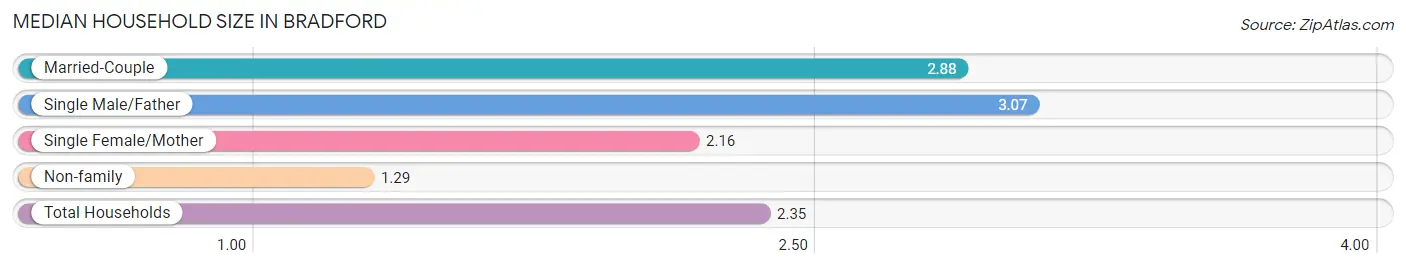
| Household Type | # Households | Household Size |
| Married-Couple | 280 (56.1%) | 2.88 |
| Single Male/Father | 29 (5.8%) | 3.07 |
| Single Female/Mother | 37 (7.4%) | 2.16 |
| Non-family | 153 (30.7%) | 1.29 |
| Total Households | 499 (100.0%) | 2.35 |
Household Size by Marriage Status in Bradford
Out of a total of 499 households in Bradford, 346 (69.3%) are family households, while 153 (30.7%) are nonfamily households. The most numerous type of family households are 3-person households, comprising 150, and the most common type of nonfamily households are 1-person households, comprising 138.
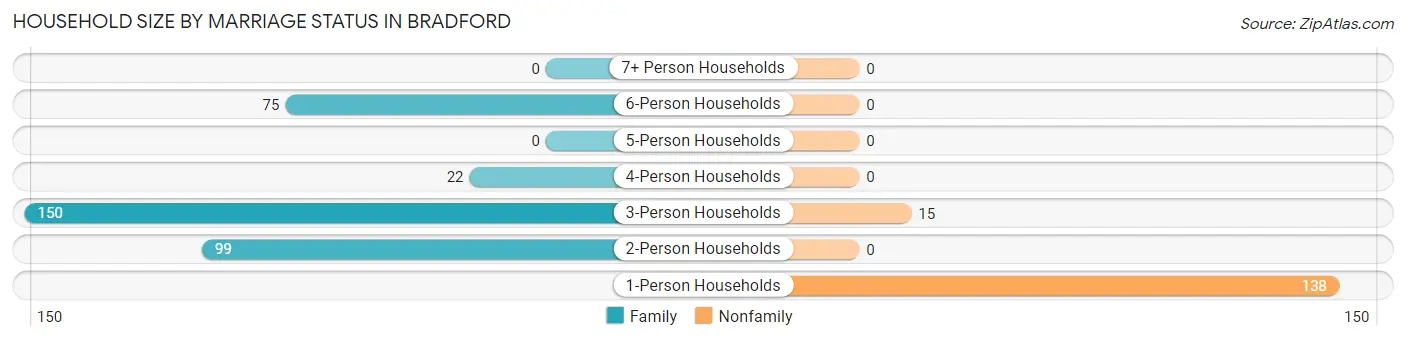
| Household Size | Family Households | Nonfamily Households |
| 1-Person Households | - | 138 (27.7%) |
| 2-Person Households | 99 (19.8%) | 0 (0.0%) |
| 3-Person Households | 150 (30.1%) | 15 (3.0%) |
| 4-Person Households | 22 (4.4%) | 0 (0.0%) |
| 5-Person Households | 0 (0.0%) | 0 (0.0%) |
| 6-Person Households | 75 (15.0%) | 0 (0.0%) |
| 7+ Person Households | 0 (0.0%) | 0 (0.0%) |
| Total | 346 (69.3%) | 153 (30.7%) |
Female Fertility in Bradford
Fertility by Age in Bradford
Average fertility rate in Bradford is 9.0 births per 1,000 women. Women in the age bracket of 20 to 34 years have the highest fertility rate with 32.0 births per 1,000 women. Women in the age bracket of 20 to 34 years acount for 100.0% of all women with births.
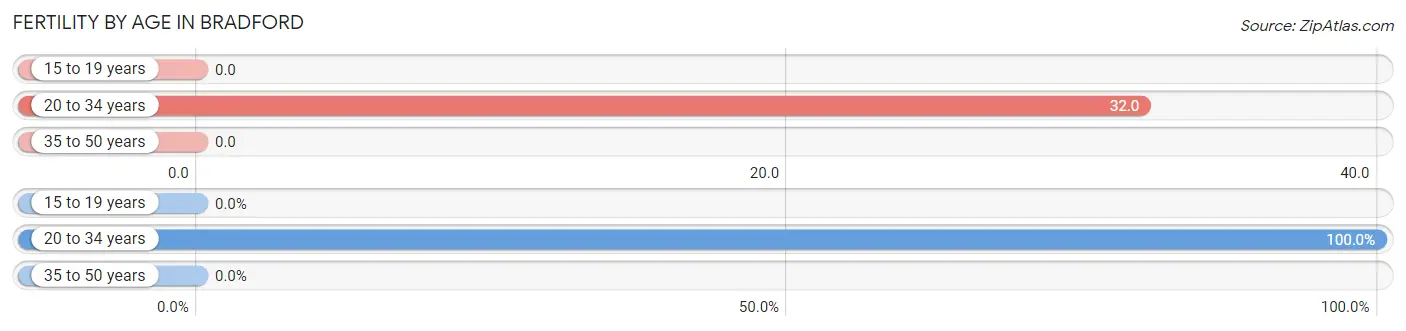
| Age Bracket | Women with Births | Births / 1,000 Women |
| 15 to 19 years | 0 (0.0%) | 0.0 |
| 20 to 34 years | 3 (100.0%) | 32.0 |
| 35 to 50 years | 0 (0.0%) | 0.0 |
| Total | 3 (100.0%) | 9.0 |
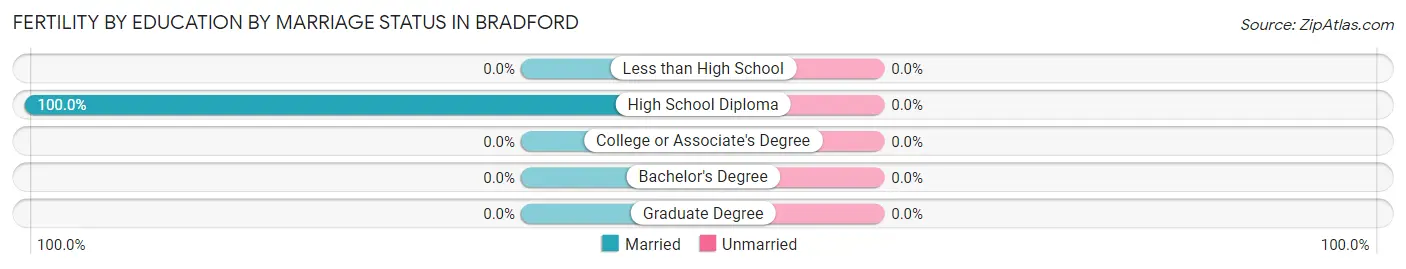
Fertility by Age by Marriage Status in Bradford
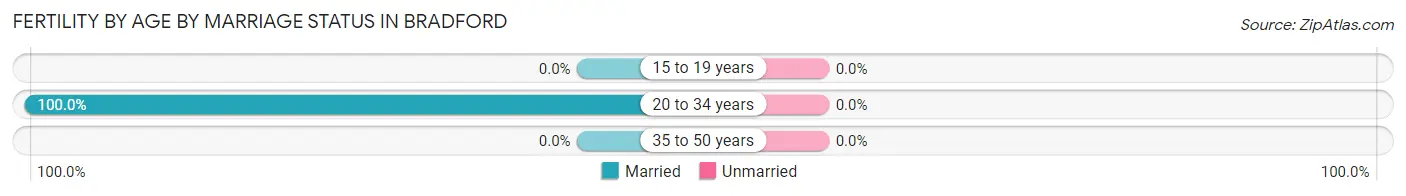
| Age Bracket | Married | Unmarried |
| 15 to 19 years | 0 (0.0%) | 0 (0.0%) |
| 20 to 34 years | 3 (100.0%) | 0 (0.0%) |
| 35 to 50 years | 0 (0.0%) | 0 (0.0%) |
| Total | 3 (100.0%) | 0 (0.0%) |
Fertility by Education in Bradford
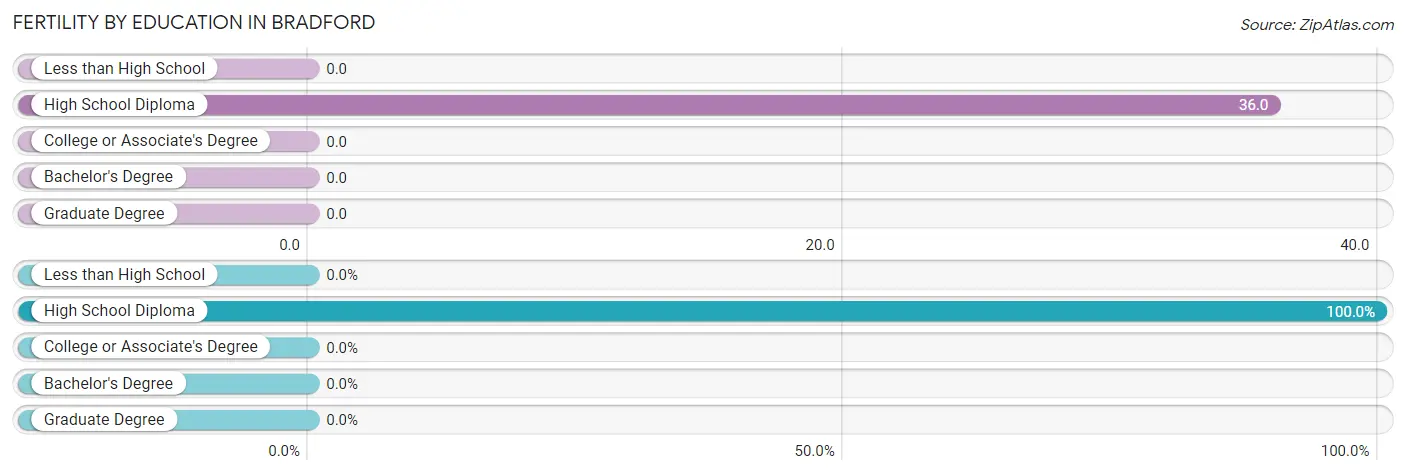
| Educational Attainment | Women with Births | Births / 1,000 Women |
| Less than High School | 0 (0.0%) | 0.0 |
| High School Diploma | 3 (100.0%) | 36.0 |
| College or Associate's Degree | 0 (0.0%) | 0.0 |
| Bachelor's Degree | 0 (0.0%) | 0.0 |
| Graduate Degree | 0 (0.0%) | 0.0 |
| Total | 3 (100.0%) | 9.0 |
Fertility by Education by Marriage Status in Bradford
| Educational Attainment | Married | Unmarried |
| Less than High School | 0 (0.0%) | 0 (0.0%) |
| High School Diploma | 3 (100.0%) | 0 (0.0%) |
| College or Associate's Degree | 0 (0.0%) | 0 (0.0%) |
| Bachelor's Degree | 0 (0.0%) | 0 (0.0%) |
| Graduate Degree | 0 (0.0%) | 0 (0.0%) |
| Total | 3 (100.0%) | 0 (0.0%) |
Employment Characteristics in Bradford
Employment by Class of Employer in Bradford
Among the 657 employed individuals in Bradford, private company employees (257 | 39.1%), local government employees (143 | 21.8%), and not-for-profit organizations (87 | 13.2%) make up the most common classes of employment.
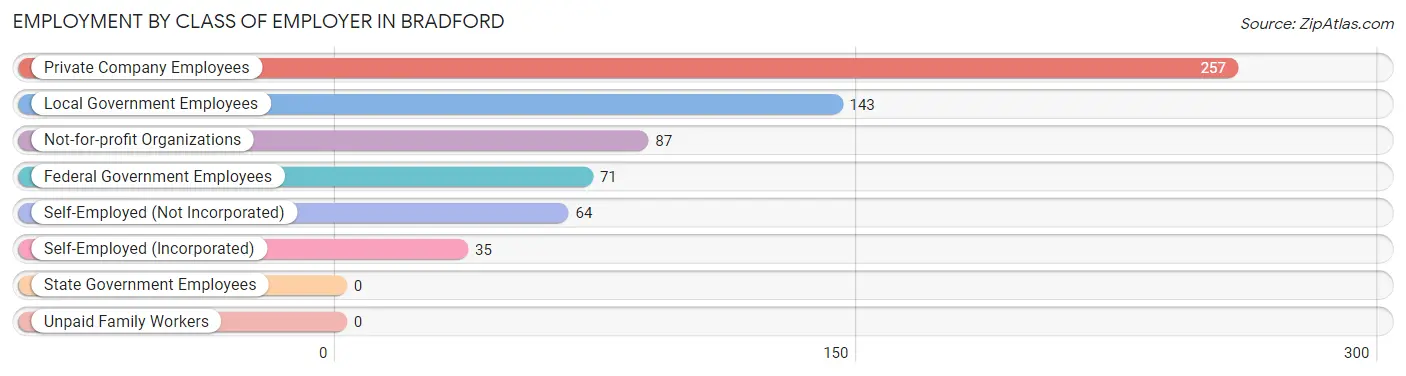
| Employer Class | # Employees | % Employees |
| Private Company Employees | 257 | 39.1% |
| Self-Employed (Incorporated) | 35 | 5.3% |
| Self-Employed (Not Incorporated) | 64 | 9.7% |
| Not-for-profit Organizations | 87 | 13.2% |
| Local Government Employees | 143 | 21.8% |
| State Government Employees | 0 | 0.0% |
| Federal Government Employees | 71 | 10.8% |
| Unpaid Family Workers | 0 | 0.0% |
| Total | 657 | 100.0% |
Employment Status by Age in Bradford
According to the labor force statistics for Bradford, out of the total population over 16 years of age (1,130), 66.0% or 746 individuals are in the labor force, with 4.2% or 31 of them unemployed. The age group with the highest labor force participation rate is 25 to 29 years, with 100.0% or 80 individuals in the labor force. Within the labor force, the 65 to 74 years age range has the highest percentage of unemployed individuals, with 35.2% or 31 of them being unemployed.
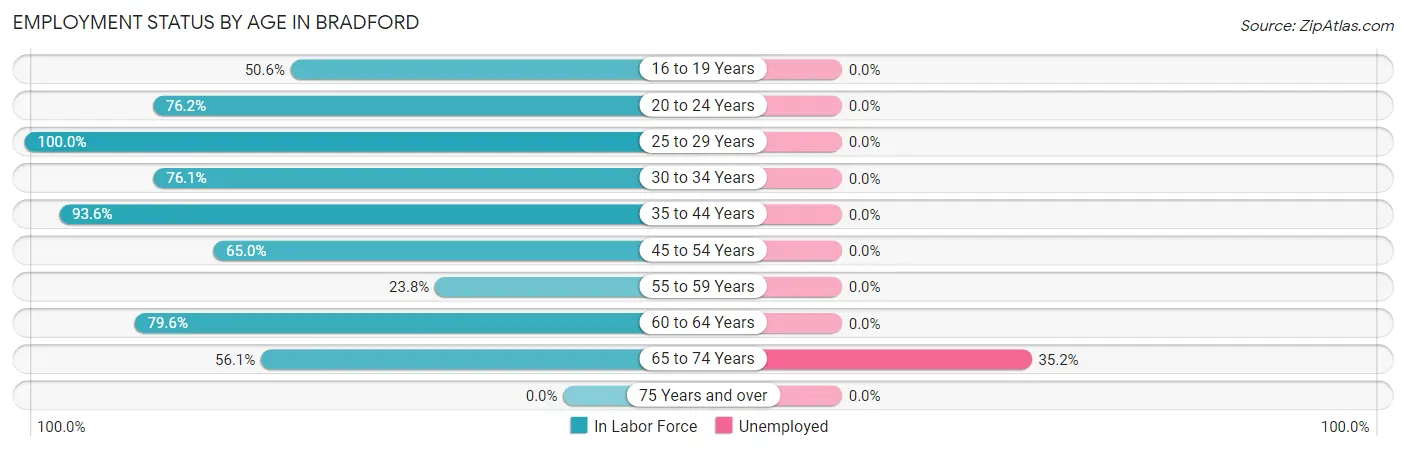
| Age Bracket | In Labor Force | Unemployed |
| 16 to 19 Years | 80 (50.6%) | 0 (0.0%) |
| 20 to 24 Years | 48 (76.2%) | 0 (0.0%) |
| 25 to 29 Years | 80 (100.0%) | 0 (0.0%) |
| 30 to 34 Years | 35 (76.1%) | 0 (0.0%) |
| 35 to 44 Years | 322 (93.6%) | 0 (0.0%) |
| 45 to 54 Years | 39 (65.0%) | 0 (0.0%) |
| 55 to 59 Years | 15 (23.8%) | 0 (0.0%) |
| 60 to 64 Years | 39 (79.6%) | 0 (0.0%) |
| 65 to 74 Years | 88 (56.1%) | 31 (35.2%) |
| 75 Years and over | 0 (0.0%) | 0 (0.0%) |
| Total | 746 (66.0%) | 31 (4.2%) |
Employment Status by Educational Attainment in Bradford
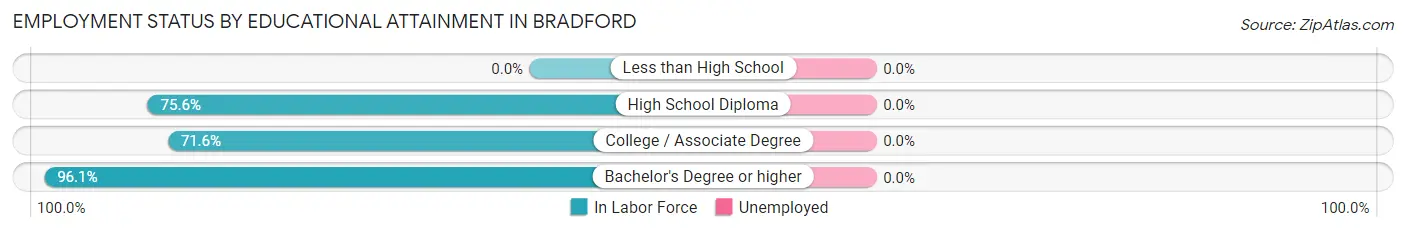
| Educational Attainment | In Labor Force | Unemployed |
| Less than High School | 0 (0.0%) | 0 (0.0%) |
| High School Diploma | 146 (75.6%) | 0 (0.0%) |
| College / Associate Degree | 116 (71.6%) | 0 (0.0%) |
| Bachelor's Degree or higher | 268 (96.1%) | 0 (0.0%) |
| Total | 530 (82.6%) | 0 (0.0%) |
Employment Occupations by Sex in Bradford
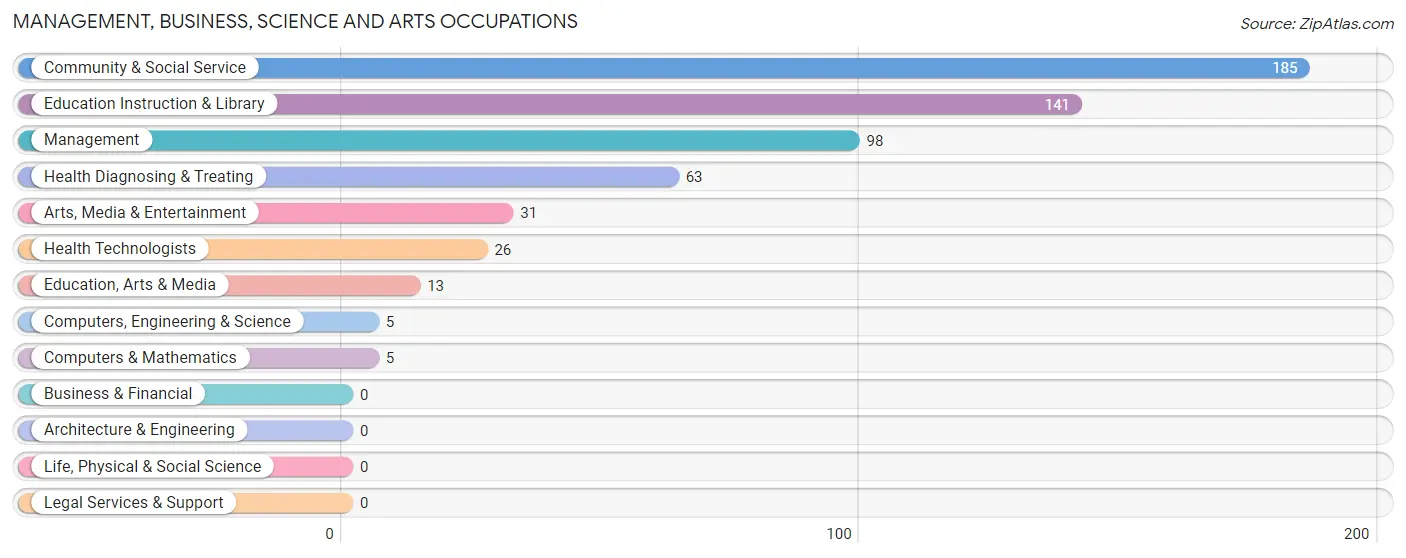
Management, Business, Science and Arts Occupations
The most common Management, Business, Science and Arts occupations in Bradford are Community & Social Service (185 | 25.9%), Education Instruction & Library (141 | 19.7%), Management (98 | 13.7%), Health Diagnosing & Treating (63 | 8.8%), and Arts, Media & Entertainment (31 | 4.3%).
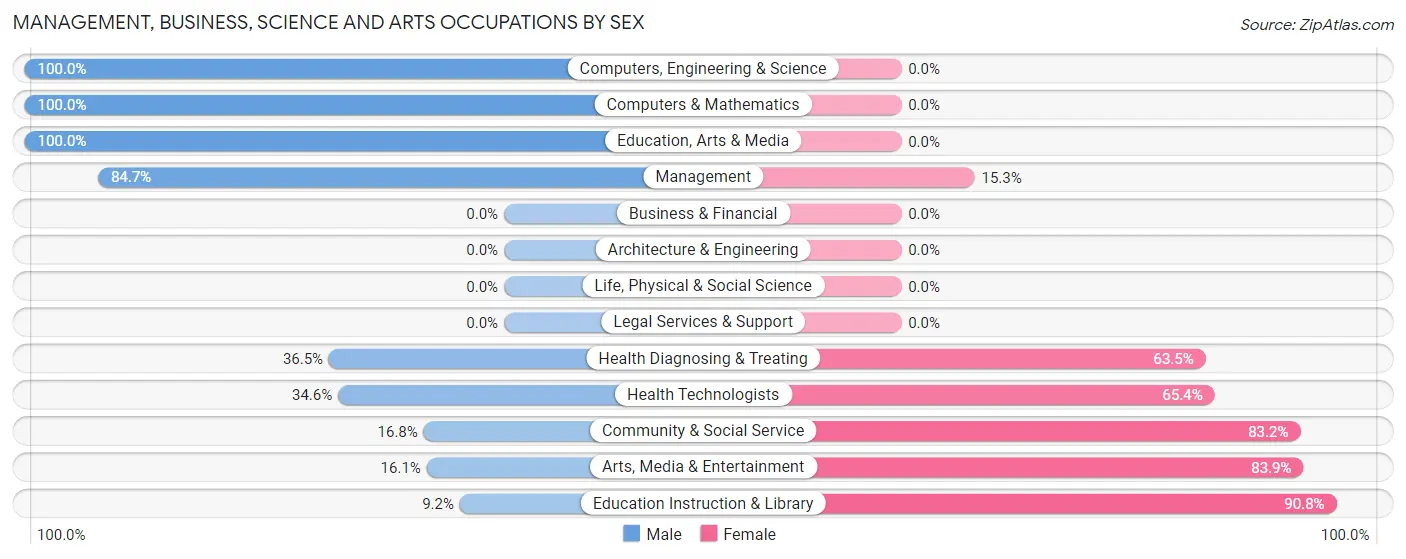
Management, Business, Science and Arts Occupations by Sex
Within the Management, Business, Science and Arts occupations in Bradford, the most male-oriented occupations are Computers, Engineering & Science (100.0%), Computers & Mathematics (100.0%), and Education, Arts & Media (100.0%), while the most female-oriented occupations are Education Instruction & Library (90.8%), Arts, Media & Entertainment (83.9%), and Community & Social Service (83.2%).
| Occupation | Male | Female |
| Management | 83 (84.7%) | 15 (15.3%) |
| Business & Financial | 0 (0.0%) | 0 (0.0%) |
| Computers, Engineering & Science | 5 (100.0%) | 0 (0.0%) |
| Computers & Mathematics | 5 (100.0%) | 0 (0.0%) |
| Architecture & Engineering | 0 (0.0%) | 0 (0.0%) |
| Life, Physical & Social Science | 0 (0.0%) | 0 (0.0%) |
| Community & Social Service | 31 (16.8%) | 154 (83.2%) |
| Education, Arts & Media | 13 (100.0%) | 0 (0.0%) |
| Legal Services & Support | 0 (0.0%) | 0 (0.0%) |
| Education Instruction & Library | 13 (9.2%) | 128 (90.8%) |
| Arts, Media & Entertainment | 5 (16.1%) | 26 (83.9%) |
| Health Diagnosing & Treating | 23 (36.5%) | 40 (63.5%) |
| Health Technologists | 9 (34.6%) | 17 (65.4%) |
| Total (Category) | 142 (40.5%) | 209 (59.5%) |
| Total (Overall) | 410 (57.3%) | 305 (42.7%) |
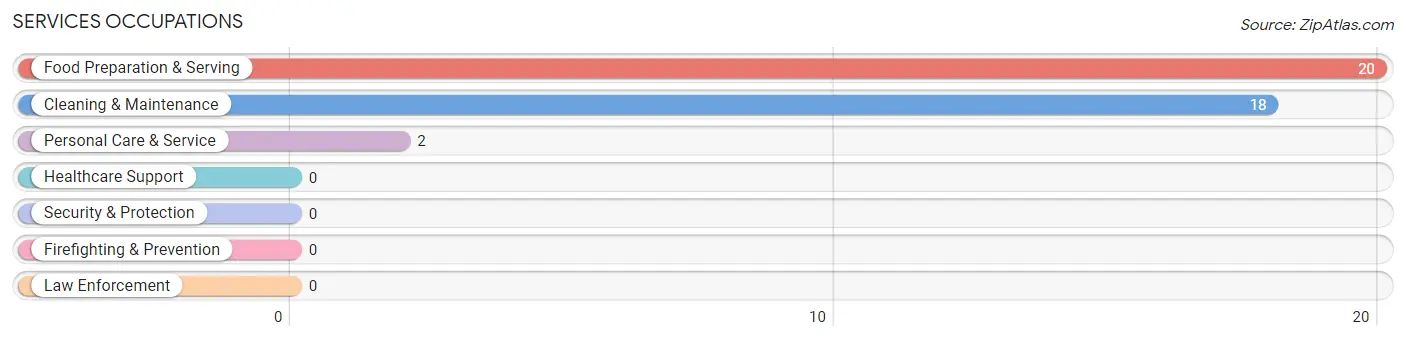
Services Occupations
The most common Services occupations in Bradford are Food Preparation & Serving (20 | 2.8%), Cleaning & Maintenance (18 | 2.5%), and Personal Care & Service (2 | 0.3%).
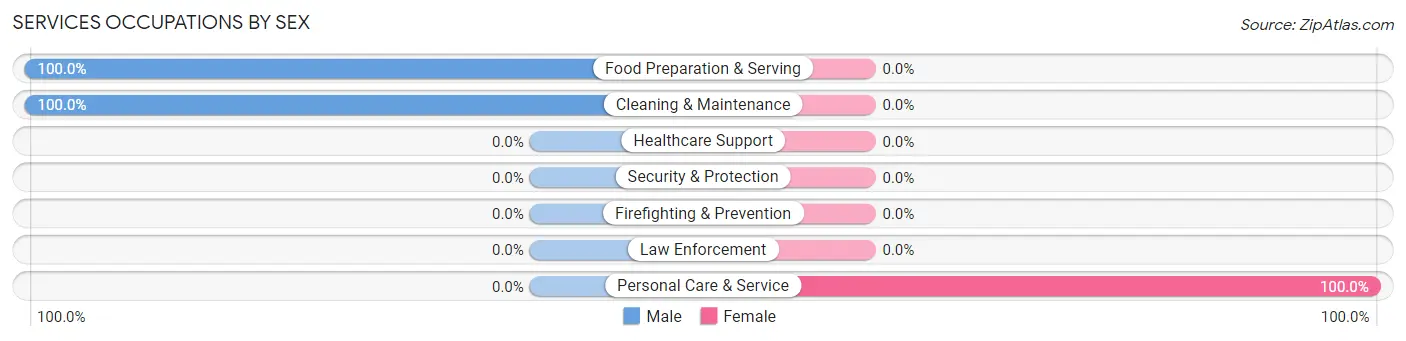
Services Occupations by Sex
| Occupation | Male | Female |
| Healthcare Support | 0 (0.0%) | 0 (0.0%) |
| Security & Protection | 0 (0.0%) | 0 (0.0%) |
| Firefighting & Prevention | 0 (0.0%) | 0 (0.0%) |
| Law Enforcement | 0 (0.0%) | 0 (0.0%) |
| Food Preparation & Serving | 20 (100.0%) | 0 (0.0%) |
| Cleaning & Maintenance | 18 (100.0%) | 0 (0.0%) |
| Personal Care & Service | 0 (0.0%) | 2 (100.0%) |
| Total (Category) | 38 (95.0%) | 2 (5.0%) |
| Total (Overall) | 410 (57.3%) | 305 (42.7%) |
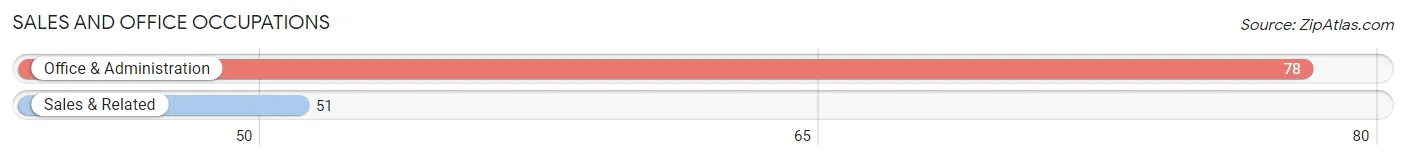
Sales and Office Occupations
The most common Sales and Office occupations in Bradford are Office & Administration (78 | 10.9%), and Sales & Related (51 | 7.1%).
Sales and Office Occupations by Sex
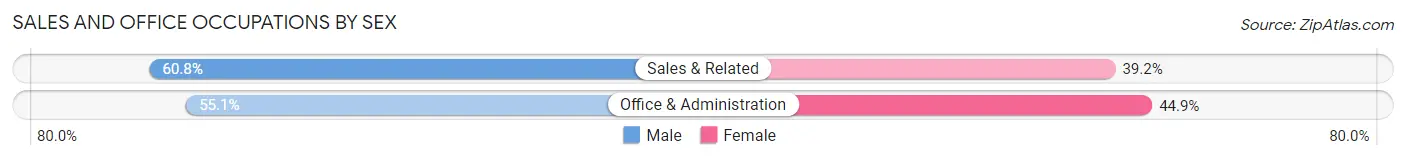
| Occupation | Male | Female |
| Sales & Related | 31 (60.8%) | 20 (39.2%) |
| Office & Administration | 43 (55.1%) | 35 (44.9%) |
| Total (Category) | 74 (57.4%) | 55 (42.6%) |
| Total (Overall) | 410 (57.3%) | 305 (42.7%) |
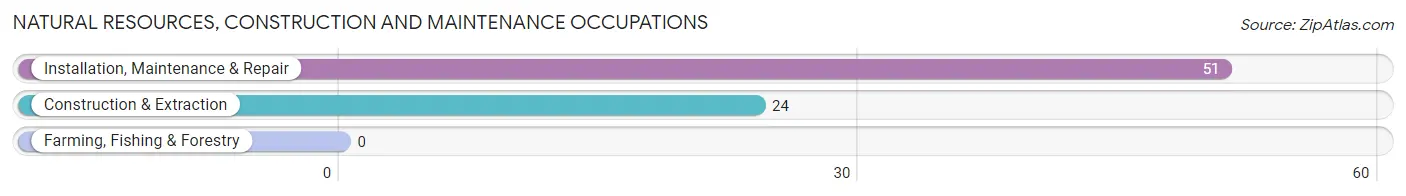
Natural Resources, Construction and Maintenance Occupations
The most common Natural Resources, Construction and Maintenance occupations in Bradford are Installation, Maintenance & Repair (51 | 7.1%), and Construction & Extraction (24 | 3.4%).
Natural Resources, Construction and Maintenance Occupations by Sex
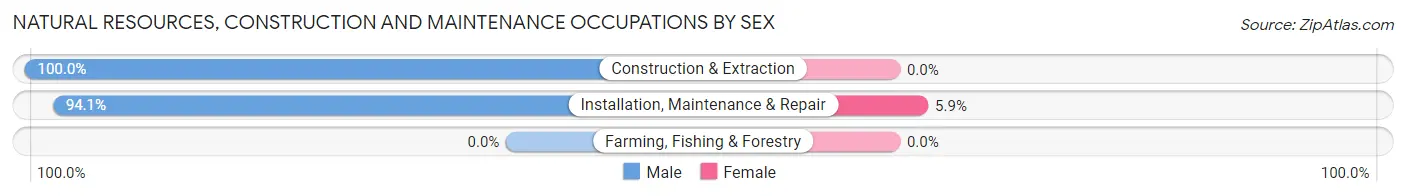
| Occupation | Male | Female |
| Farming, Fishing & Forestry | 0 (0.0%) | 0 (0.0%) |
| Construction & Extraction | 24 (100.0%) | 0 (0.0%) |
| Installation, Maintenance & Repair | 48 (94.1%) | 3 (5.9%) |
| Total (Category) | 72 (96.0%) | 3 (4.0%) |
| Total (Overall) | 410 (57.3%) | 305 (42.7%) |
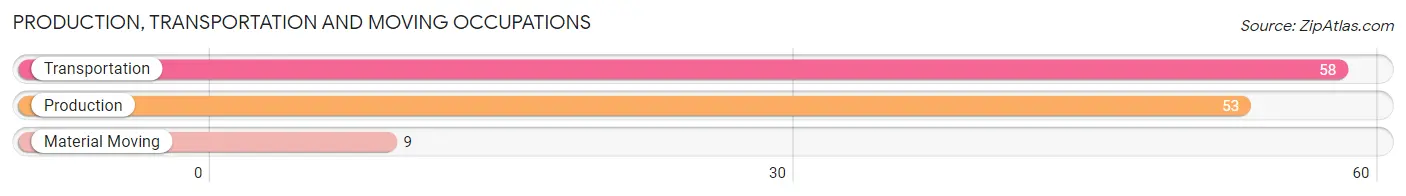
Production, Transportation and Moving Occupations
The most common Production, Transportation and Moving occupations in Bradford are Transportation (58 | 8.1%), Production (53 | 7.4%), and Material Moving (9 | 1.3%).
Production, Transportation and Moving Occupations by Sex
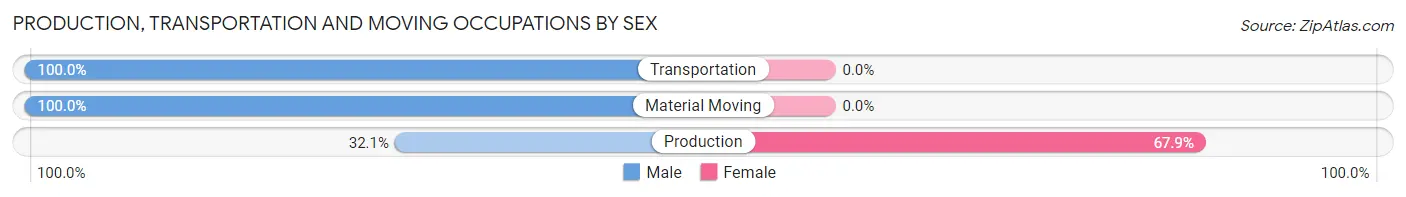
| Occupation | Male | Female |
| Production | 17 (32.1%) | 36 (67.9%) |
| Transportation | 58 (100.0%) | 0 (0.0%) |
| Material Moving | 9 (100.0%) | 0 (0.0%) |
| Total (Category) | 84 (70.0%) | 36 (30.0%) |
| Total (Overall) | 410 (57.3%) | 305 (42.7%) |
Employment Industries by Sex in Bradford
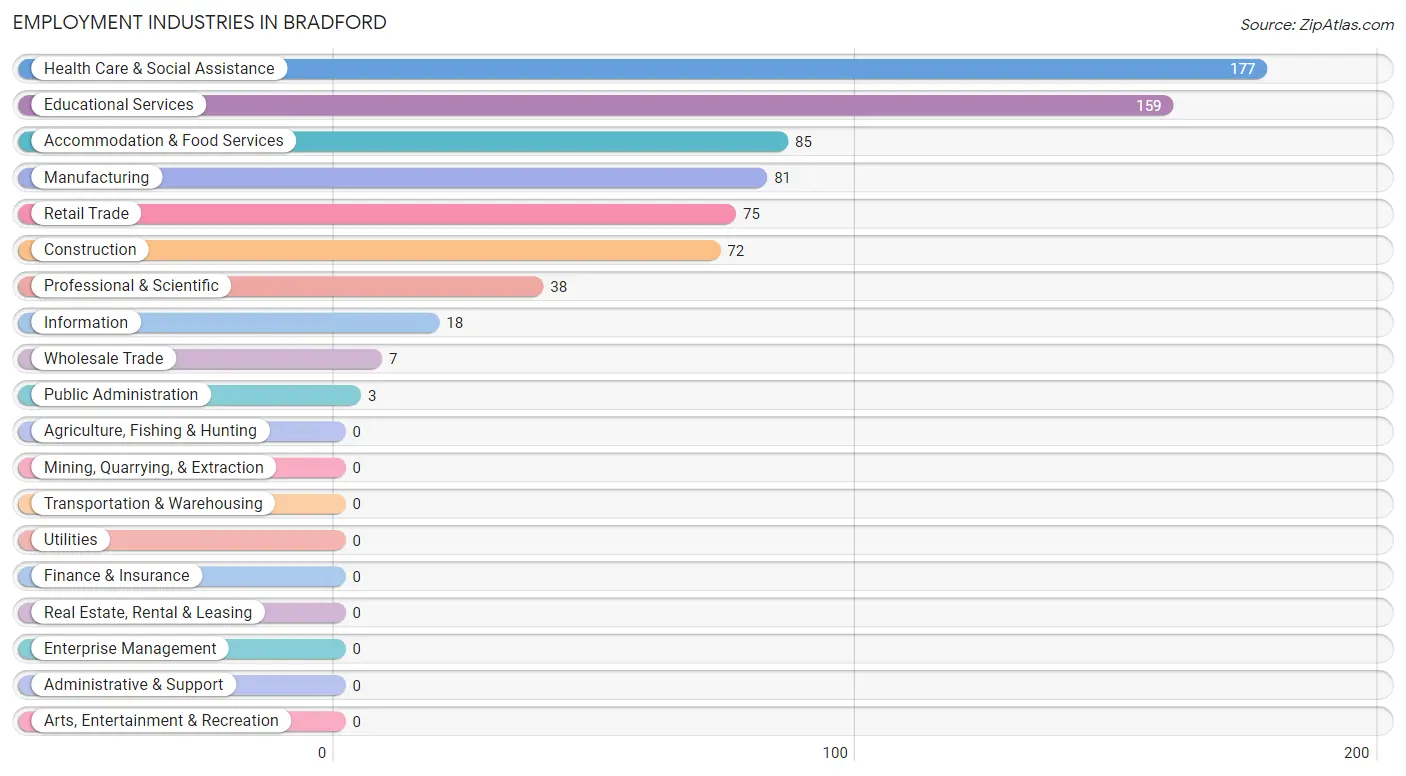
Employment Industries in Bradford
The major employment industries in Bradford include Health Care & Social Assistance (177 | 24.8%), Educational Services (159 | 22.2%), Accommodation & Food Services (85 | 11.9%), Manufacturing (81 | 11.3%), and Retail Trade (75 | 10.5%).
Employment Industries by Sex in Bradford
The Bradford industries that see more men than women are Construction (100.0%), Information (100.0%), and Accommodation & Food Services (91.8%), whereas the industries that tend to have a higher number of women are Wholesale Trade (100.0%), Professional & Scientific (100.0%), and Public Administration (100.0%).
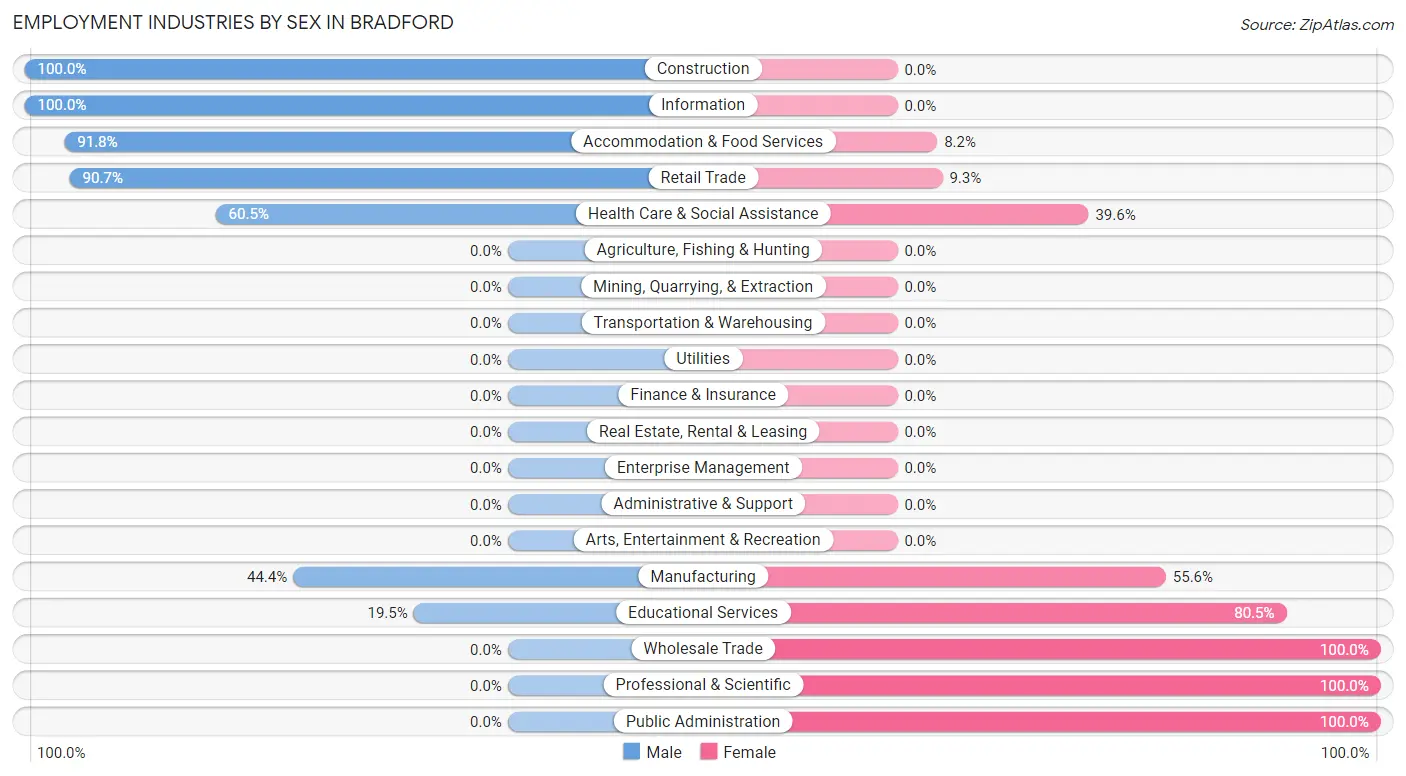
| Industry | Male | Female |
| Agriculture, Fishing & Hunting | 0 (0.0%) | 0 (0.0%) |
| Mining, Quarrying, & Extraction | 0 (0.0%) | 0 (0.0%) |
| Construction | 72 (100.0%) | 0 (0.0%) |
| Manufacturing | 36 (44.4%) | 45 (55.6%) |
| Wholesale Trade | 0 (0.0%) | 7 (100.0%) |
| Retail Trade | 68 (90.7%) | 7 (9.3%) |
| Transportation & Warehousing | 0 (0.0%) | 0 (0.0%) |
| Utilities | 0 (0.0%) | 0 (0.0%) |
| Information | 18 (100.0%) | 0 (0.0%) |
| Finance & Insurance | 0 (0.0%) | 0 (0.0%) |
| Real Estate, Rental & Leasing | 0 (0.0%) | 0 (0.0%) |
| Professional & Scientific | 0 (0.0%) | 38 (100.0%) |
| Enterprise Management | 0 (0.0%) | 0 (0.0%) |
| Administrative & Support | 0 (0.0%) | 0 (0.0%) |
| Educational Services | 31 (19.5%) | 128 (80.5%) |
| Health Care & Social Assistance | 107 (60.5%) | 70 (39.6%) |
| Arts, Entertainment & Recreation | 0 (0.0%) | 0 (0.0%) |
| Accommodation & Food Services | 78 (91.8%) | 7 (8.2%) |
| Public Administration | 0 (0.0%) | 3 (100.0%) |
| Total | 410 (57.3%) | 305 (42.7%) |
Education in Bradford
School Enrollment in Bradford
The most common levels of schooling among the 247 students in Bradford are high school (161 | 65.2%), elementary school (35 | 14.2%), and nursery / preschool (21 | 8.5%).
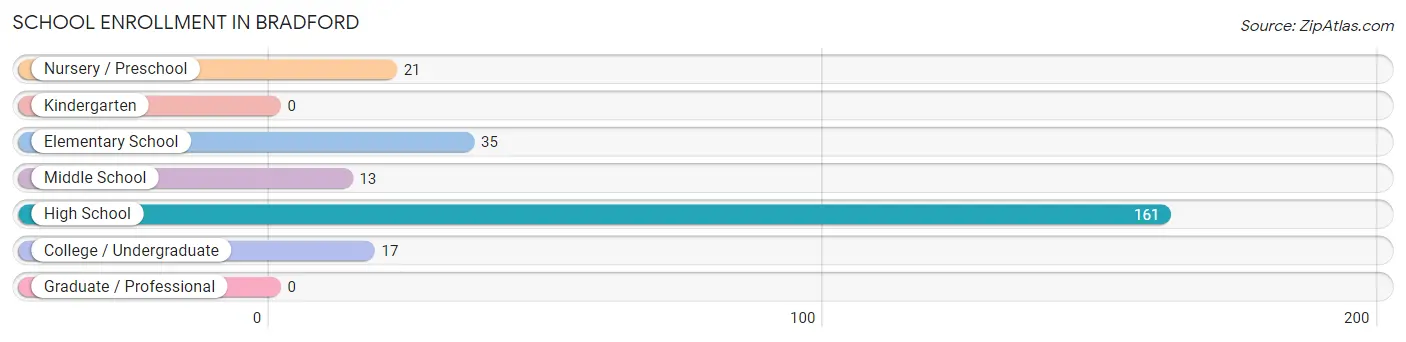
| School Level | # Students | % Students |
| Nursery / Preschool | 21 | 8.5% |
| Kindergarten | 0 | 0.0% |
| Elementary School | 35 | 14.2% |
| Middle School | 13 | 5.3% |
| High School | 161 | 65.2% |
| College / Undergraduate | 17 | 6.9% |
| Graduate / Professional | 0 | 0.0% |
| Total | 247 | 100.0% |
School Enrollment by Age by Funding Source in Bradford
Out of a total of 247 students who are enrolled in schools in Bradford, 57 (23.1%) attend a private institution, while the remaining 190 (76.9%) are enrolled in public schools. The age group of 18 to 19 year olds has the highest likelihood of being enrolled in private schools, with 15 (88.2% in the age bracket) enrolled. Conversely, the age group of 15 to 17 year olds has the lowest likelihood of being enrolled in a private school, with 139 (97.2% in the age bracket) attending a public institution.
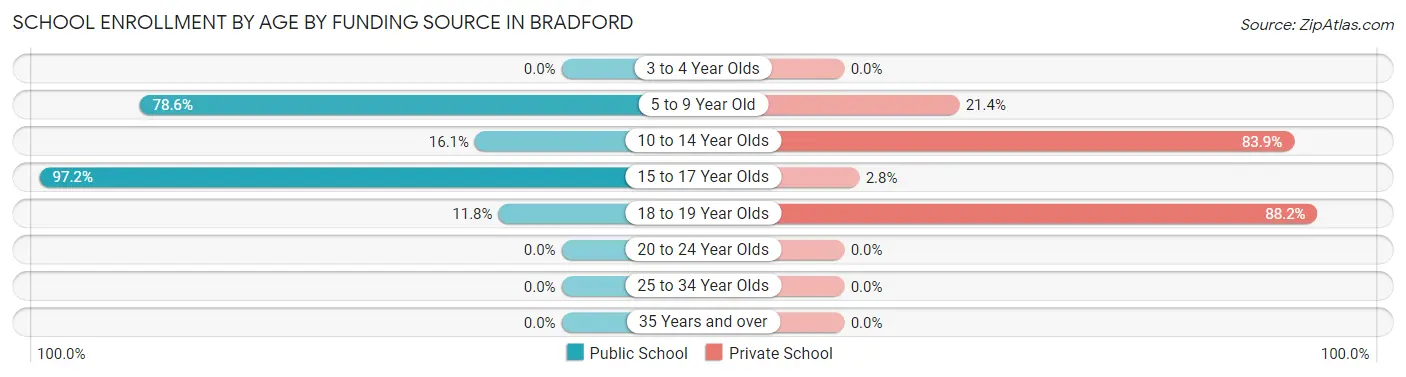
| Age Bracket | Public School | Private School |
| 3 to 4 Year Olds | 0 (0.0%) | 0 (0.0%) |
| 5 to 9 Year Old | 44 (78.6%) | 12 (21.4%) |
| 10 to 14 Year Olds | 5 (16.1%) | 26 (83.9%) |
| 15 to 17 Year Olds | 139 (97.2%) | 4 (2.8%) |
| 18 to 19 Year Olds | 2 (11.8%) | 15 (88.2%) |
| 20 to 24 Year Olds | 0 (0.0%) | 0 (0.0%) |
| 25 to 34 Year Olds | 0 (0.0%) | 0 (0.0%) |
| 35 Years and over | 0 (0.0%) | 0 (0.0%) |
| Total | 190 (76.9%) | 57 (23.1%) |
Educational Attainment by Field of Study in Bradford
Education (118 | 33.3%), social sciences (74 | 20.9%), bio, nature & agricultural (71 | 20.1%), arts & humanities (37 | 10.4%), and science & technology (17 | 4.8%) are the most common fields of study among 354 individuals in Bradford who have obtained a bachelor's degree or higher.
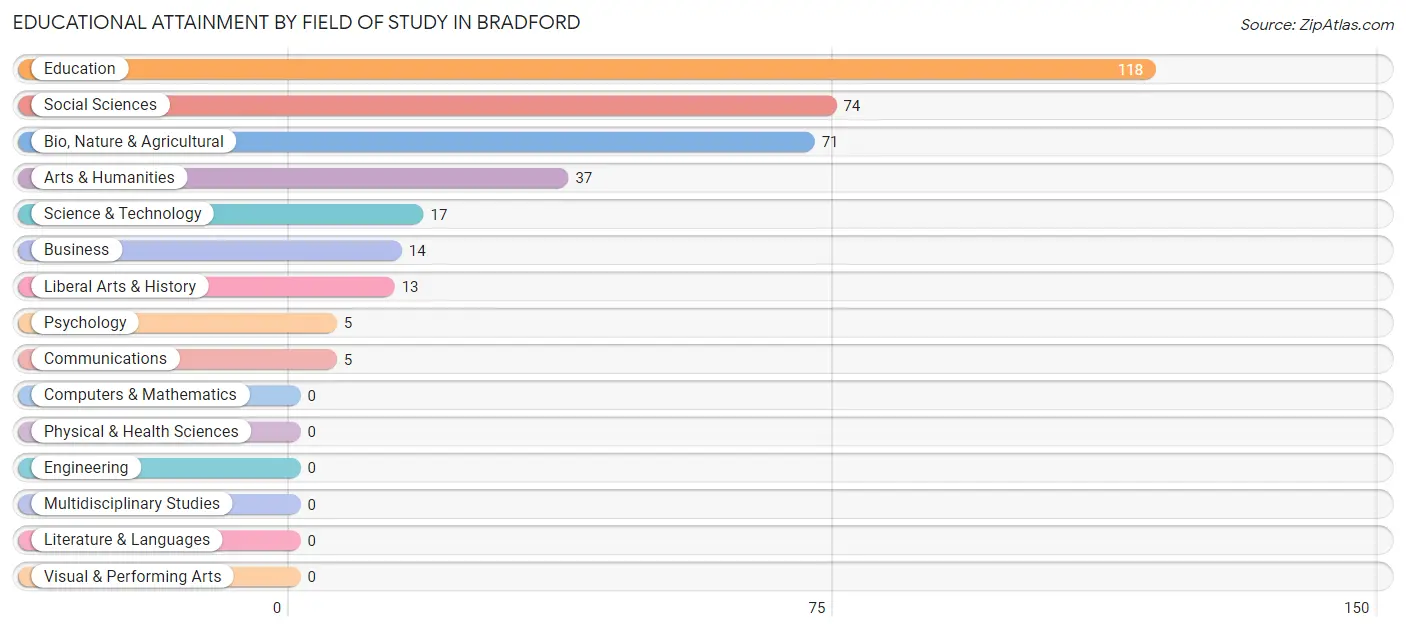
| Field of Study | # Graduates | % Graduates |
| Computers & Mathematics | 0 | 0.0% |
| Bio, Nature & Agricultural | 71 | 20.1% |
| Physical & Health Sciences | 0 | 0.0% |
| Psychology | 5 | 1.4% |
| Social Sciences | 74 | 20.9% |
| Engineering | 0 | 0.0% |
| Multidisciplinary Studies | 0 | 0.0% |
| Science & Technology | 17 | 4.8% |
| Business | 14 | 4.0% |
| Education | 118 | 33.3% |
| Literature & Languages | 0 | 0.0% |
| Liberal Arts & History | 13 | 3.7% |
| Visual & Performing Arts | 0 | 0.0% |
| Communications | 5 | 1.4% |
| Arts & Humanities | 37 | 10.4% |
| Total | 354 | 100.0% |
Transportation & Commute in Bradford
Vehicle Availability by Sex in Bradford
The most prevalent vehicle ownership categories in Bradford are males with 3 vehicles (249, accounting for 73.0%) and females with 3 vehicles (160, making up 81.6%).
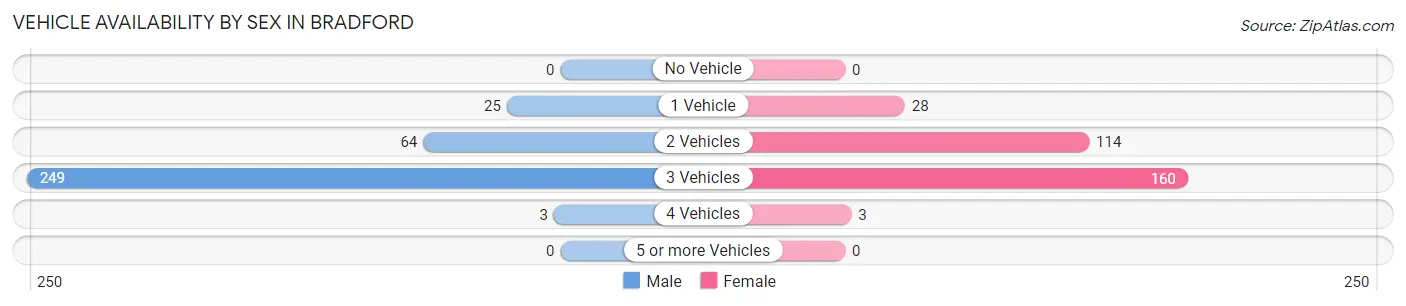
| Vehicles Available | Male | Female |
| No Vehicle | 0 (0.0%) | 0 (0.0%) |
| 1 Vehicle | 25 (7.3%) | 28 (9.2%) |
| 2 Vehicles | 64 (18.8%) | 114 (37.4%) |
| 3 Vehicles | 249 (73.0%) | 160 (52.5%) |
| 4 Vehicles | 3 (0.9%) | 3 (1.0%) |
| 5 or more Vehicles | 0 (0.0%) | 0 (0.0%) |
| Total | 341 (100.0%) | 305 (100.0%) |
Commute Time in Bradford
The most frequently occuring commute durations in Bradford are 35 to 39 minutes (125 commuters, 22.1%), 5 to 9 minutes (110 commuters, 19.4%), and 30 to 34 minutes (86 commuters, 15.2%).
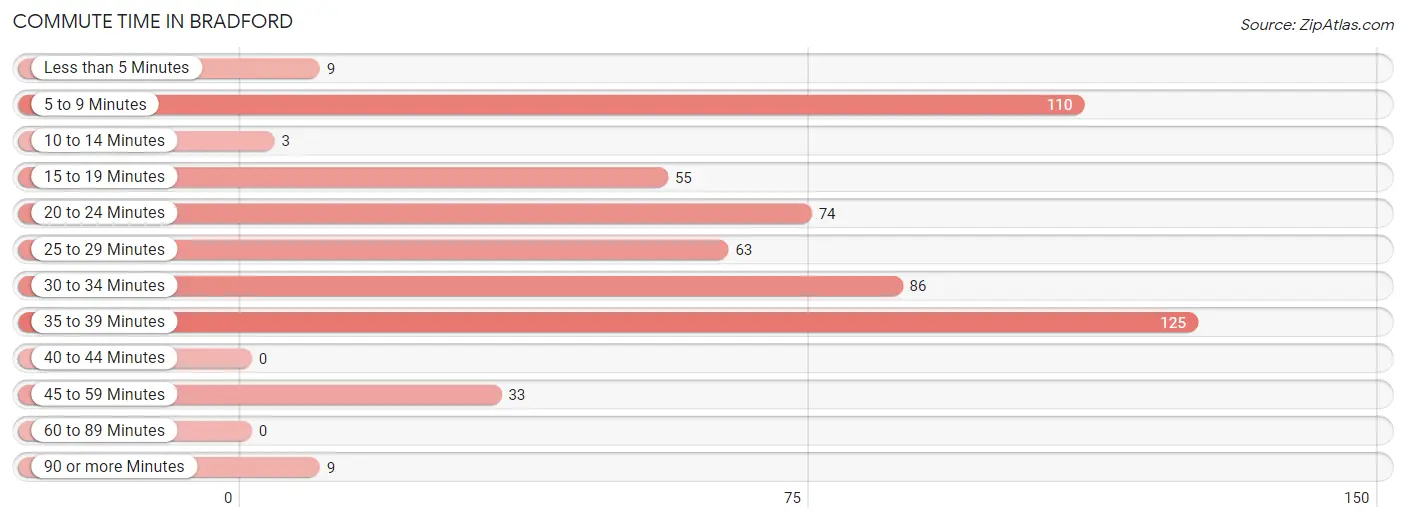
| Commute Time | # Commuters | % Commuters |
| Less than 5 Minutes | 9 | 1.6% |
| 5 to 9 Minutes | 110 | 19.4% |
| 10 to 14 Minutes | 3 | 0.5% |
| 15 to 19 Minutes | 55 | 9.7% |
| 20 to 24 Minutes | 74 | 13.1% |
| 25 to 29 Minutes | 63 | 11.1% |
| 30 to 34 Minutes | 86 | 15.2% |
| 35 to 39 Minutes | 125 | 22.1% |
| 40 to 44 Minutes | 0 | 0.0% |
| 45 to 59 Minutes | 33 | 5.8% |
| 60 to 89 Minutes | 0 | 0.0% |
| 90 or more Minutes | 9 | 1.6% |
Commute Time by Sex in Bradford
The most common commute times in Bradford are 35 to 39 minutes (120 commuters, 41.2%) for males and 5 to 9 minutes (99 commuters, 35.9%) for females.
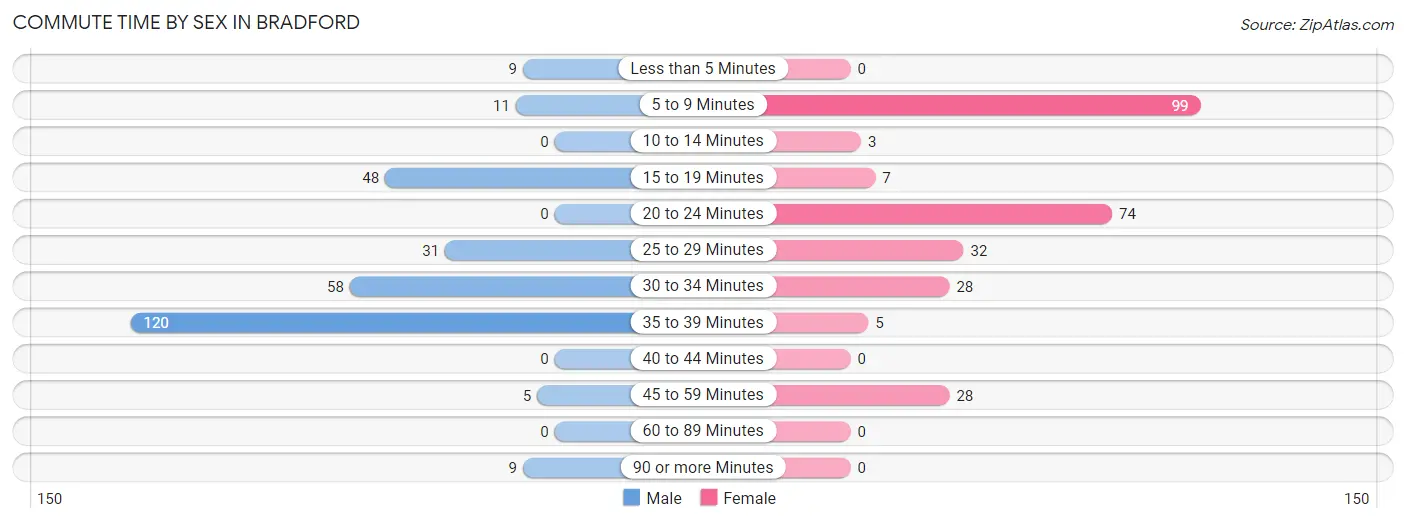
| Commute Time | Male | Female |
| Less than 5 Minutes | 9 (3.1%) | 0 (0.0%) |
| 5 to 9 Minutes | 11 (3.8%) | 99 (35.9%) |
| 10 to 14 Minutes | 0 (0.0%) | 3 (1.1%) |
| 15 to 19 Minutes | 48 (16.5%) | 7 (2.5%) |
| 20 to 24 Minutes | 0 (0.0%) | 74 (26.8%) |
| 25 to 29 Minutes | 31 (10.6%) | 32 (11.6%) |
| 30 to 34 Minutes | 58 (19.9%) | 28 (10.1%) |
| 35 to 39 Minutes | 120 (41.2%) | 5 (1.8%) |
| 40 to 44 Minutes | 0 (0.0%) | 0 (0.0%) |
| 45 to 59 Minutes | 5 (1.7%) | 28 (10.1%) |
| 60 to 89 Minutes | 0 (0.0%) | 0 (0.0%) |
| 90 or more Minutes | 9 (3.1%) | 0 (0.0%) |
Time of Departure to Work by Sex in Bradford
The most frequent times of departure to work in Bradford are 7:00 AM to 7:29 AM (109, 37.5%) for males and 7:00 AM to 7:29 AM (150, 54.3%) for females.
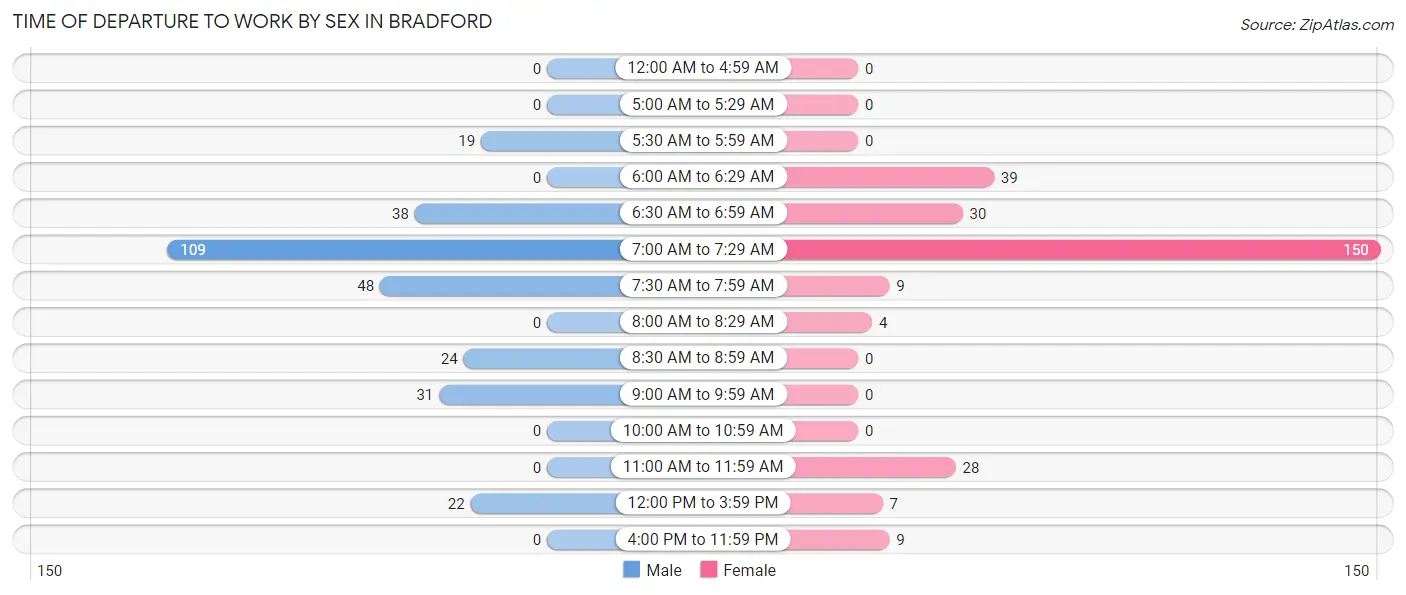
| Time of Departure | Male | Female |
| 12:00 AM to 4:59 AM | 0 (0.0%) | 0 (0.0%) |
| 5:00 AM to 5:29 AM | 0 (0.0%) | 0 (0.0%) |
| 5:30 AM to 5:59 AM | 19 (6.5%) | 0 (0.0%) |
| 6:00 AM to 6:29 AM | 0 (0.0%) | 39 (14.1%) |
| 6:30 AM to 6:59 AM | 38 (13.1%) | 30 (10.9%) |
| 7:00 AM to 7:29 AM | 109 (37.5%) | 150 (54.3%) |
| 7:30 AM to 7:59 AM | 48 (16.5%) | 9 (3.3%) |
| 8:00 AM to 8:29 AM | 0 (0.0%) | 4 (1.5%) |
| 8:30 AM to 8:59 AM | 24 (8.3%) | 0 (0.0%) |
| 9:00 AM to 9:59 AM | 31 (10.6%) | 0 (0.0%) |
| 10:00 AM to 10:59 AM | 0 (0.0%) | 0 (0.0%) |
| 11:00 AM to 11:59 AM | 0 (0.0%) | 28 (10.1%) |
| 12:00 PM to 3:59 PM | 22 (7.6%) | 7 (2.5%) |
| 4:00 PM to 11:59 PM | 0 (0.0%) | 9 (3.3%) |
| Total | 291 (100.0%) | 276 (100.0%) |
Housing Occupancy in Bradford
Occupancy by Ownership in Bradford
Of the total 499 dwellings in Bradford, owner-occupied units account for 351 (70.3%), while renter-occupied units make up 148 (29.7%).
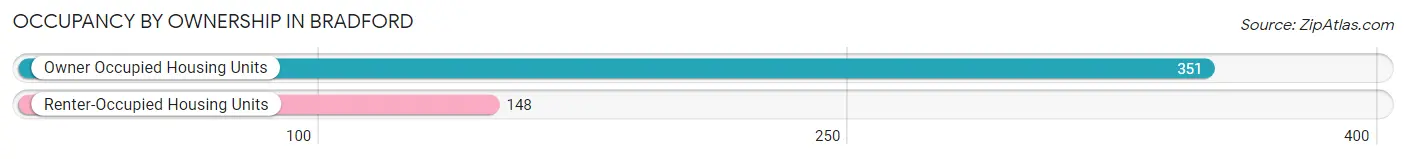
| Occupancy | # Housing Units | % Housing Units |
| Owner Occupied Housing Units | 351 | 70.3% |
| Renter-Occupied Housing Units | 148 | 29.7% |
| Total Occupied Housing Units | 499 | 100.0% |
Occupancy by Household Size in Bradford
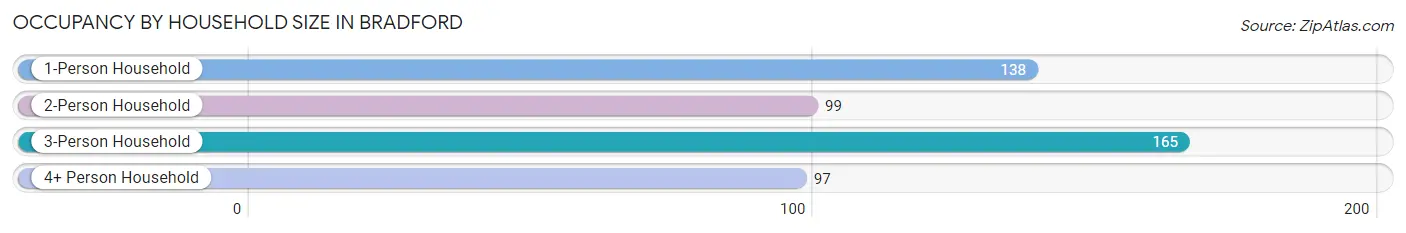
| Household Size | # Housing Units | % Housing Units |
| 1-Person Household | 138 | 27.7% |
| 2-Person Household | 99 | 19.8% |
| 3-Person Household | 165 | 33.1% |
| 4+ Person Household | 97 | 19.4% |
| Total Housing Units | 499 | 100.0% |
Occupancy by Ownership by Household Size in Bradford
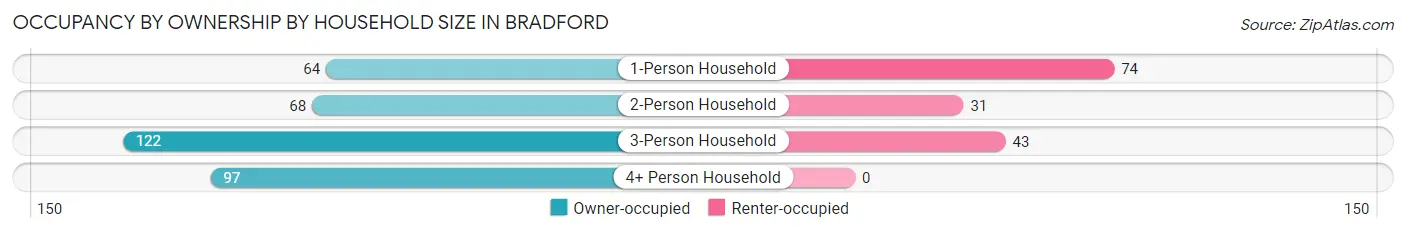
| Household Size | Owner-occupied | Renter-occupied |
| 1-Person Household | 64 (46.4%) | 74 (53.6%) |
| 2-Person Household | 68 (68.7%) | 31 (31.3%) |
| 3-Person Household | 122 (73.9%) | 43 (26.1%) |
| 4+ Person Household | 97 (100.0%) | 0 (0.0%) |
| Total Housing Units | 351 (70.3%) | 148 (29.7%) |
Occupancy by Educational Attainment in Bradford
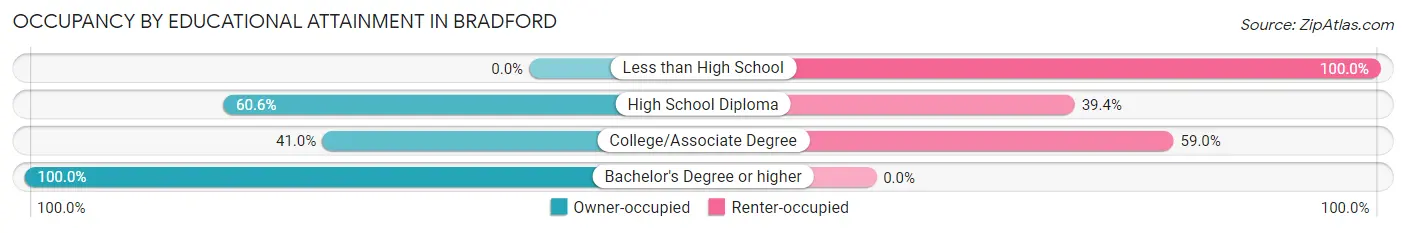
| Household Size | Owner-occupied | Renter-occupied |
| Less than High School | 0 (0.0%) | 6 (100.0%) |
| High School Diploma | 77 (60.6%) | 50 (39.4%) |
| College/Associate Degree | 64 (41.0%) | 92 (59.0%) |
| Bachelor's Degree or higher | 210 (100.0%) | 0 (0.0%) |
Occupancy by Age of Householder in Bradford
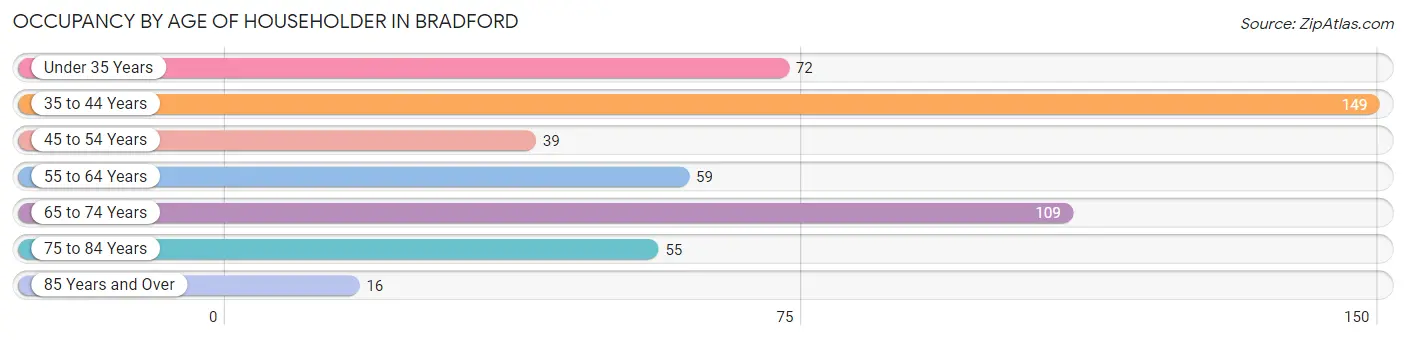
| Age Bracket | # Households | % Households |
| Under 35 Years | 72 | 14.4% |
| 35 to 44 Years | 149 | 29.9% |
| 45 to 54 Years | 39 | 7.8% |
| 55 to 64 Years | 59 | 11.8% |
| 65 to 74 Years | 109 | 21.8% |
| 75 to 84 Years | 55 | 11.0% |
| 85 Years and Over | 16 | 3.2% |
| Total | 499 | 100.0% |
Housing Finances in Bradford
Median Income by Occupancy in Bradford
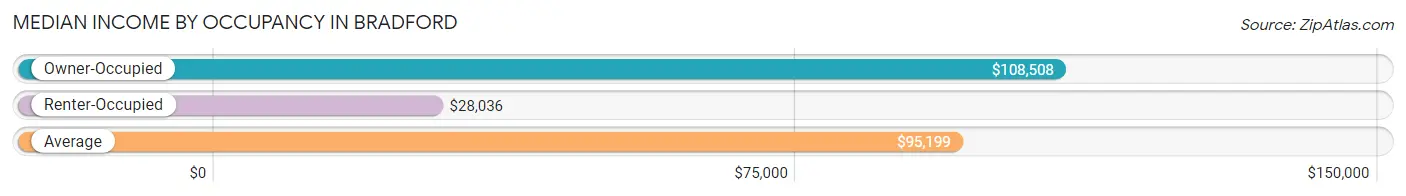
| Occupancy Type | # Households | Median Income |
| Owner-Occupied | 351 (70.3%) | $108,508 |
| Renter-Occupied | 148 (29.7%) | $28,036 |
| Average | 499 (100.0%) | $95,199 |
Occupancy by Householder Income Bracket in Bradford
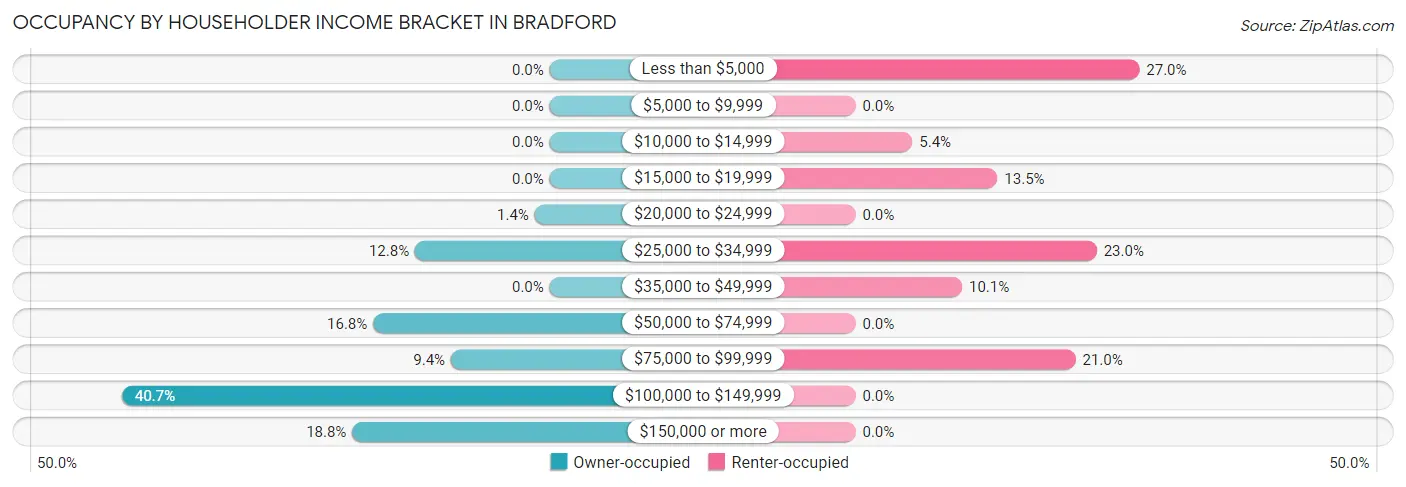
| Income Bracket | Owner-occupied | Renter-occupied |
| Less than $5,000 | 0 (0.0%) | 40 (27.0%) |
| $5,000 to $9,999 | 0 (0.0%) | 0 (0.0%) |
| $10,000 to $14,999 | 0 (0.0%) | 8 (5.4%) |
| $15,000 to $19,999 | 0 (0.0%) | 20 (13.5%) |
| $20,000 to $24,999 | 5 (1.4%) | 0 (0.0%) |
| $25,000 to $34,999 | 45 (12.8%) | 34 (23.0%) |
| $35,000 to $49,999 | 0 (0.0%) | 15 (10.1%) |
| $50,000 to $74,999 | 59 (16.8%) | 0 (0.0%) |
| $75,000 to $99,999 | 33 (9.4%) | 31 (20.9%) |
| $100,000 to $149,999 | 143 (40.7%) | 0 (0.0%) |
| $150,000 or more | 66 (18.8%) | 0 (0.0%) |
| Total | 351 (100.0%) | 148 (100.0%) |
Monthly Housing Cost Tiers in Bradford
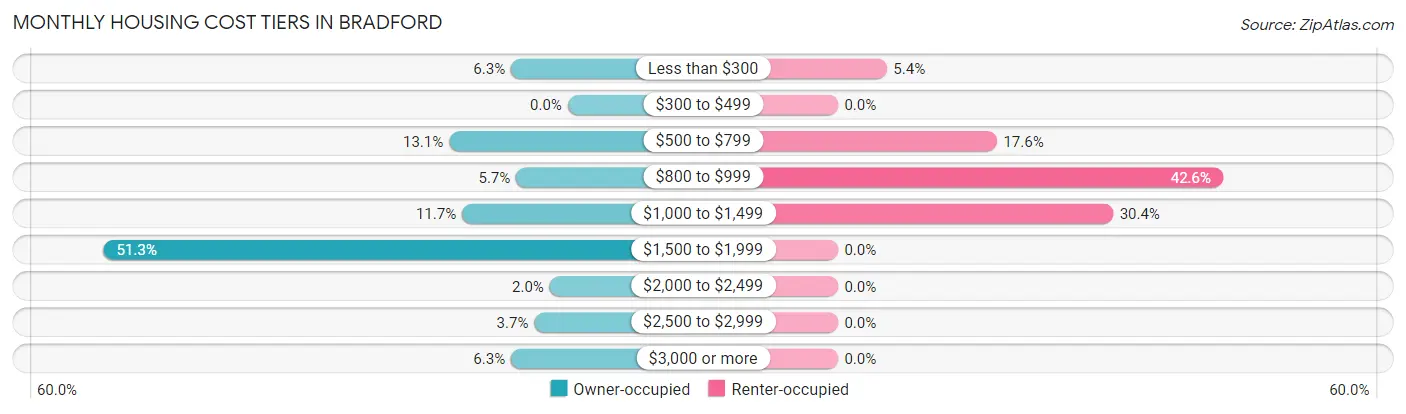
| Monthly Cost | Owner-occupied | Renter-occupied |
| Less than $300 | 22 (6.3%) | 8 (5.4%) |
| $300 to $499 | 0 (0.0%) | 0 (0.0%) |
| $500 to $799 | 46 (13.1%) | 26 (17.6%) |
| $800 to $999 | 20 (5.7%) | 63 (42.6%) |
| $1,000 to $1,499 | 41 (11.7%) | 45 (30.4%) |
| $1,500 to $1,999 | 180 (51.3%) | 0 (0.0%) |
| $2,000 to $2,499 | 7 (2.0%) | 0 (0.0%) |
| $2,500 to $2,999 | 13 (3.7%) | 0 (0.0%) |
| $3,000 or more | 22 (6.3%) | 0 (0.0%) |
| Total | 351 (100.0%) | 148 (100.0%) |
Physical Housing Characteristics in Bradford
Housing Structures in Bradford
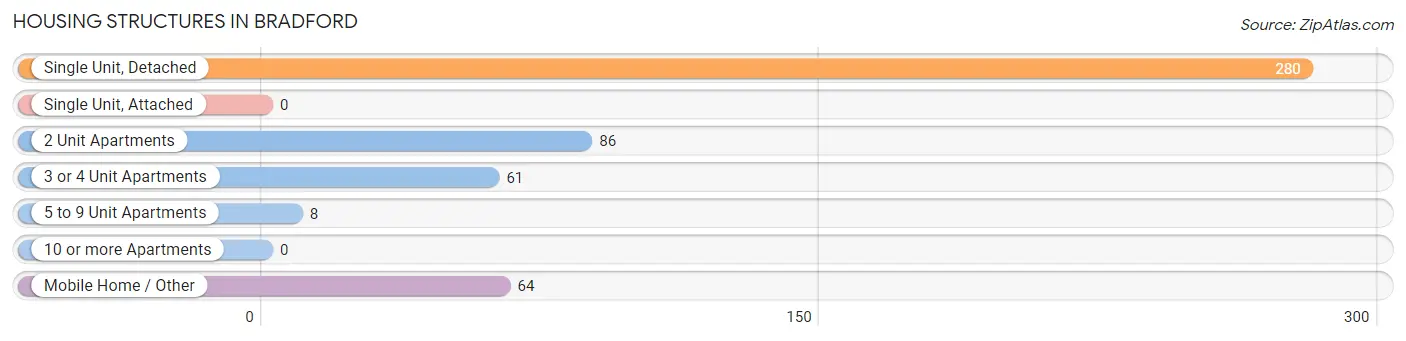
| Structure Type | # Housing Units | % Housing Units |
| Single Unit, Detached | 280 | 56.1% |
| Single Unit, Attached | 0 | 0.0% |
| 2 Unit Apartments | 86 | 17.2% |
| 3 or 4 Unit Apartments | 61 | 12.2% |
| 5 to 9 Unit Apartments | 8 | 1.6% |
| 10 or more Apartments | 0 | 0.0% |
| Mobile Home / Other | 64 | 12.8% |
| Total | 499 | 100.0% |
Housing Structures by Occupancy in Bradford
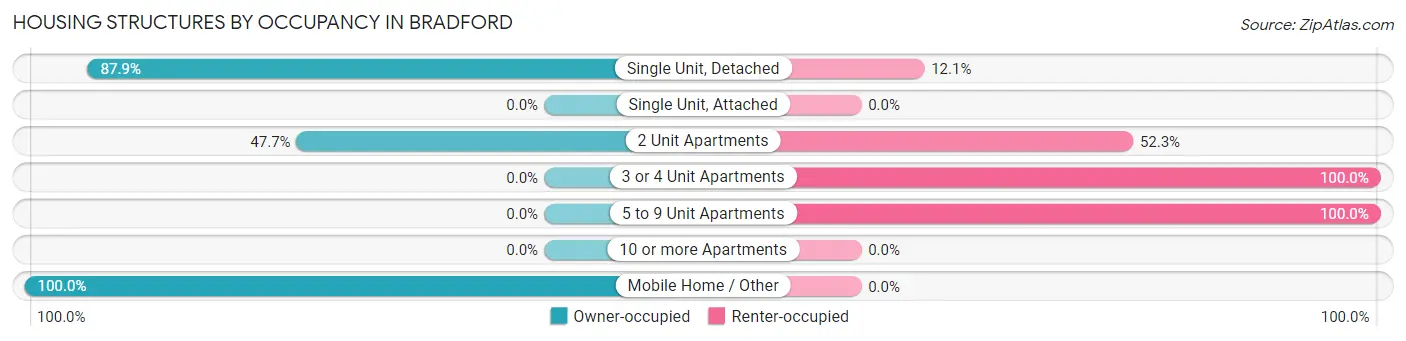
| Structure Type | Owner-occupied | Renter-occupied |
| Single Unit, Detached | 246 (87.9%) | 34 (12.1%) |
| Single Unit, Attached | 0 (0.0%) | 0 (0.0%) |
| 2 Unit Apartments | 41 (47.7%) | 45 (52.3%) |
| 3 or 4 Unit Apartments | 0 (0.0%) | 61 (100.0%) |
| 5 to 9 Unit Apartments | 0 (0.0%) | 8 (100.0%) |
| 10 or more Apartments | 0 (0.0%) | 0 (0.0%) |
| Mobile Home / Other | 64 (100.0%) | 0 (0.0%) |
| Total | 351 (70.3%) | 148 (29.7%) |
Housing Structures by Number of Rooms in Bradford
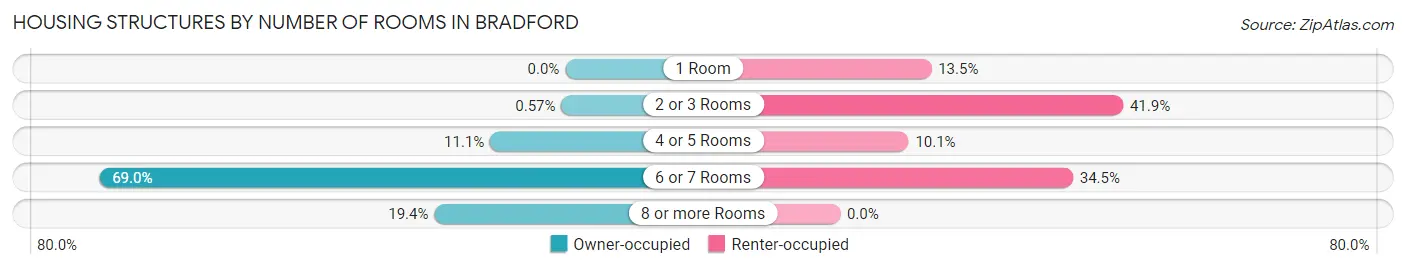
| Number of Rooms | Owner-occupied | Renter-occupied |
| 1 Room | 0 (0.0%) | 20 (13.5%) |
| 2 or 3 Rooms | 2 (0.6%) | 62 (41.9%) |
| 4 or 5 Rooms | 39 (11.1%) | 15 (10.1%) |
| 6 or 7 Rooms | 242 (69.0%) | 51 (34.5%) |
| 8 or more Rooms | 68 (19.4%) | 0 (0.0%) |
| Total | 351 (100.0%) | 148 (100.0%) |
Housing Structure by Heating Type in Bradford
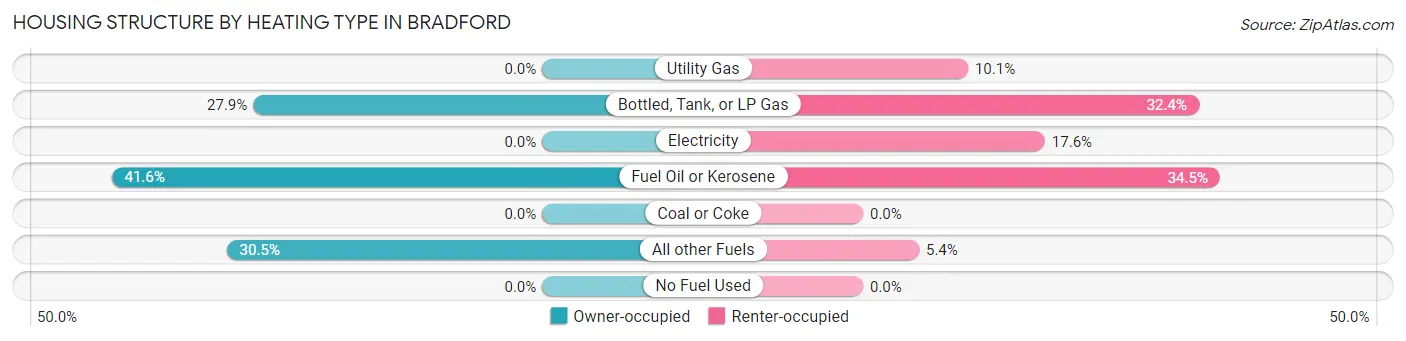
| Heating Type | Owner-occupied | Renter-occupied |
| Utility Gas | 0 (0.0%) | 15 (10.1%) |
| Bottled, Tank, or LP Gas | 98 (27.9%) | 48 (32.4%) |
| Electricity | 0 (0.0%) | 26 (17.6%) |
| Fuel Oil or Kerosene | 146 (41.6%) | 51 (34.5%) |
| Coal or Coke | 0 (0.0%) | 0 (0.0%) |
| All other Fuels | 107 (30.5%) | 8 (5.4%) |
| No Fuel Used | 0 (0.0%) | 0 (0.0%) |
| Total | 351 (100.0%) | 148 (100.0%) |
Household Vehicle Usage in Bradford
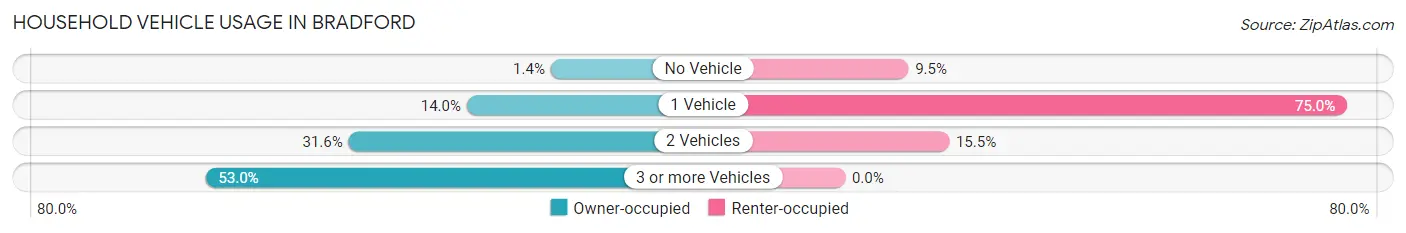
| Vehicles per Household | Owner-occupied | Renter-occupied |
| No Vehicle | 5 (1.4%) | 14 (9.5%) |
| 1 Vehicle | 49 (14.0%) | 111 (75.0%) |
| 2 Vehicles | 111 (31.6%) | 23 (15.5%) |
| 3 or more Vehicles | 186 (53.0%) | 0 (0.0%) |
| Total | 351 (100.0%) | 148 (100.0%) |
Real Estate & Mortgages in Bradford
Real Estate and Mortgage Overview in Bradford
| Characteristic | Without Mortgage | With Mortgage |
| Housing Units | 80 | 271 |
| Median Property Value | $205,000 | $163,300 |
| Median Household Income | $33,864 | $66 |
| Monthly Housing Costs | $680 | $22 |
| Real Estate Taxes | $3,667 | $0 |
Property Value by Mortgage Status in Bradford
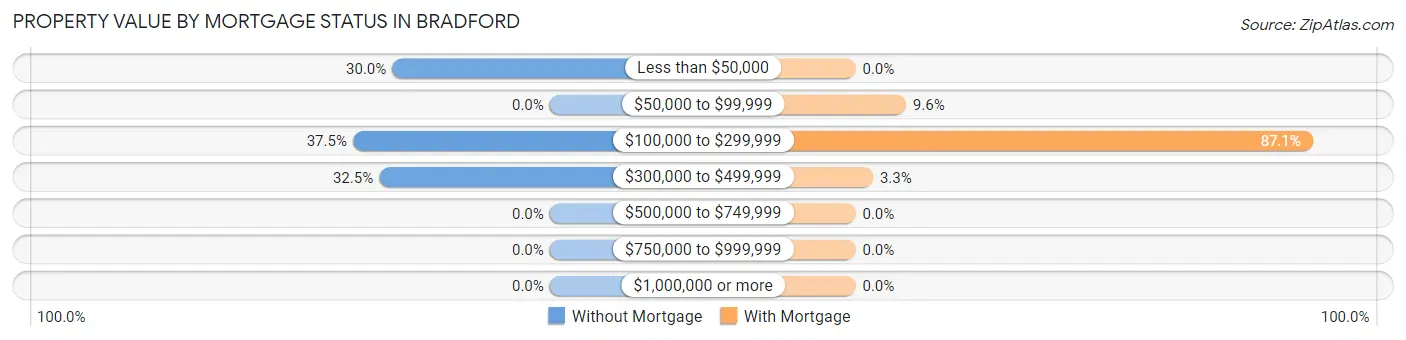
| Property Value | Without Mortgage | With Mortgage |
| Less than $50,000 | 24 (30.0%) | 0 (0.0%) |
| $50,000 to $99,999 | 0 (0.0%) | 26 (9.6%) |
| $100,000 to $299,999 | 30 (37.5%) | 236 (87.1%) |
| $300,000 to $499,999 | 26 (32.5%) | 9 (3.3%) |
| $500,000 to $749,999 | 0 (0.0%) | 0 (0.0%) |
| $750,000 to $999,999 | 0 (0.0%) | 0 (0.0%) |
| $1,000,000 or more | 0 (0.0%) | 0 (0.0%) |
| Total | 80 (100.0%) | 271 (100.0%) |
Household Income by Mortgage Status in Bradford
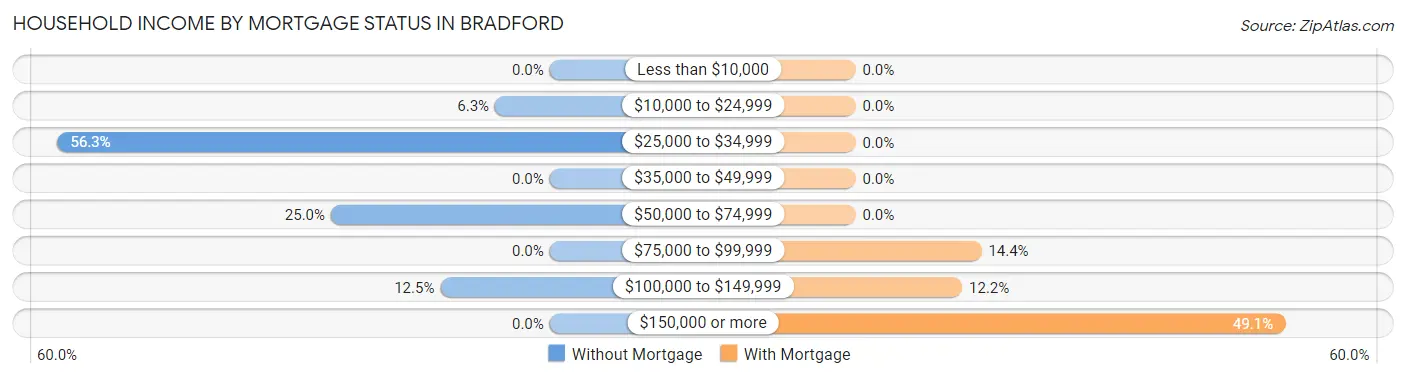
| Household Income | Without Mortgage | With Mortgage |
| Less than $10,000 | 0 (0.0%) | 0 (0.0%) |
| $10,000 to $24,999 | 5 (6.2%) | 0 (0.0%) |
| $25,000 to $34,999 | 45 (56.2%) | 0 (0.0%) |
| $35,000 to $49,999 | 0 (0.0%) | 0 (0.0%) |
| $50,000 to $74,999 | 20 (25.0%) | 0 (0.0%) |
| $75,000 to $99,999 | 0 (0.0%) | 39 (14.4%) |
| $100,000 to $149,999 | 10 (12.5%) | 33 (12.2%) |
| $150,000 or more | 0 (0.0%) | 133 (49.1%) |
| Total | 80 (100.0%) | 271 (100.0%) |
Property Value to Household Income Ratio in Bradford
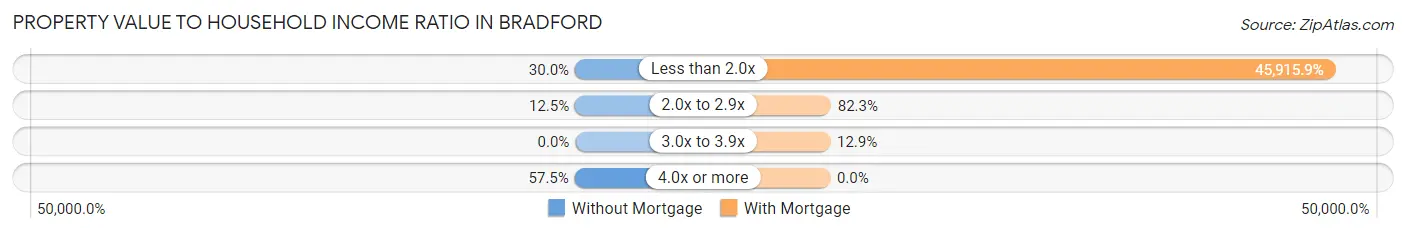
| Value-to-Income Ratio | Without Mortgage | With Mortgage |
| Less than 2.0x | 24 (30.0%) | 124,432 (45,915.9%) |
| 2.0x to 2.9x | 10 (12.5%) | 223 (82.3%) |
| 3.0x to 3.9x | 0 (0.0%) | 35 (12.9%) |
| 4.0x or more | 46 (57.5%) | 0 (0.0%) |
| Total | 80 (100.0%) | 271 (100.0%) |
Real Estate Taxes by Mortgage Status in Bradford
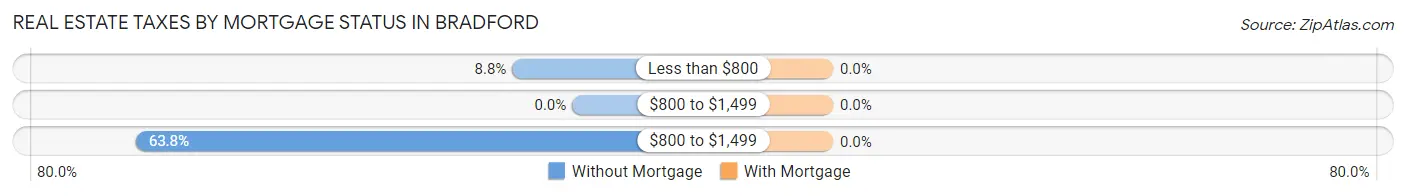
| Property Taxes | Without Mortgage | With Mortgage |
| Less than $800 | 7 (8.7%) | 0 (0.0%) |
| $800 to $1,499 | 0 (0.0%) | 0 (0.0%) |
| $800 to $1,499 | 51 (63.7%) | 0 (0.0%) |
| Total | 80 (100.0%) | 271 (100.0%) |
Health & Disability in Bradford
Health Insurance Coverage by Age in Bradford
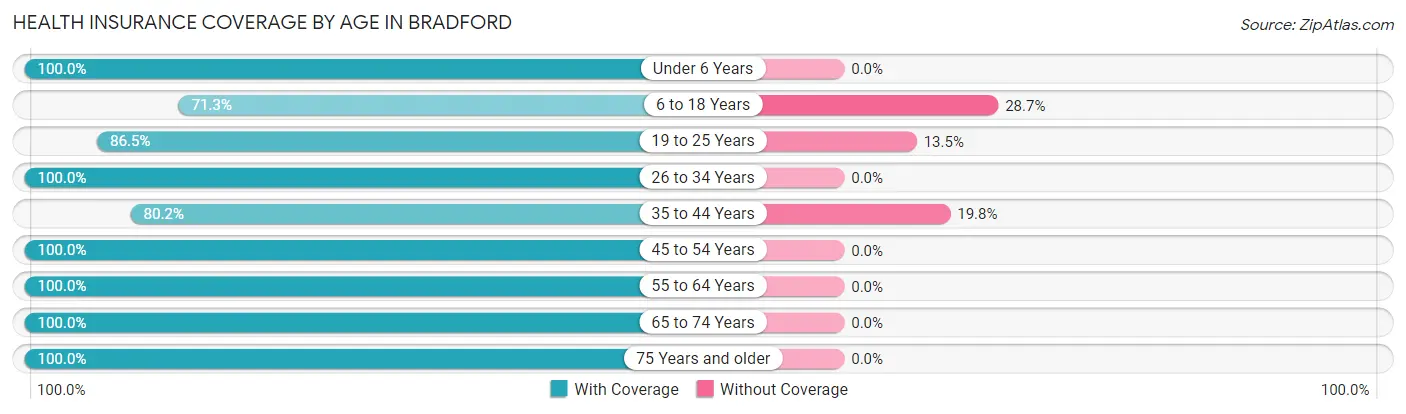
| Age Bracket | With Coverage | Without Coverage |
| Under 6 Years | 73 (100.0%) | 0 (0.0%) |
| 6 to 18 Years | 144 (71.3%) | 58 (28.7%) |
| 19 to 25 Years | 96 (86.5%) | 15 (13.5%) |
| 26 to 34 Years | 95 (100.0%) | 0 (0.0%) |
| 35 to 44 Years | 276 (80.2%) | 68 (19.8%) |
| 45 to 54 Years | 60 (100.0%) | 0 (0.0%) |
| 55 to 64 Years | 112 (100.0%) | 0 (0.0%) |
| 65 to 74 Years | 157 (100.0%) | 0 (0.0%) |
| 75 Years and older | 110 (100.0%) | 0 (0.0%) |
| Total | 1,123 (88.8%) | 141 (11.2%) |
Health Insurance Coverage by Citizenship Status in Bradford
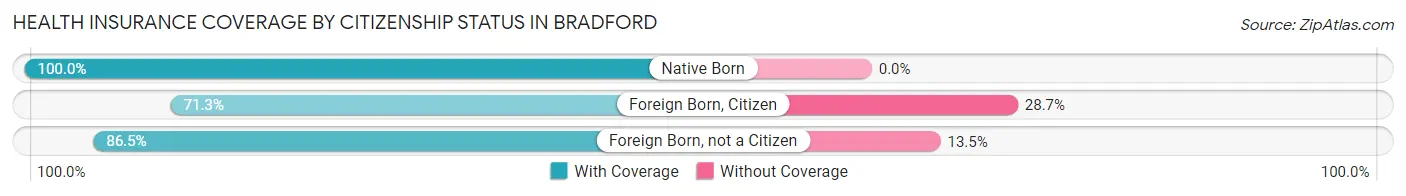
| Citizenship Status | With Coverage | Without Coverage |
| Native Born | 73 (100.0%) | 0 (0.0%) |
| Foreign Born, Citizen | 144 (71.3%) | 58 (28.7%) |
| Foreign Born, not a Citizen | 96 (86.5%) | 15 (13.5%) |
Health Insurance Coverage by Household Income in Bradford
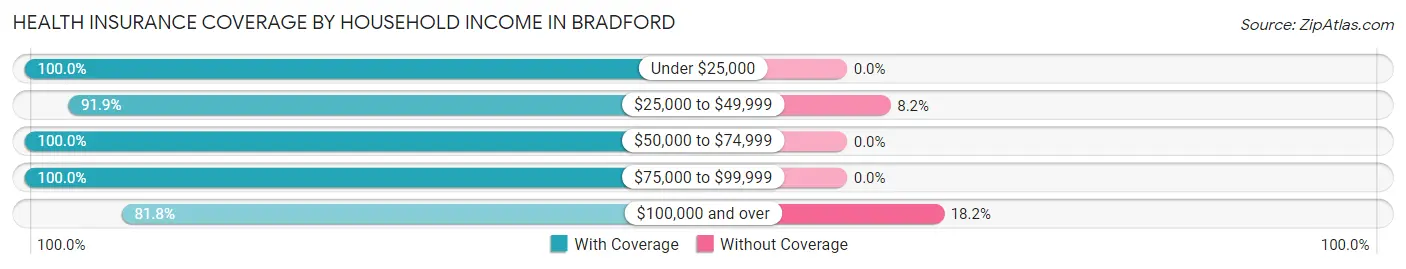
| Household Income | With Coverage | Without Coverage |
| Under $25,000 | 73 (100.0%) | 0 (0.0%) |
| $25,000 to $49,999 | 169 (91.8%) | 15 (8.2%) |
| $50,000 to $74,999 | 86 (100.0%) | 0 (0.0%) |
| $75,000 to $99,999 | 136 (100.0%) | 0 (0.0%) |
| $100,000 and over | 568 (81.8%) | 126 (18.2%) |
Public vs Private Health Insurance Coverage by Age in Bradford
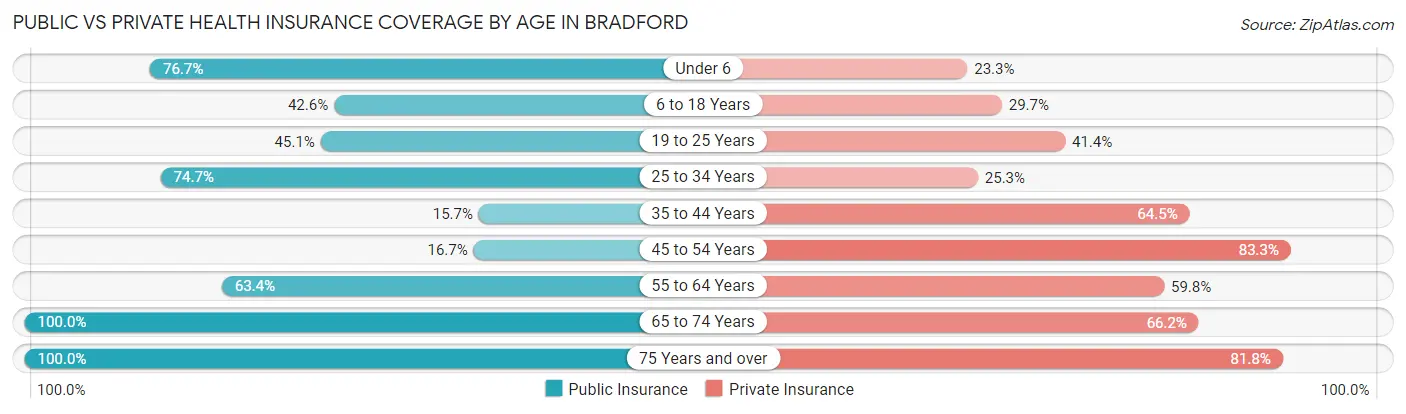
| Age Bracket | Public Insurance | Private Insurance |
| Under 6 | 56 (76.7%) | 17 (23.3%) |
| 6 to 18 Years | 86 (42.6%) | 60 (29.7%) |
| 19 to 25 Years | 50 (45.1%) | 46 (41.4%) |
| 25 to 34 Years | 71 (74.7%) | 24 (25.3%) |
| 35 to 44 Years | 54 (15.7%) | 222 (64.5%) |
| 45 to 54 Years | 10 (16.7%) | 50 (83.3%) |
| 55 to 64 Years | 71 (63.4%) | 67 (59.8%) |
| 65 to 74 Years | 157 (100.0%) | 104 (66.2%) |
| 75 Years and over | 110 (100.0%) | 90 (81.8%) |
| Total | 665 (52.6%) | 680 (53.8%) |
Disability Status by Sex by Age in Bradford
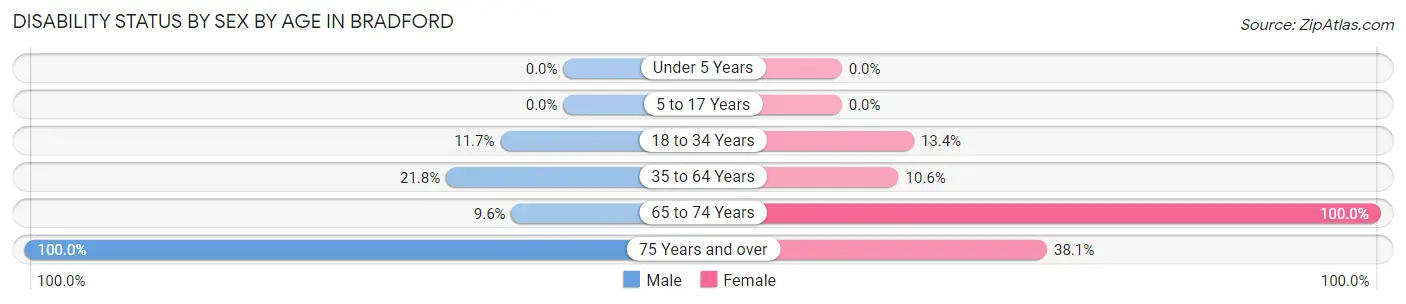
| Age Bracket | Male | Female |
| Under 5 Years | 0 (0.0%) | 0 (0.0%) |
| 5 to 17 Years | 0 (0.0%) | 0 (0.0%) |
| 18 to 34 Years | 11 (11.7%) | 15 (13.4%) |
| 35 to 64 Years | 69 (21.8%) | 21 (10.5%) |
| 65 to 74 Years | 8 (9.6%) | 74 (100.0%) |
| 75 Years and over | 47 (100.0%) | 24 (38.1%) |
Disability Class by Sex by Age in Bradford
Disability Class: Hearing Difficulty
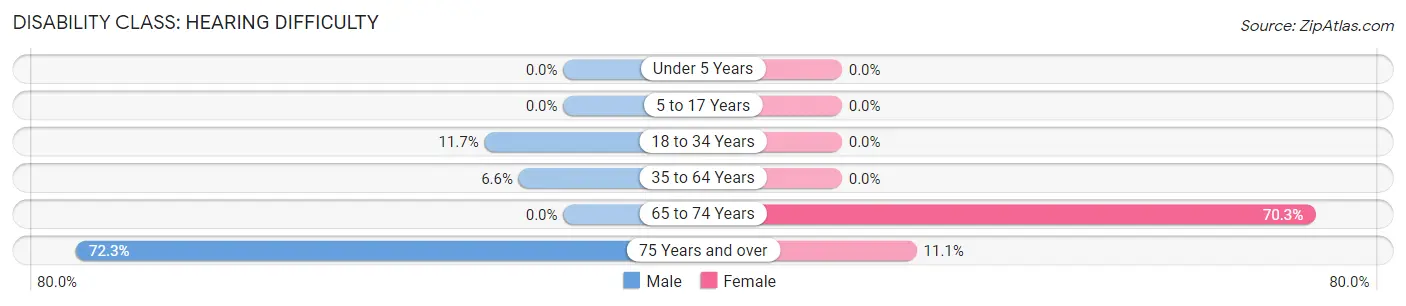
| Age Bracket | Male | Female |
| Under 5 Years | 0 (0.0%) | 0 (0.0%) |
| 5 to 17 Years | 0 (0.0%) | 0 (0.0%) |
| 18 to 34 Years | 11 (11.7%) | 0 (0.0%) |
| 35 to 64 Years | 21 (6.6%) | 0 (0.0%) |
| 65 to 74 Years | 0 (0.0%) | 52 (70.3%) |
| 75 Years and over | 34 (72.3%) | 7 (11.1%) |
Disability Class: Vision Difficulty
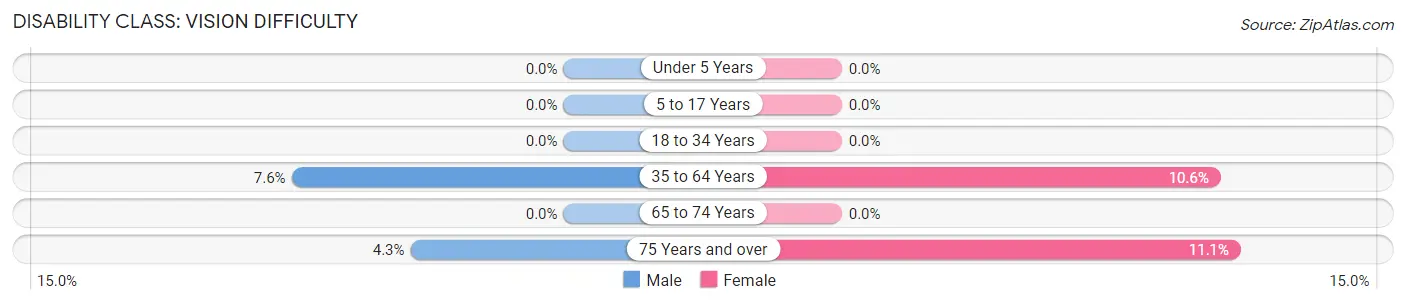
| Age Bracket | Male | Female |
| Under 5 Years | 0 (0.0%) | 0 (0.0%) |
| 5 to 17 Years | 0 (0.0%) | 0 (0.0%) |
| 18 to 34 Years | 0 (0.0%) | 0 (0.0%) |
| 35 to 64 Years | 24 (7.6%) | 21 (10.5%) |
| 65 to 74 Years | 0 (0.0%) | 0 (0.0%) |
| 75 Years and over | 2 (4.3%) | 7 (11.1%) |
Disability Class: Cognitive Difficulty
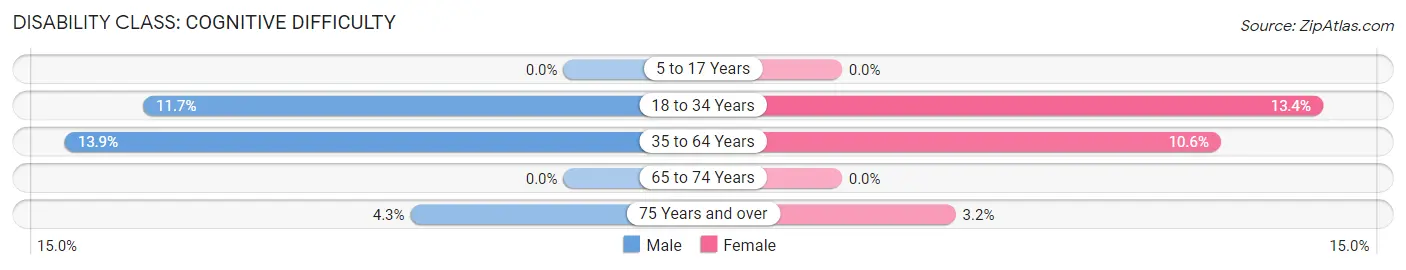
| Age Bracket | Male | Female |
| 5 to 17 Years | 0 (0.0%) | 0 (0.0%) |
| 18 to 34 Years | 11 (11.7%) | 15 (13.4%) |
| 35 to 64 Years | 44 (13.9%) | 21 (10.5%) |
| 65 to 74 Years | 0 (0.0%) | 0 (0.0%) |
| 75 Years and over | 2 (4.3%) | 2 (3.2%) |
Disability Class: Ambulatory Difficulty
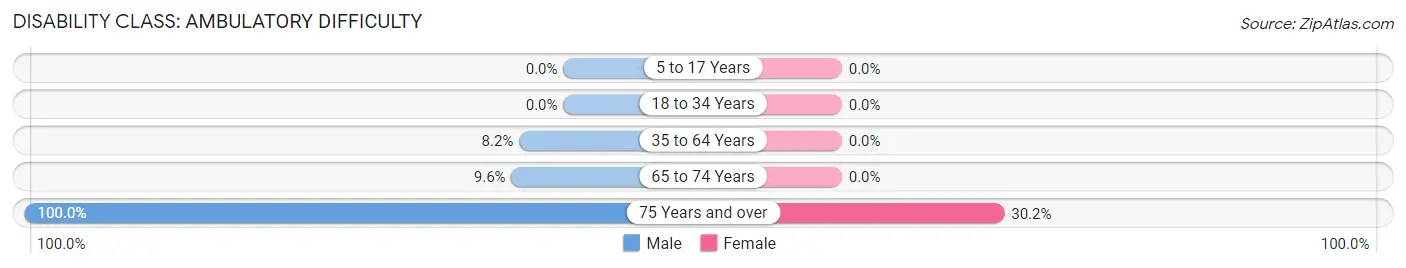
| Age Bracket | Male | Female |
| 5 to 17 Years | 0 (0.0%) | 0 (0.0%) |
| 18 to 34 Years | 0 (0.0%) | 0 (0.0%) |
| 35 to 64 Years | 26 (8.2%) | 0 (0.0%) |
| 65 to 74 Years | 8 (9.6%) | 0 (0.0%) |
| 75 Years and over | 47 (100.0%) | 19 (30.2%) |
Disability Class: Self-Care Difficulty
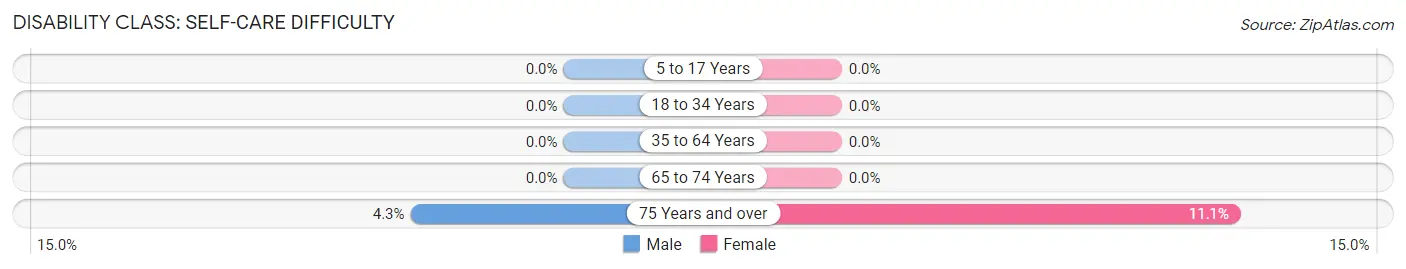
| Age Bracket | Male | Female |
| 5 to 17 Years | 0 (0.0%) | 0 (0.0%) |
| 18 to 34 Years | 0 (0.0%) | 0 (0.0%) |
| 35 to 64 Years | 0 (0.0%) | 0 (0.0%) |
| 65 to 74 Years | 0 (0.0%) | 0 (0.0%) |
| 75 Years and over | 2 (4.3%) | 7 (11.1%) |
Technology Access in Bradford
Computing Device Access in Bradford
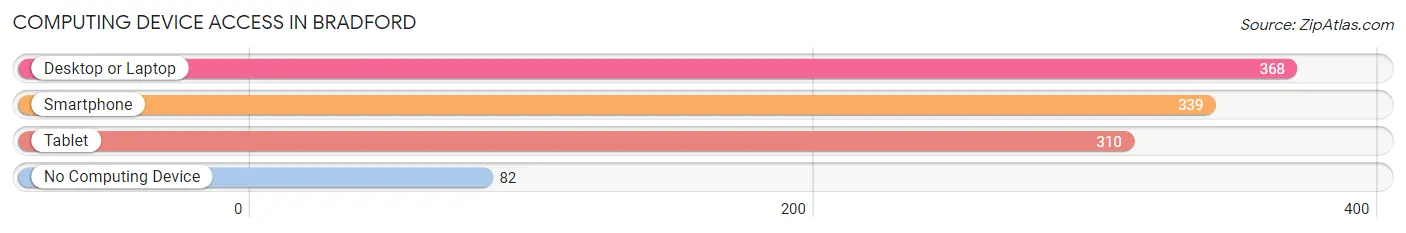
| Device Type | # Households | % Households |
| Desktop or Laptop | 368 | 73.8% |
| Smartphone | 339 | 67.9% |
| Tablet | 310 | 62.1% |
| No Computing Device | 82 | 16.4% |
| Total | 499 | 100.0% |
Internet Access in Bradford
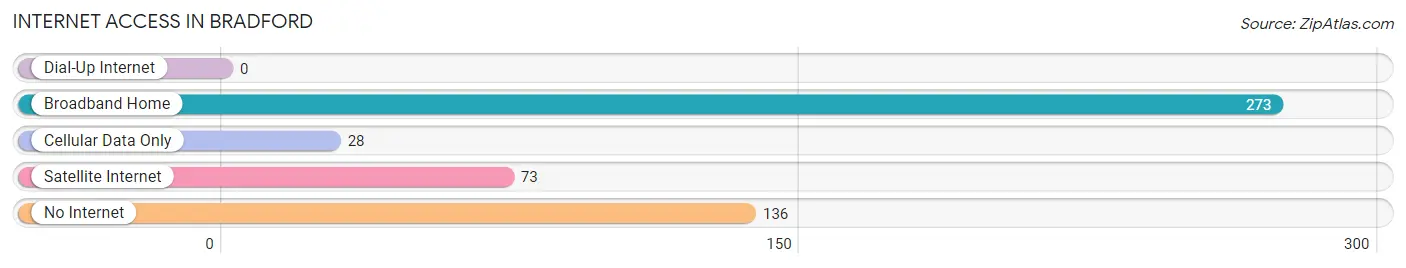
| Internet Type | # Households | % Households |
| Dial-Up Internet | 0 | 0.0% |
| Broadband Home | 273 | 54.7% |
| Cellular Data Only | 28 | 5.6% |
| Satellite Internet | 73 | 14.6% |
| No Internet | 136 | 27.3% |
| Total | 499 | 100.0% |
Bradford Summary
Bradford, Vermont is a small town located in Orange County, in the northeastern part of the state. It is situated on the Connecticut River, and is bordered by the towns of Fairlee, Newbury, and Topsham. The town has a population of 1,845 people, according to the 2010 census.
Bradford was first settled in 1780, and was incorporated in 1781. The town was named after William Bradford, a prominent lawyer and politician from Massachusetts. The town was originally a farming community, and the main crops were wheat, corn, and potatoes. In the late 19th century, the town began to develop a manufacturing industry, and by the early 20th century, it was home to several factories, including a paper mill, a woolen mill, and a shoe factory.
Geographically, Bradford is located in the Connecticut River Valley, and is surrounded by hills and mountains. The town is located at the intersection of two major highways, Interstate 91 and U.S. Route 5. The town is also served by the Vermont Rail System, which provides freight and passenger service to the area.
The economy of Bradford is largely based on agriculture and manufacturing. The town is home to several farms, which produce dairy products, vegetables, and fruits. The town also has several factories, which produce paper products, textiles, and other goods. In addition, the town is home to several small businesses, including restaurants, retail stores, and service providers.
The demographics of Bradford are largely white, with a small percentage of African Americans, Hispanics, and Asians. The median household income is $45,000, and the median home value is $150,000. The town has a high rate of homeownership, with nearly 80% of the population owning their own homes.
Bradford is a small town with a rich history and a vibrant economy. It is home to a diverse population, and is a great place to live and work. The town is well-connected to the rest of the state, and is a great place to visit and explore.
Common Questions
What is Per Capita Income in Bradford?
Per Capita income in Bradford is $34,580.
What is the Median Family Income in Bradford?
Median Family Income in Bradford is $108,710.
What is the Median Household income in Bradford?
Median Household Income in Bradford is $95,199.
What is Inequality or Gini Index in Bradford?
Inequality or Gini Index in Bradford is 0.37.
What is the Total Population of Bradford?
Total Population of Bradford is 1,272.
What is the Total Male Population of Bradford?
Total Male Population of Bradford is 721.
What is the Total Female Population of Bradford?
Total Female Population of Bradford is 551.
What is the Ratio of Males per 100 Females in Bradford?
There are 130.85 Males per 100 Females in Bradford.
What is the Ratio of Females per 100 Males in Bradford?
There are 76.42 Females per 100 Males in Bradford.
What is the Median Population Age in Bradford?
Median Population Age in Bradford is 42.2 Years.
What is the Average Family Size in Bradford
Average Family Size in Bradford is 2.8 People.
What is the Average Household Size in Bradford
Average Household Size in Bradford is 2.4 People.
How Large is the Labor Force in Bradford?
There are 746 People in the Labor Forcein in Bradford.
What is the Percentage of People in the Labor Force in Bradford?
66.0% of People are in the Labor Force in Bradford.
What is the Unemployment Rate in Bradford?
Unemployment Rate in Bradford is 4.2%.