Castleton, VT Map & Demographics
Castleton Map
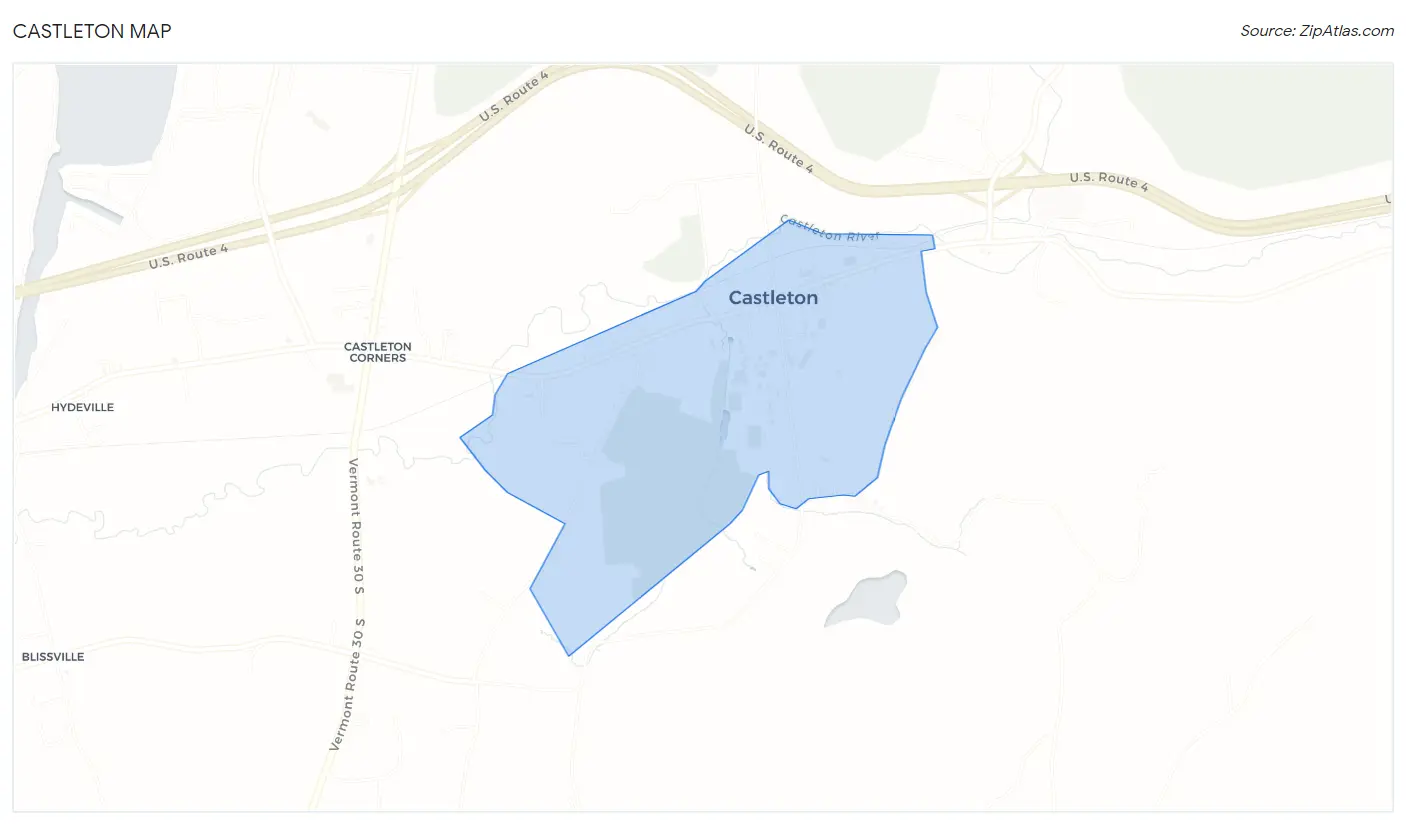
Castleton Overview
$7,916
PER CAPITA INCOME
$81,750
AVG FAMILY INCOME
28.6%
WAGE / INCOME GAP [ % ]
71.4¢/ $1
WAGE / INCOME GAP [ $ ]
0.35
INEQUALITY / GINI INDEX
905
TOTAL POPULATION
586
MALE POPULATION
319
FEMALE POPULATION
183.70
MALES / 100 FEMALES
54.44
FEMALES / 100 MALES
20.1
MEDIAN AGE
4.1
AVG FAMILY SIZE
1.6
AVG HOUSEHOLD SIZE
363
LABOR FORCE [ PEOPLE ]
40.6%
PERCENT IN LABOR FORCE
6.9%
UNEMPLOYMENT RATE
Castleton Zip Codes
Castleton Area Codes
Income in Castleton
Income Overview in Castleton
| Characteristic | Number | Measure |
| Per Capita Income | 905 | $7,916 |
| Median Family Income | 16 | $81,750 |
| Mean Family Income | 16 | $96,181 |
| Median Household Income | 81 | $0 |
| Mean Household Income | 81 | $42,030 |
| Income Deficit | 16 | $0 |
| Wage / Income Gap (%) | 905 | 28.56% |
| Wage / Income Gap ($) | 905 | 71.44¢ per $1 |
| Gini / Inequality Index | 905 | 0.35 |
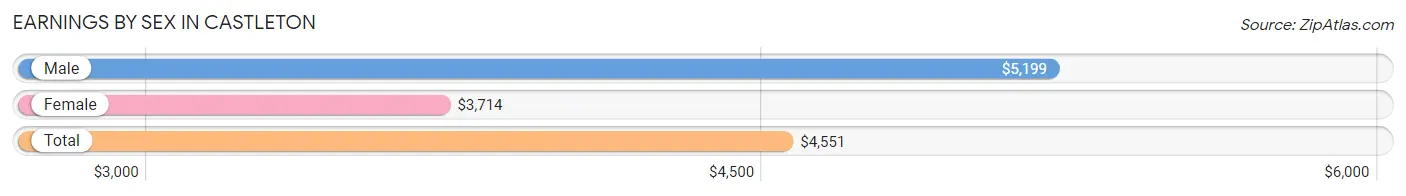
Earnings by Sex in Castleton
Average Earnings in Castleton are $4,551, $5,199 for men and $3,714 for women, a difference of 28.6%.
| Sex | Number | Average Earnings |
| Male | 393 (60.7%) | $5,199 |
| Female | 255 (39.4%) | $3,714 |
| Total | 648 (100.0%) | $4,551 |
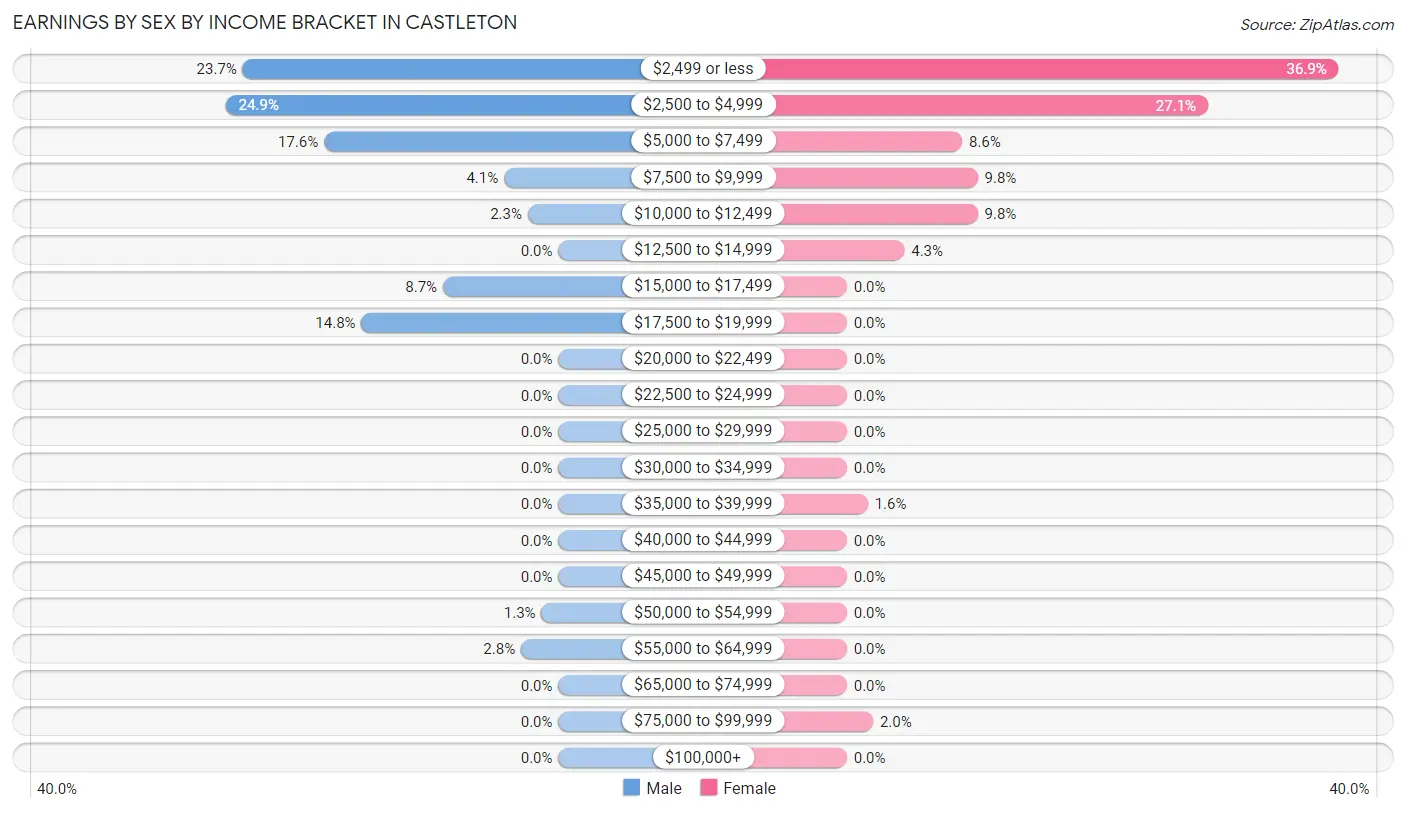
Earnings by Sex by Income Bracket in Castleton
The most common earnings brackets in Castleton are $2,500 to $4,999 for men (98 | 24.9%) and $2,499 or less for women (94 | 36.9%).
| Income | Male | Female |
| $2,499 or less | 93 (23.7%) | 94 (36.9%) |
| $2,500 to $4,999 | 98 (24.9%) | 69 (27.1%) |
| $5,000 to $7,499 | 69 (17.6%) | 22 (8.6%) |
| $7,500 to $9,999 | 16 (4.1%) | 25 (9.8%) |
| $10,000 to $12,499 | 9 (2.3%) | 25 (9.8%) |
| $12,500 to $14,999 | 0 (0.0%) | 11 (4.3%) |
| $15,000 to $17,499 | 34 (8.6%) | 0 (0.0%) |
| $17,500 to $19,999 | 58 (14.8%) | 0 (0.0%) |
| $20,000 to $22,499 | 0 (0.0%) | 0 (0.0%) |
| $22,500 to $24,999 | 0 (0.0%) | 0 (0.0%) |
| $25,000 to $29,999 | 0 (0.0%) | 0 (0.0%) |
| $30,000 to $34,999 | 0 (0.0%) | 0 (0.0%) |
| $35,000 to $39,999 | 0 (0.0%) | 4 (1.6%) |
| $40,000 to $44,999 | 0 (0.0%) | 0 (0.0%) |
| $45,000 to $49,999 | 0 (0.0%) | 0 (0.0%) |
| $50,000 to $54,999 | 5 (1.3%) | 0 (0.0%) |
| $55,000 to $64,999 | 11 (2.8%) | 0 (0.0%) |
| $65,000 to $74,999 | 0 (0.0%) | 0 (0.0%) |
| $75,000 to $99,999 | 0 (0.0%) | 5 (2.0%) |
| $100,000+ | 0 (0.0%) | 0 (0.0%) |
| Total | 393 (100.0%) | 255 (100.0%) |
Earnings by Sex by Educational Attainment in Castleton
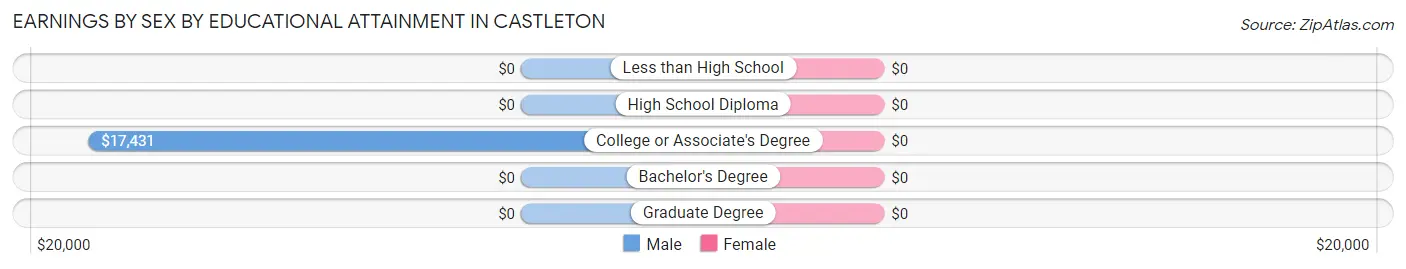
| Educational Attainment | Male Income | Female Income |
| Less than High School | - | - |
| High School Diploma | - | - |
| College or Associate's Degree | $17,431 | $0 |
| Bachelor's Degree | - | - |
| Graduate Degree | - | - |
| Total | $17,463 | $0 |
Family Income in Castleton
Family Income Brackets in Castleton
According to the Castleton family income data, there are 10 families falling into the $75,000 to $99,999 income range, which is the most common income bracket and makes up 62.5% of all families.
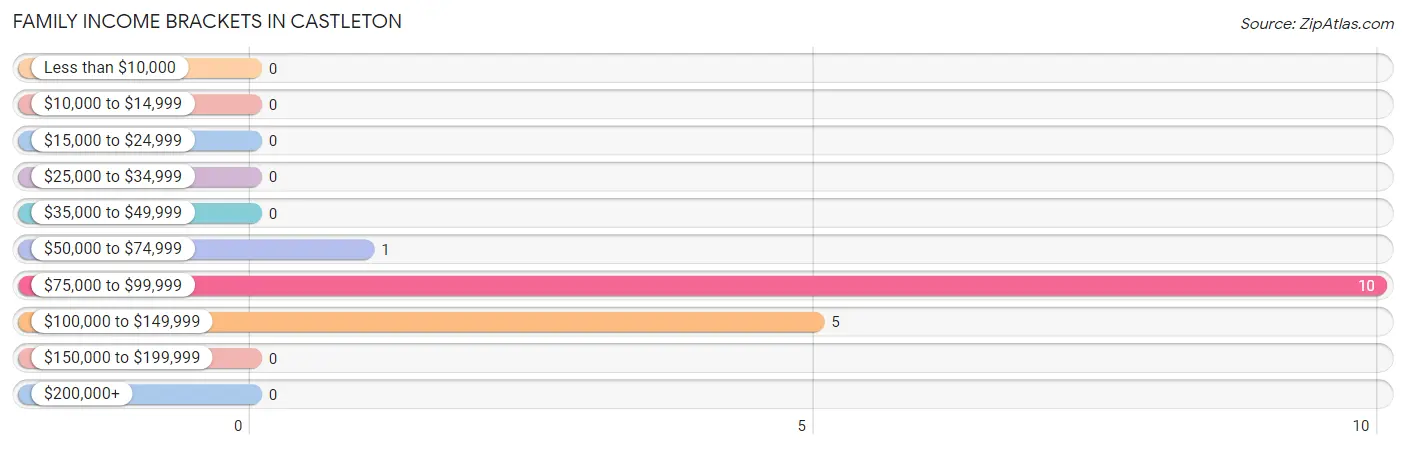
| Income Bracket | # Families | % Families |
| Less than $10,000 | 0 | 0.0% |
| $10,000 to $14,999 | 0 | 0.0% |
| $15,000 to $24,999 | 0 | 0.0% |
| $25,000 to $34,999 | 0 | 0.0% |
| $35,000 to $49,999 | 0 | 0.0% |
| $50,000 to $74,999 | 1 | 6.3% |
| $75,000 to $99,999 | 10 | 62.5% |
| $100,000 to $149,999 | 5 | 31.3% |
| $150,000 to $199,999 | 0 | 0.0% |
| $200,000+ | 0 | 0.0% |
Family Income by Famaliy Size in Castleton
| Income Bracket | # Families | Median Income |
| 2-Person Families | 10 (62.5%) | $0 |
| 3-Person Families | 1 (6.2%) | $0 |
| 4-Person Families | 5 (31.2%) | $0 |
| 5-Person Families | 0 (0.0%) | $0 |
| 6-Person Families | 0 (0.0%) | $0 |
| 7+ Person Families | 0 (0.0%) | $0 |
| Total | 16 (100.0%) | $81,750 |
Family Income by Number of Earners in Castleton
| Number of Earners | # Families | Median Income |
| No Earners | 0 (0.0%) | $0 |
| 1 Earner | 11 (68.8%) | $0 |
| 2 Earners | 5 (31.2%) | $0 |
| 3+ Earners | 0 (0.0%) | $0 |
| Total | 16 (100.0%) | $81,750 |
Household Income in Castleton
Household Income Brackets in Castleton
With 37 households falling in the category, the $15,000 to $24,999 income range is the most frequent in Castleton, accounting for 45.7% of all households.
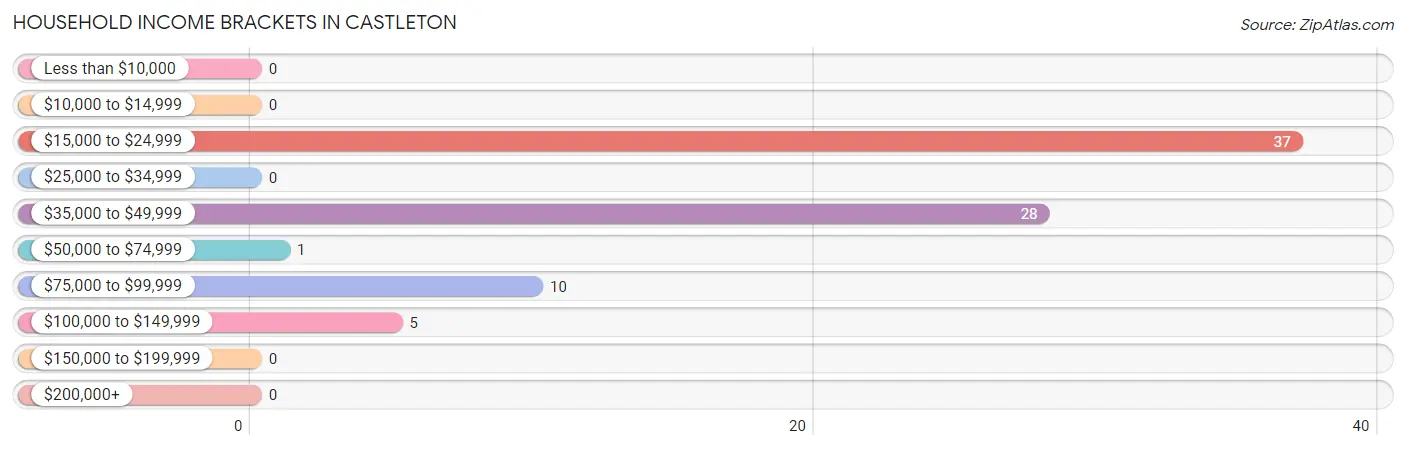
| Income Bracket | # Households | % Households |
| Less than $10,000 | 0 | 0.0% |
| $10,000 to $14,999 | 0 | 0.0% |
| $15,000 to $24,999 | 37 | 45.7% |
| $25,000 to $34,999 | 0 | 0.0% |
| $35,000 to $49,999 | 28 | 34.6% |
| $50,000 to $74,999 | 1 | 1.2% |
| $75,000 to $99,999 | 10 | 12.3% |
| $100,000 to $149,999 | 5 | 6.2% |
| $150,000 to $199,999 | 0 | 0.0% |
| $200,000+ | 0 | 0.0% |
Household Income by Householder Age in Castleton
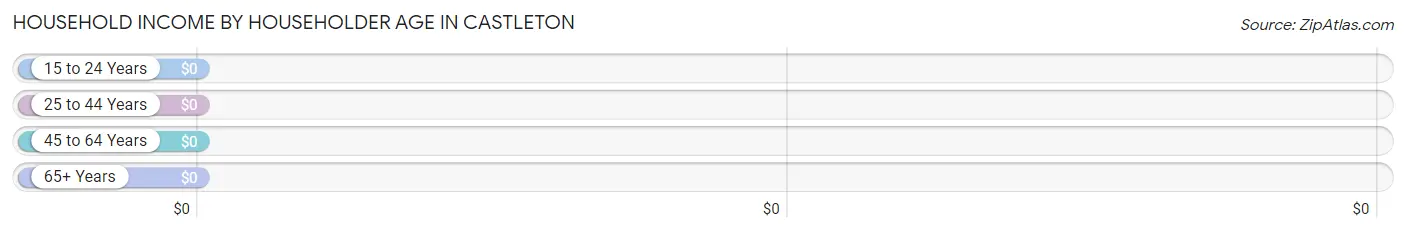
| Income Bracket | # Households | Median Income |
| 15 to 24 Years | 0 (0.0%) | $0 |
| 25 to 44 Years | 37 (45.7%) | $0 |
| 45 to 64 Years | 15 (18.5%) | $0 |
| 65+ Years | 29 (35.8%) | $0 |
| Total | 81 (100.0%) | $0 |
Poverty in Castleton
Income Below Poverty by Sex and Age in Castleton
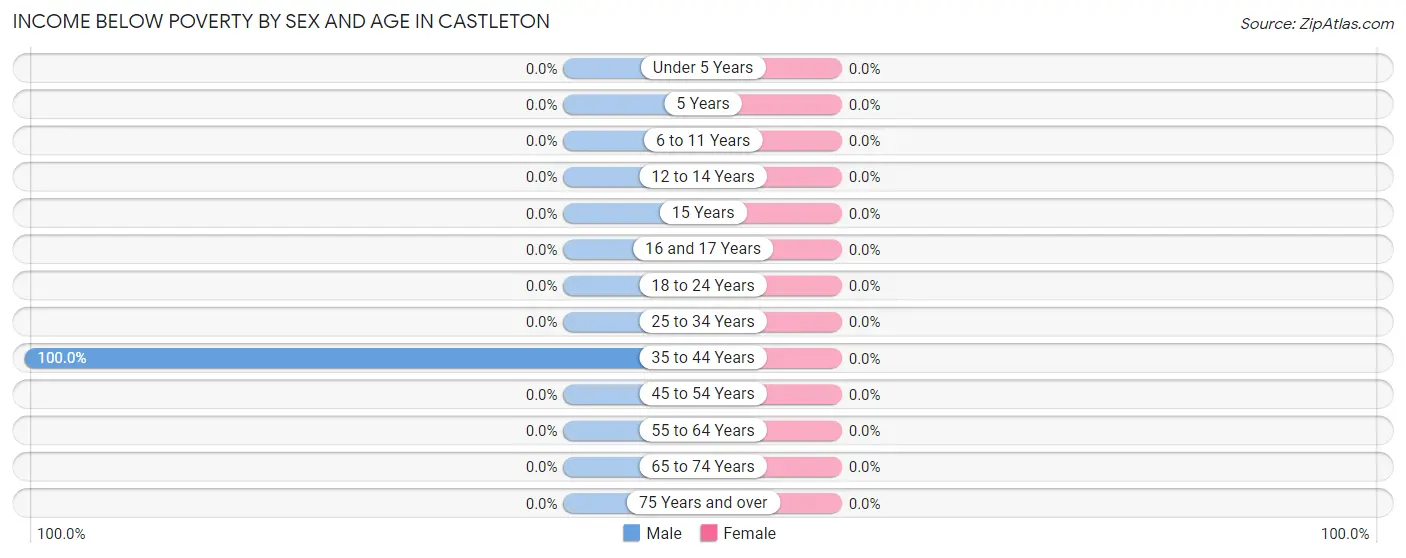
| Age Bracket | Male | Female |
| Under 5 Years | 0 (0.0%) | 0 (0.0%) |
| 5 Years | 0 (0.0%) | 0 (0.0%) |
| 6 to 11 Years | 0 (0.0%) | 0 (0.0%) |
| 12 to 14 Years | 0 (0.0%) | 0 (0.0%) |
| 15 Years | 0 (0.0%) | 0 (0.0%) |
| 16 and 17 Years | 0 (0.0%) | 0 (0.0%) |
| 18 to 24 Years | 0 (0.0%) | 0 (0.0%) |
| 25 to 34 Years | 0 (0.0%) | 0 (0.0%) |
| 35 to 44 Years | 18 (100.0%) | 0 (0.0%) |
| 45 to 54 Years | 0 (0.0%) | 0 (0.0%) |
| 55 to 64 Years | 0 (0.0%) | 0 (0.0%) |
| 65 to 74 Years | 0 (0.0%) | 0 (0.0%) |
| 75 Years and over | 0 (0.0%) | 0 (0.0%) |
| Total | 18 (13.0%) | 0 (0.0%) |
Income Above Poverty by Sex and Age in Castleton
According to the poverty statistics in Castleton, males aged 6 to 11 years and females aged 45 to 54 years are the age groups that are most secure financially, with 100.0% of males and 100.0% of females in these age groups living above the poverty line.
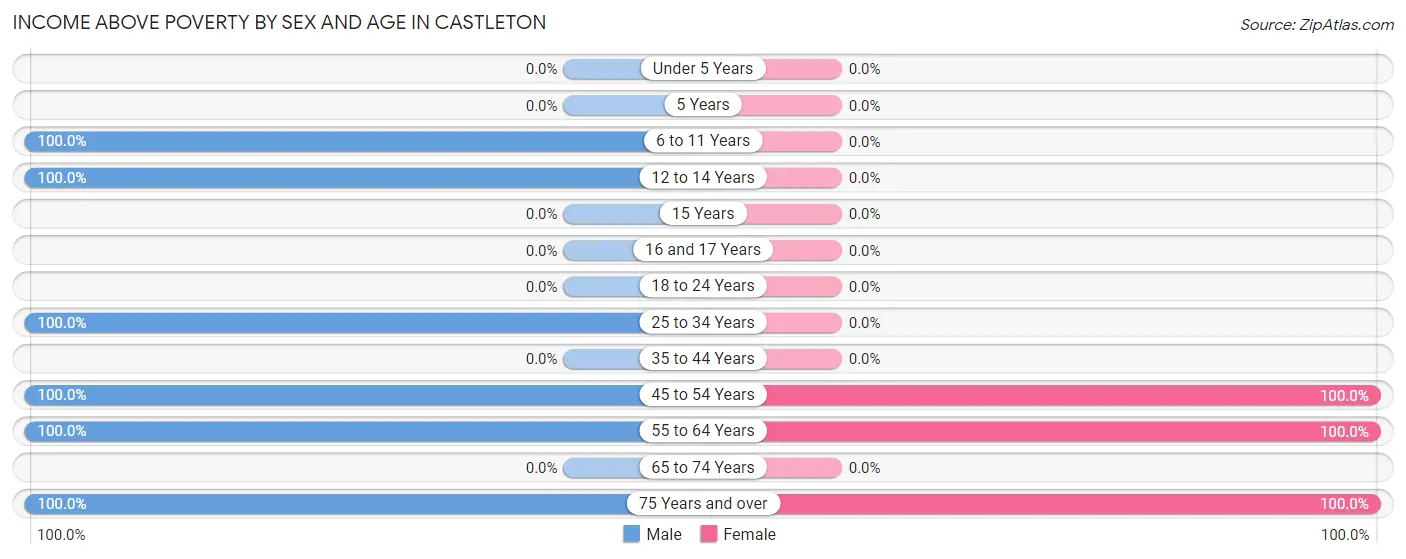
| Age Bracket | Male | Female |
| Under 5 Years | 0 (0.0%) | 0 (0.0%) |
| 5 Years | 0 (0.0%) | 0 (0.0%) |
| 6 to 11 Years | 6 (100.0%) | 0 (0.0%) |
| 12 to 14 Years | 6 (100.0%) | 0 (0.0%) |
| 15 Years | 0 (0.0%) | 0 (0.0%) |
| 16 and 17 Years | 0 (0.0%) | 0 (0.0%) |
| 18 to 24 Years | 0 (0.0%) | 0 (0.0%) |
| 25 to 34 Years | 37 (100.0%) | 0 (0.0%) |
| 35 to 44 Years | 0 (0.0%) | 0 (0.0%) |
| 45 to 54 Years | 16 (100.0%) | 5 (100.0%) |
| 55 to 64 Years | 27 (100.0%) | 10 (100.0%) |
| 65 to 74 Years | 0 (0.0%) | 0 (0.0%) |
| 75 Years and over | 29 (100.0%) | 5 (100.0%) |
| Total | 121 (87.1%) | 20 (100.0%) |
Income Below Poverty Among Married-Couple Families in Castleton
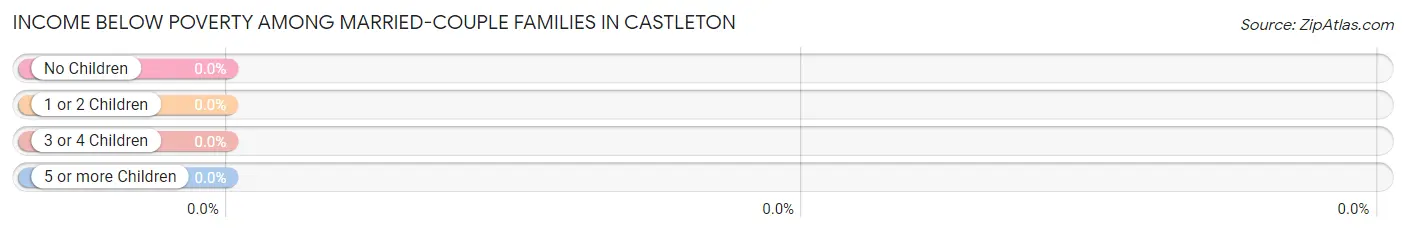
| Children | Above Poverty | Below Poverty |
| No Children | 11 (100.0%) | 0 (0.0%) |
| 1 or 2 Children | 5 (100.0%) | 0 (0.0%) |
| 3 or 4 Children | 0 (0.0%) | 0 (0.0%) |
| 5 or more Children | 0 (0.0%) | 0 (0.0%) |
| Total | 16 (100.0%) | 0 (0.0%) |
Income Below Poverty Among Single-Parent Households in Castleton
| Children | Single Father | Single Mother |
| No Children | 0 (0.0%) | 0 (0.0%) |
| 1 or 2 Children | 0 (0.0%) | 0 (0.0%) |
| 3 or 4 Children | 0 (0.0%) | 0 (0.0%) |
| 5 or more Children | 0 (0.0%) | 0 (0.0%) |
| Total | 0 (0.0%) | 0 (0.0%) |
Income Below Poverty Among Married-Couple vs Single-Parent Households in Castleton
| Children | Married-Couple Families | Single-Parent Households |
| No Children | 0 (0.0%) | 0 (0.0%) |
| 1 or 2 Children | 0 (0.0%) | 0 (0.0%) |
| 3 or 4 Children | 0 (0.0%) | 0 (0.0%) |
| 5 or more Children | 0 (0.0%) | 0 (0.0%) |
| Total | 0 (0.0%) | 0 (0.0%) |
Race in Castleton
The most populous races in Castleton are White / Caucasian (821 | 90.7%), Black / African American (52 | 5.8%), and Hispanic or Latino (25 | 2.8%).
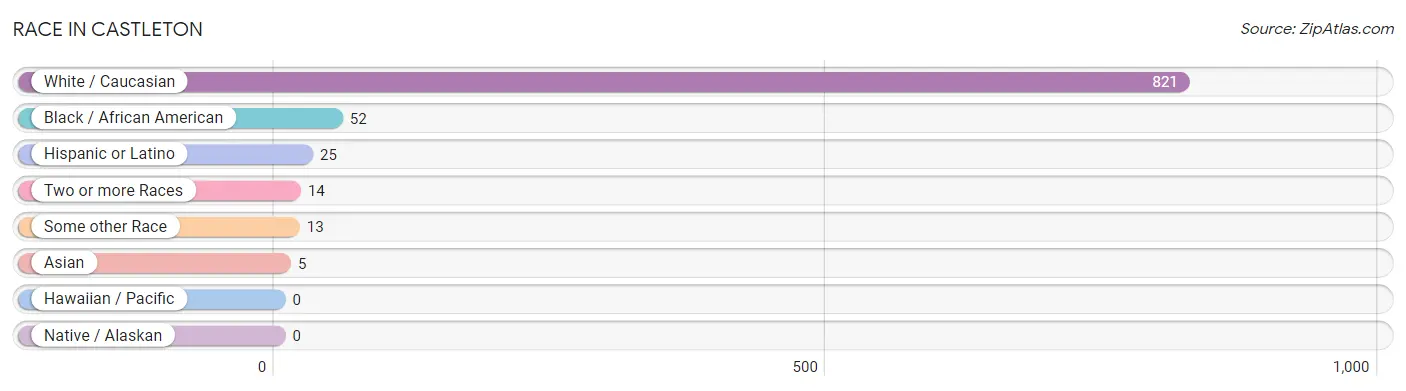
| Race | # Population | % Population |
| Asian | 5 | 0.5% |
| Black / African American | 52 | 5.8% |
| Hawaiian / Pacific | 0 | 0.0% |
| Hispanic or Latino | 25 | 2.8% |
| Native / Alaskan | 0 | 0.0% |
| White / Caucasian | 821 | 90.7% |
| Two or more Races | 14 | 1.5% |
| Some other Race | 13 | 1.4% |
| Total | 905 | 100.0% |
Ancestry in Castleton
The most populous ancestries reported in Castleton are English (93 | 10.3%), Irish (88 | 9.7%), Italian (53 | 5.9%), Polish (53 | 5.9%), and French (52 | 5.8%), together accounting for 37.5% of all Castleton residents.
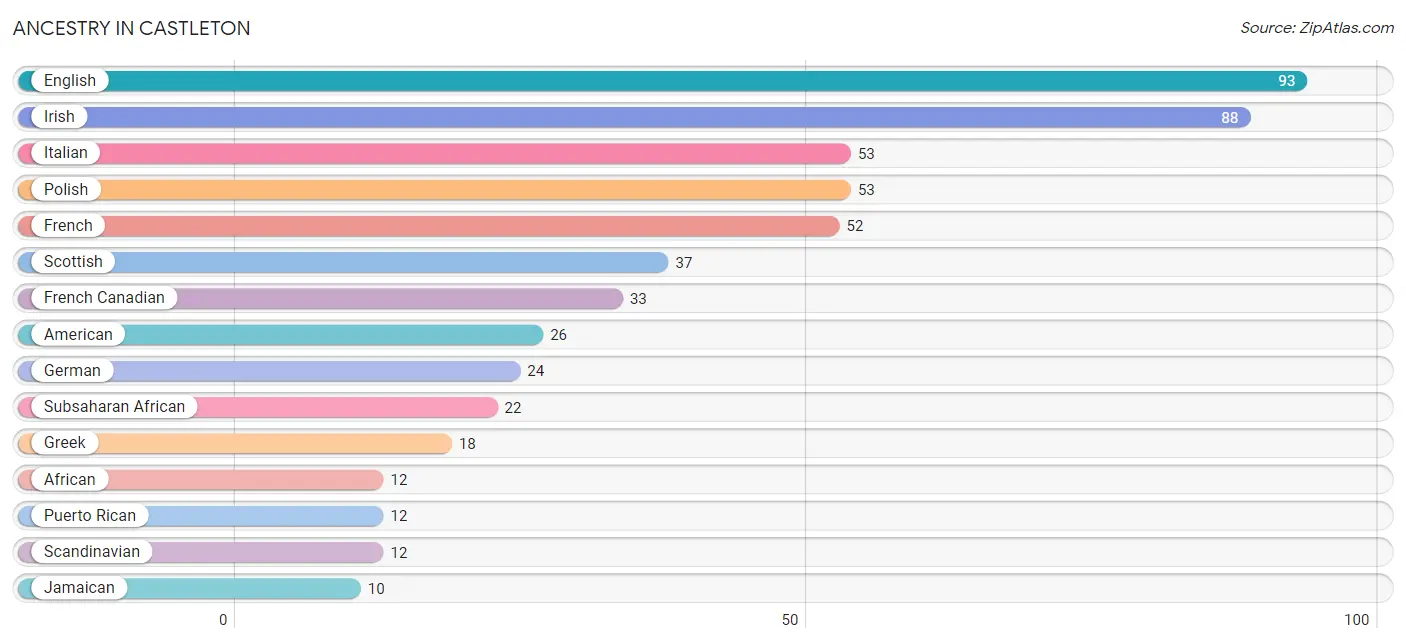
| Ancestry | # Population | % Population |
| African | 12 | 1.3% |
| American | 26 | 2.9% |
| Central American | 2 | 0.2% |
| Dominican | 1 | 0.1% |
| Dutch | 5 | 0.5% |
| Eastern European | 7 | 0.8% |
| English | 93 | 10.3% |
| European | 9 | 1.0% |
| French | 52 | 5.8% |
| French Canadian | 33 | 3.6% |
| German | 24 | 2.6% |
| Greek | 18 | 2.0% |
| Indian (Asian) | 5 | 0.5% |
| Irish | 88 | 9.7% |
| Italian | 53 | 5.9% |
| Jamaican | 10 | 1.1% |
| Korean | 3 | 0.3% |
| Norwegian | 5 | 0.5% |
| Panamanian | 2 | 0.2% |
| Polish | 53 | 5.9% |
| Puerto Rican | 12 | 1.3% |
| Scandinavian | 12 | 1.3% |
| Scottish | 37 | 4.1% |
| Senegalese | 6 | 0.7% |
| Spaniard | 6 | 0.7% |
| Subsaharan African | 22 | 2.4% | View All 26 Rows |
Immigrants in Castleton
The most numerous immigrant groups reported in Castleton came from Africa (10 | 1.1%), Latin America (6 | 0.7%), Senegal (6 | 0.7%), Western Africa (6 | 0.7%), and Asia (5 | 0.5%), together accounting for 3.6% of all Castleton residents.
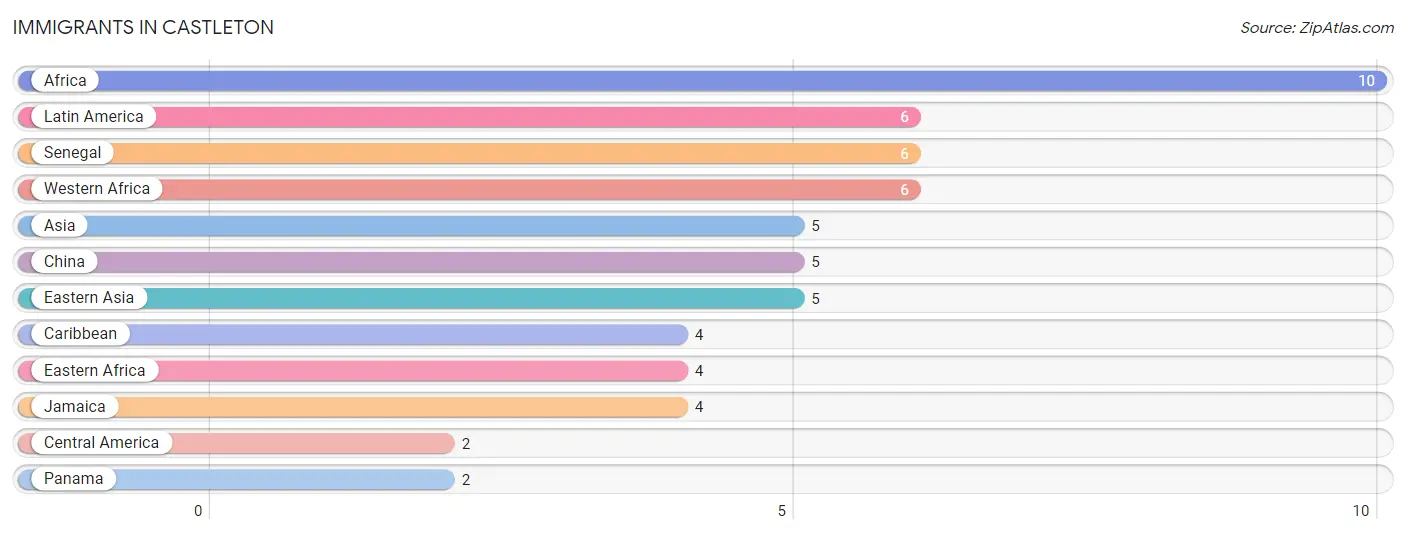
| Immigration Origin | # Population | % Population |
| Africa | 10 | 1.1% |
| Asia | 5 | 0.5% |
| Caribbean | 4 | 0.4% |
| Central America | 2 | 0.2% |
| China | 5 | 0.5% |
| Eastern Africa | 4 | 0.4% |
| Eastern Asia | 5 | 0.5% |
| Jamaica | 4 | 0.4% |
| Latin America | 6 | 0.7% |
| Panama | 2 | 0.2% |
| Senegal | 6 | 0.7% |
| Western Africa | 6 | 0.7% | View All 12 Rows |
Sex and Age in Castleton
Sex and Age in Castleton
The most populous age groups in Castleton are 15 to 19 Years (224 | 38.2%) for men and 15 to 19 Years (194 | 60.8%) for women.
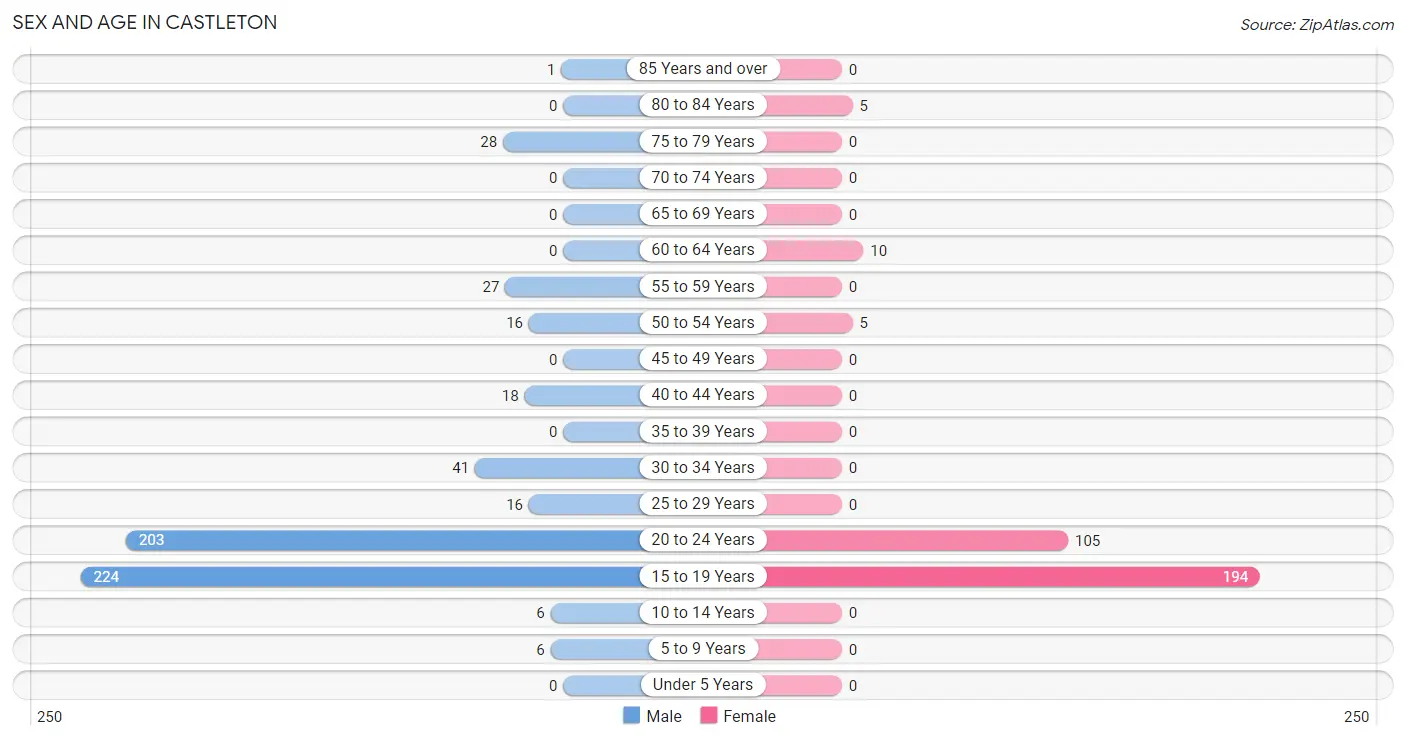
| Age Bracket | Male | Female |
| Under 5 Years | 0 (0.0%) | 0 (0.0%) |
| 5 to 9 Years | 6 (1.0%) | 0 (0.0%) |
| 10 to 14 Years | 6 (1.0%) | 0 (0.0%) |
| 15 to 19 Years | 224 (38.2%) | 194 (60.8%) |
| 20 to 24 Years | 203 (34.6%) | 105 (32.9%) |
| 25 to 29 Years | 16 (2.7%) | 0 (0.0%) |
| 30 to 34 Years | 41 (7.0%) | 0 (0.0%) |
| 35 to 39 Years | 0 (0.0%) | 0 (0.0%) |
| 40 to 44 Years | 18 (3.1%) | 0 (0.0%) |
| 45 to 49 Years | 0 (0.0%) | 0 (0.0%) |
| 50 to 54 Years | 16 (2.7%) | 5 (1.6%) |
| 55 to 59 Years | 27 (4.6%) | 0 (0.0%) |
| 60 to 64 Years | 0 (0.0%) | 10 (3.1%) |
| 65 to 69 Years | 0 (0.0%) | 0 (0.0%) |
| 70 to 74 Years | 0 (0.0%) | 0 (0.0%) |
| 75 to 79 Years | 28 (4.8%) | 0 (0.0%) |
| 80 to 84 Years | 0 (0.0%) | 5 (1.6%) |
| 85 Years and over | 1 (0.2%) | 0 (0.0%) |
| Total | 586 (100.0%) | 319 (100.0%) |
Families and Households in Castleton
Median Family Size in Castleton
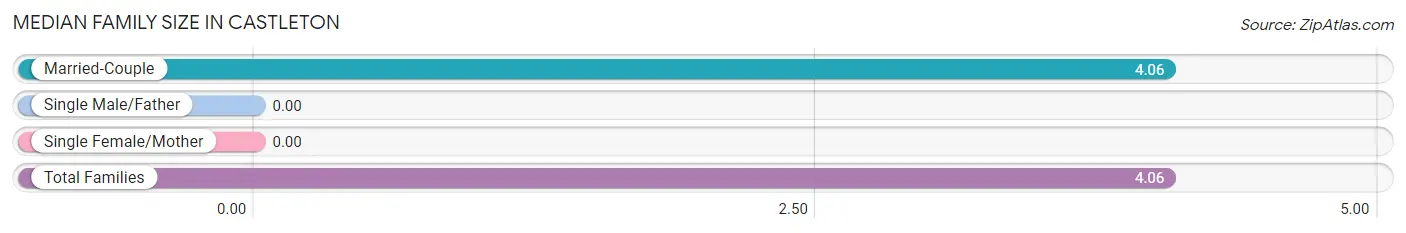
| Family Type | # Families | Family Size |
| Married-Couple | 16 (100.0%) | 4.06 |
| Single Male/Father | 0 (0.0%) | - |
| Single Female/Mother | 0 (0.0%) | - |
| Total Families | 16 (100.0%) | 4.06 |
Median Household Size in Castleton
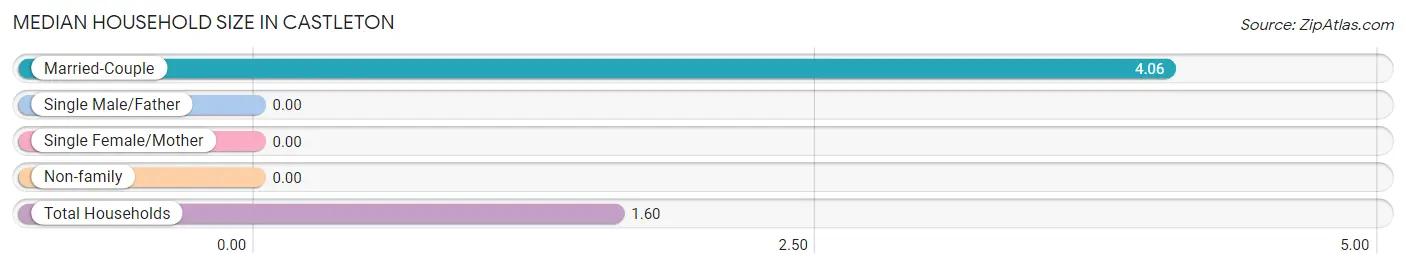
| Household Type | # Households | Household Size |
| Married-Couple | 16 (19.8%) | 4.06 |
| Single Male/Father | 0 (0.0%) | - |
| Single Female/Mother | 0 (0.0%) | - |
| Non-family | 65 (80.2%) | - |
| Total Households | 81 (100.0%) | 1.60 |
Household Size by Marriage Status in Castleton
Out of a total of 81 households in Castleton, 16 (19.8%) are family households, while 65 (80.2%) are nonfamily households. The most numerous type of family households are 2-person households, comprising 10, and the most common type of nonfamily households are 1-person households, comprising 65.
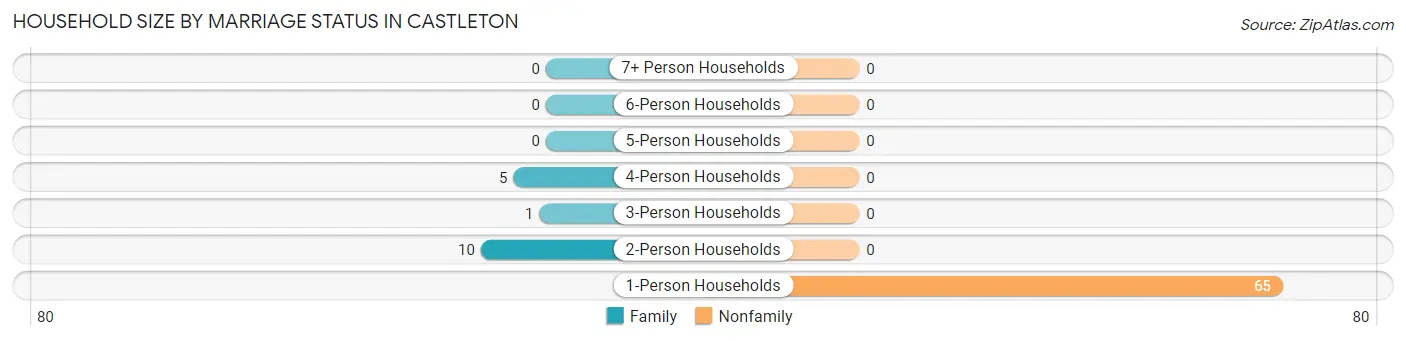
| Household Size | Family Households | Nonfamily Households |
| 1-Person Households | - | 65 (80.2%) |
| 2-Person Households | 10 (12.3%) | 0 (0.0%) |
| 3-Person Households | 1 (1.2%) | 0 (0.0%) |
| 4-Person Households | 5 (6.2%) | 0 (0.0%) |
| 5-Person Households | 0 (0.0%) | 0 (0.0%) |
| 6-Person Households | 0 (0.0%) | 0 (0.0%) |
| 7+ Person Households | 0 (0.0%) | 0 (0.0%) |
| Total | 16 (19.8%) | 65 (80.2%) |
Female Fertility in Castleton
Fertility by Age in Castleton
| Age Bracket | Women with Births | Births / 1,000 Women |
| 15 to 19 years | 0 (0.0%) | 0.0 |
| 20 to 34 years | 0 (0.0%) | 0.0 |
| 35 to 50 years | 0 (0.0%) | 0.0 |
| Total | 0 (0.0%) | 0.0 |
Fertility by Age by Marriage Status in Castleton
| Age Bracket | Married | Unmarried |
| 15 to 19 years | 0 (0.0%) | 0 (0.0%) |
| 20 to 34 years | 0 (0.0%) | 0 (0.0%) |
| 35 to 50 years | 0 (0.0%) | 0 (0.0%) |
| Total | 0 (0.0%) | 0 (0.0%) |
Fertility by Education in Castleton
| Educational Attainment | Women with Births | Births / 1,000 Women |
| Less than High School | 0 (0.0%) | 0.0 |
| High School Diploma | 0 (0.0%) | 0.0 |
| College or Associate's Degree | 0 (0.0%) | 0.0 |
| Bachelor's Degree | 0 (0.0%) | 0.0 |
| Graduate Degree | 0 (0.0%) | 0.0 |
| Total | 0 (0.0%) | 0.0 |
Fertility by Education by Marriage Status in Castleton
| Educational Attainment | Married | Unmarried |
| Less than High School | 0 (0.0%) | 0 (0.0%) |
| High School Diploma | 0 (0.0%) | 0 (0.0%) |
| College or Associate's Degree | 0 (0.0%) | 0 (0.0%) |
| Bachelor's Degree | 0 (0.0%) | 0 (0.0%) |
| Graduate Degree | 0 (0.0%) | 0 (0.0%) |
| Total | 0 (0.0%) | 0 (0.0%) |
Employment Characteristics in Castleton
Employment by Class of Employer in Castleton
Among the 321 employed individuals in Castleton, private company employees (236 | 73.5%), state government employees (50 | 15.6%), and not-for-profit organizations (22 | 6.9%) make up the most common classes of employment.
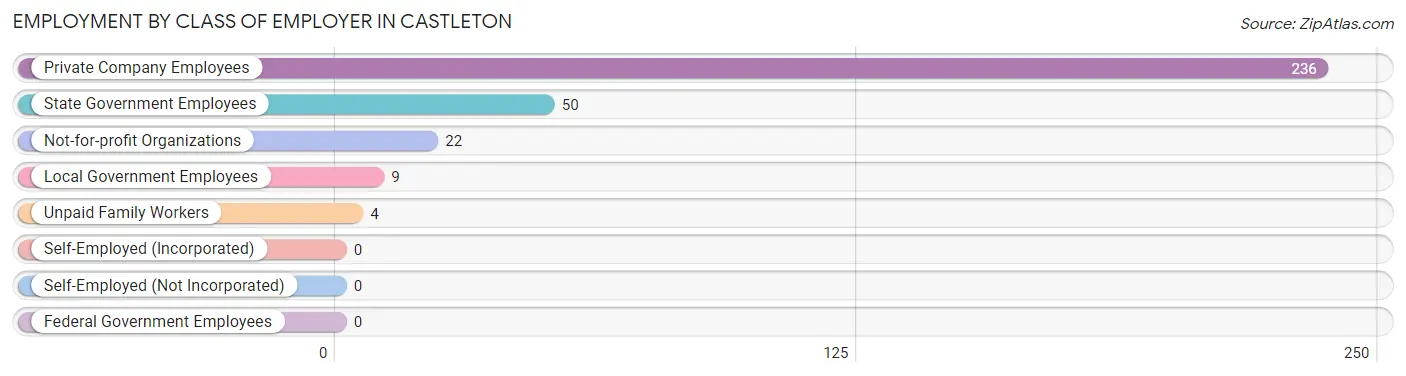
| Employer Class | # Employees | % Employees |
| Private Company Employees | 236 | 73.5% |
| Self-Employed (Incorporated) | 0 | 0.0% |
| Self-Employed (Not Incorporated) | 0 | 0.0% |
| Not-for-profit Organizations | 22 | 6.9% |
| Local Government Employees | 9 | 2.8% |
| State Government Employees | 50 | 15.6% |
| Federal Government Employees | 0 | 0.0% |
| Unpaid Family Workers | 4 | 1.3% |
| Total | 321 | 100.0% |
Employment Status by Age in Castleton
According to the labor force statistics for Castleton, out of the total population over 16 years of age (893), 40.6% or 363 individuals are in the labor force, with 6.9% or 25 of them unemployed. The age group with the highest labor force participation rate is 35 to 44 years, with 100.0% or 18 individuals in the labor force. Within the labor force, the 16 to 19 years age range has the highest percentage of unemployed individuals, with 16.0% or 16 of them being unemployed.
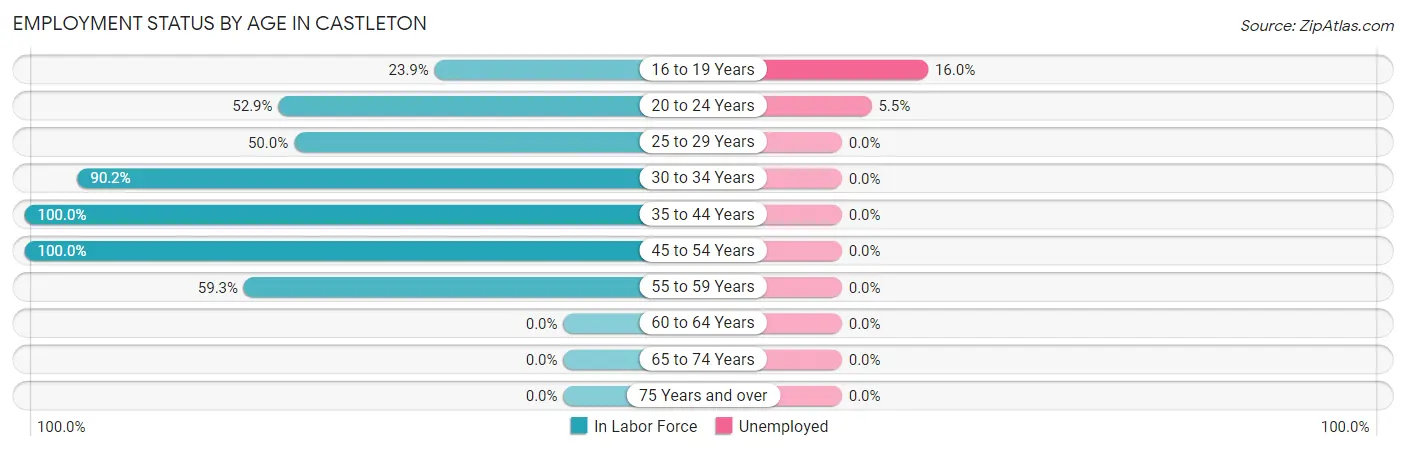
| Age Bracket | In Labor Force | Unemployed |
| 16 to 19 Years | 100 (23.9%) | 16 (16.0%) |
| 20 to 24 Years | 163 (52.9%) | 9 (5.5%) |
| 25 to 29 Years | 8 (50.0%) | 0 (0.0%) |
| 30 to 34 Years | 37 (90.2%) | 0 (0.0%) |
| 35 to 44 Years | 18 (100.0%) | 0 (0.0%) |
| 45 to 54 Years | 21 (100.0%) | 0 (0.0%) |
| 55 to 59 Years | 16 (59.3%) | 0 (0.0%) |
| 60 to 64 Years | 0 (0.0%) | 0 (0.0%) |
| 65 to 74 Years | 0 (0.0%) | 0 (0.0%) |
| 75 Years and over | 0 (0.0%) | 0 (0.0%) |
| Total | 363 (40.6%) | 25 (6.9%) |
Employment Status by Educational Attainment in Castleton
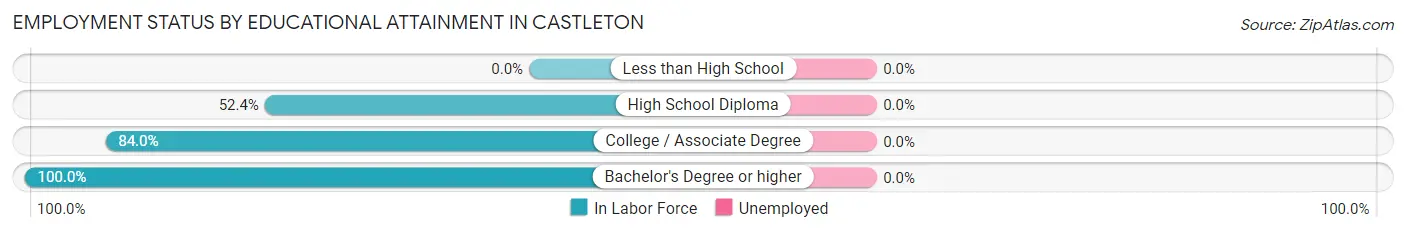
| Educational Attainment | In Labor Force | Unemployed |
| Less than High School | 0 (0.0%) | 0 (0.0%) |
| High School Diploma | 11 (52.4%) | 0 (0.0%) |
| College / Associate Degree | 63 (84.0%) | 0 (0.0%) |
| Bachelor's Degree or higher | 26 (100.0%) | 0 (0.0%) |
| Total | 100 (75.2%) | 0 (0.0%) |
Employment Occupations by Sex in Castleton
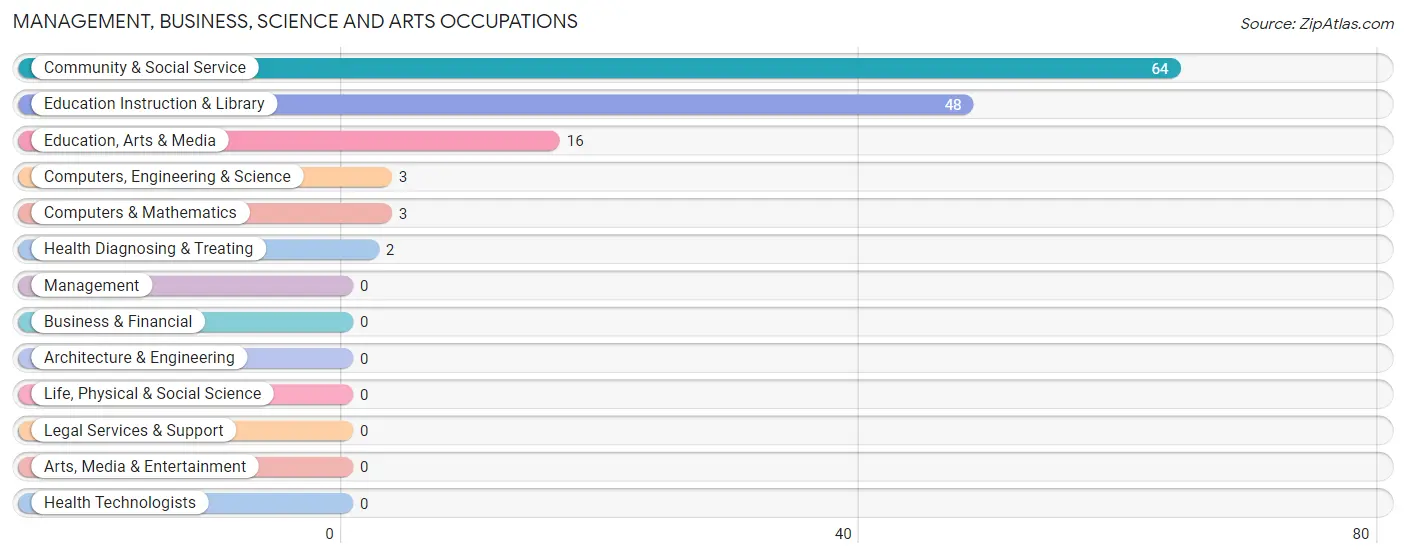
Management, Business, Science and Arts Occupations
The most common Management, Business, Science and Arts occupations in Castleton are Community & Social Service (64 | 18.9%), Education Instruction & Library (48 | 14.2%), Education, Arts & Media (16 | 4.7%), Computers, Engineering & Science (3 | 0.9%), and Computers & Mathematics (3 | 0.9%).
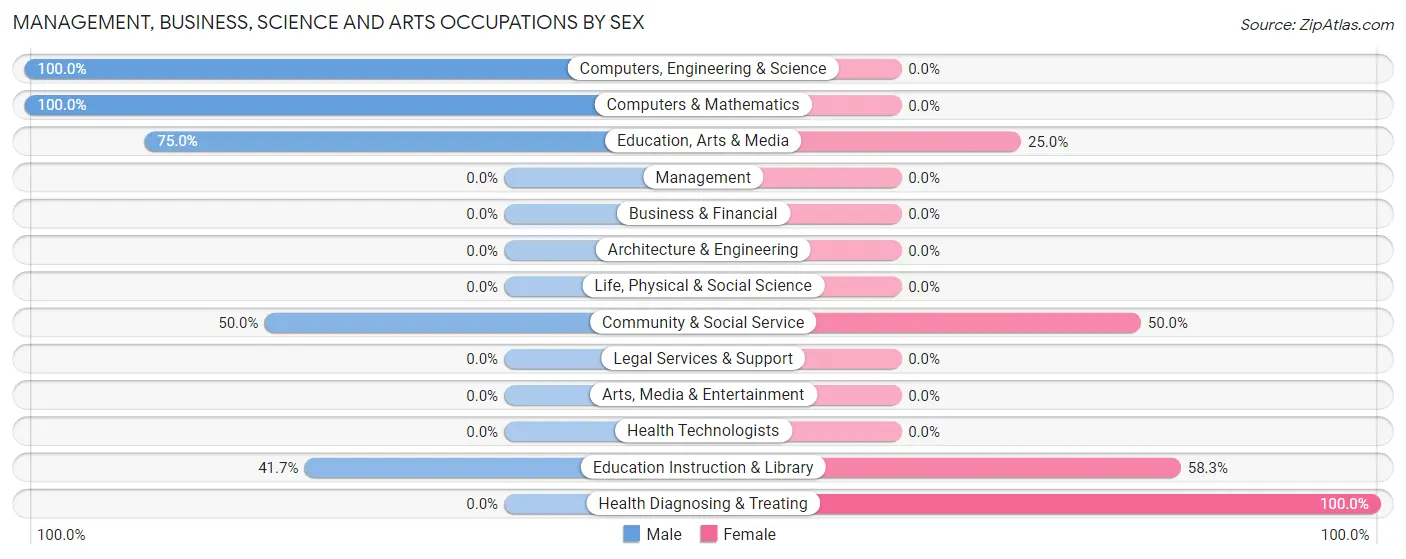
Management, Business, Science and Arts Occupations by Sex
Within the Management, Business, Science and Arts occupations in Castleton, the most male-oriented occupations are Computers, Engineering & Science (100.0%), Computers & Mathematics (100.0%), and Education, Arts & Media (75.0%), while the most female-oriented occupations are Health Diagnosing & Treating (100.0%), Education Instruction & Library (58.3%), and Community & Social Service (50.0%).
| Occupation | Male | Female |
| Management | 0 (0.0%) | 0 (0.0%) |
| Business & Financial | 0 (0.0%) | 0 (0.0%) |
| Computers, Engineering & Science | 3 (100.0%) | 0 (0.0%) |
| Computers & Mathematics | 3 (100.0%) | 0 (0.0%) |
| Architecture & Engineering | 0 (0.0%) | 0 (0.0%) |
| Life, Physical & Social Science | 0 (0.0%) | 0 (0.0%) |
| Community & Social Service | 32 (50.0%) | 32 (50.0%) |
| Education, Arts & Media | 12 (75.0%) | 4 (25.0%) |
| Legal Services & Support | 0 (0.0%) | 0 (0.0%) |
| Education Instruction & Library | 20 (41.7%) | 28 (58.3%) |
| Arts, Media & Entertainment | 0 (0.0%) | 0 (0.0%) |
| Health Diagnosing & Treating | 0 (0.0%) | 2 (100.0%) |
| Health Technologists | 0 (0.0%) | 0 (0.0%) |
| Total (Category) | 35 (50.7%) | 34 (49.3%) |
| Total (Overall) | 193 (57.1%) | 145 (42.9%) |
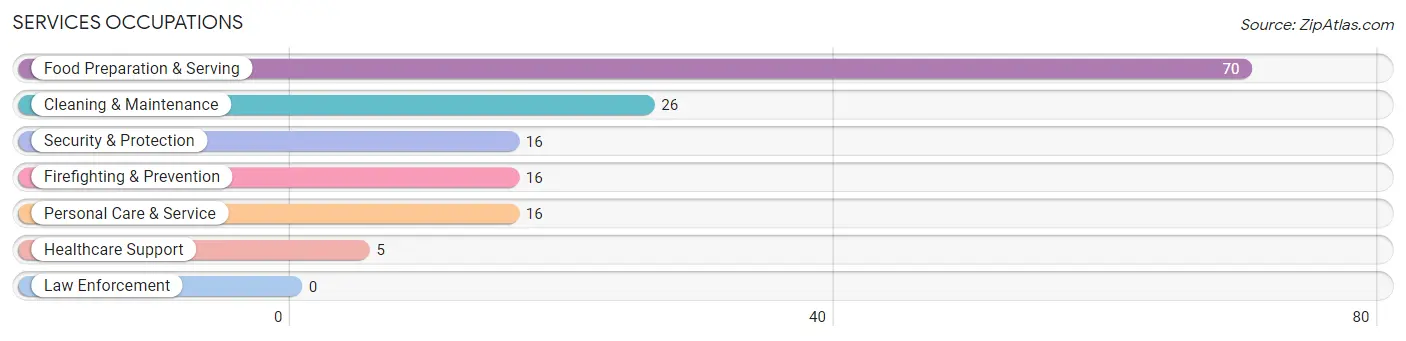
Services Occupations
The most common Services occupations in Castleton are Food Preparation & Serving (70 | 20.7%), Cleaning & Maintenance (26 | 7.7%), Security & Protection (16 | 4.7%), Firefighting & Prevention (16 | 4.7%), and Personal Care & Service (16 | 4.7%).
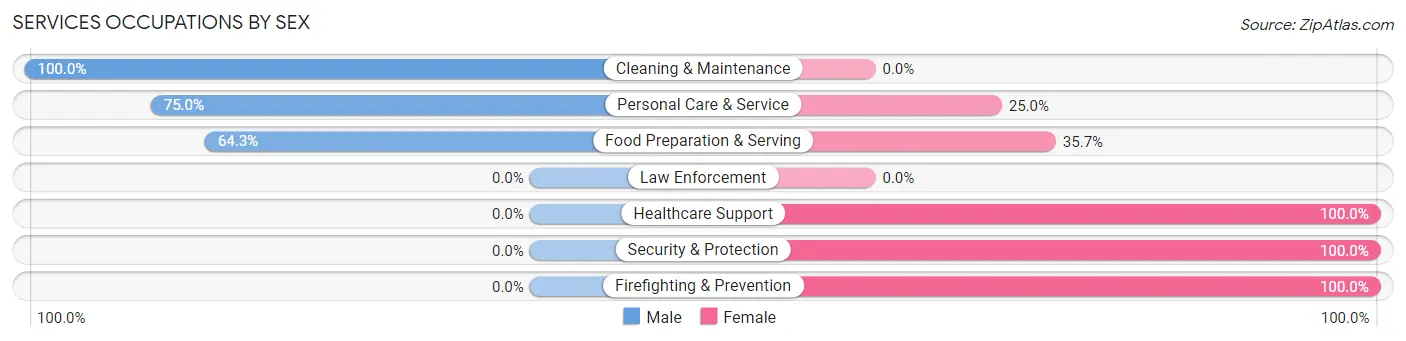
Services Occupations by Sex
Within the Services occupations in Castleton, the most male-oriented occupations are Cleaning & Maintenance (100.0%), Personal Care & Service (75.0%), and Food Preparation & Serving (64.3%), while the most female-oriented occupations are Healthcare Support (100.0%), Security & Protection (100.0%), and Firefighting & Prevention (100.0%).
| Occupation | Male | Female |
| Healthcare Support | 0 (0.0%) | 5 (100.0%) |
| Security & Protection | 0 (0.0%) | 16 (100.0%) |
| Firefighting & Prevention | 0 (0.0%) | 16 (100.0%) |
| Law Enforcement | 0 (0.0%) | 0 (0.0%) |
| Food Preparation & Serving | 45 (64.3%) | 25 (35.7%) |
| Cleaning & Maintenance | 26 (100.0%) | 0 (0.0%) |
| Personal Care & Service | 12 (75.0%) | 4 (25.0%) |
| Total (Category) | 83 (62.4%) | 50 (37.6%) |
| Total (Overall) | 193 (57.1%) | 145 (42.9%) |
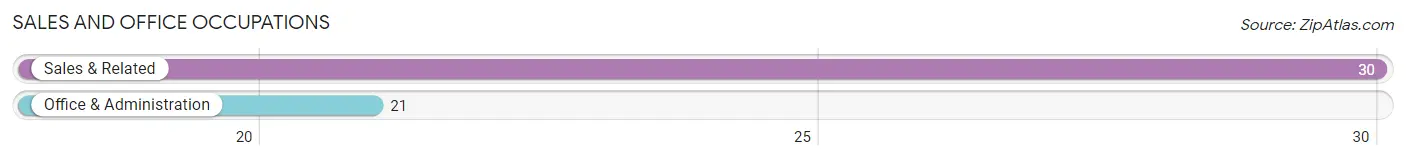
Sales and Office Occupations
The most common Sales and Office occupations in Castleton are Sales & Related (30 | 8.9%), and Office & Administration (21 | 6.2%).
Sales and Office Occupations by Sex
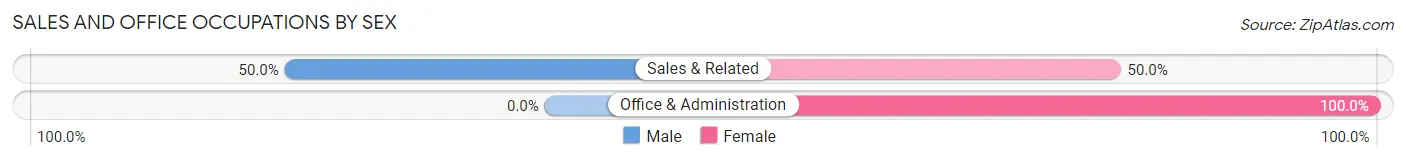
| Occupation | Male | Female |
| Sales & Related | 15 (50.0%) | 15 (50.0%) |
| Office & Administration | 0 (0.0%) | 21 (100.0%) |
| Total (Category) | 15 (29.4%) | 36 (70.6%) |
| Total (Overall) | 193 (57.1%) | 145 (42.9%) |
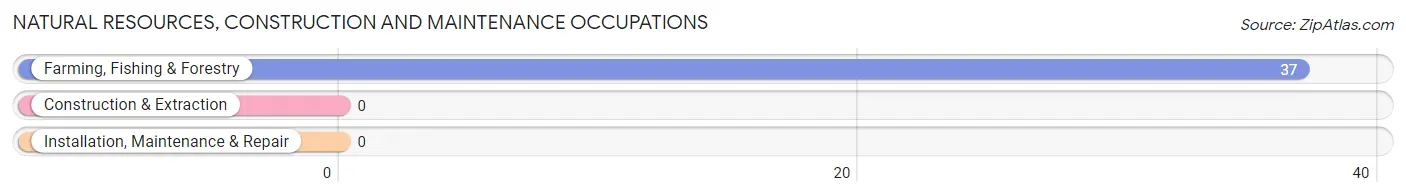
Natural Resources, Construction and Maintenance Occupations
The most common Natural Resources, Construction and Maintenance occupations in Castleton are , and Farming, Fishing & Forestry (37 | 11.0%).
Natural Resources, Construction and Maintenance Occupations by Sex
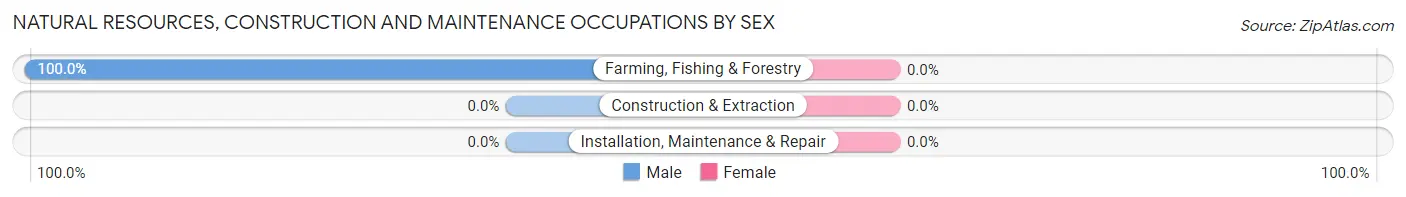
| Occupation | Male | Female |
| Farming, Fishing & Forestry | 37 (100.0%) | 0 (0.0%) |
| Construction & Extraction | 0 (0.0%) | 0 (0.0%) |
| Installation, Maintenance & Repair | 0 (0.0%) | 0 (0.0%) |
| Total (Category) | 37 (100.0%) | 0 (0.0%) |
| Total (Overall) | 193 (57.1%) | 145 (42.9%) |
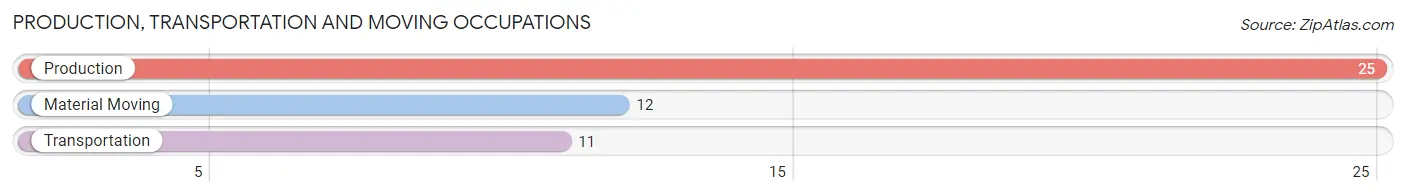
Production, Transportation and Moving Occupations
The most common Production, Transportation and Moving occupations in Castleton are Production (25 | 7.4%), Material Moving (12 | 3.5%), and Transportation (11 | 3.3%).
Production, Transportation and Moving Occupations by Sex
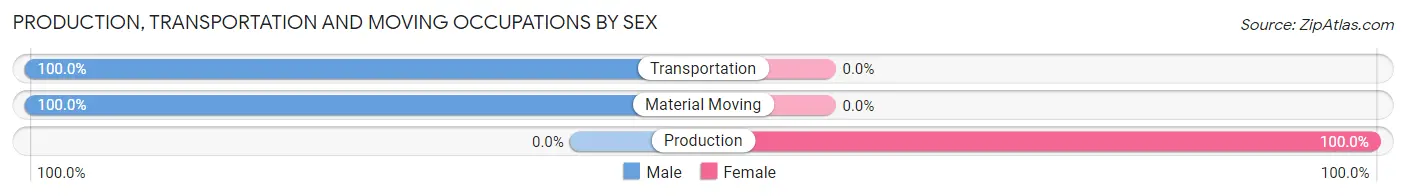
| Occupation | Male | Female |
| Production | 0 (0.0%) | 25 (100.0%) |
| Transportation | 11 (100.0%) | 0 (0.0%) |
| Material Moving | 12 (100.0%) | 0 (0.0%) |
| Total (Category) | 23 (47.9%) | 25 (52.1%) |
| Total (Overall) | 193 (57.1%) | 145 (42.9%) |
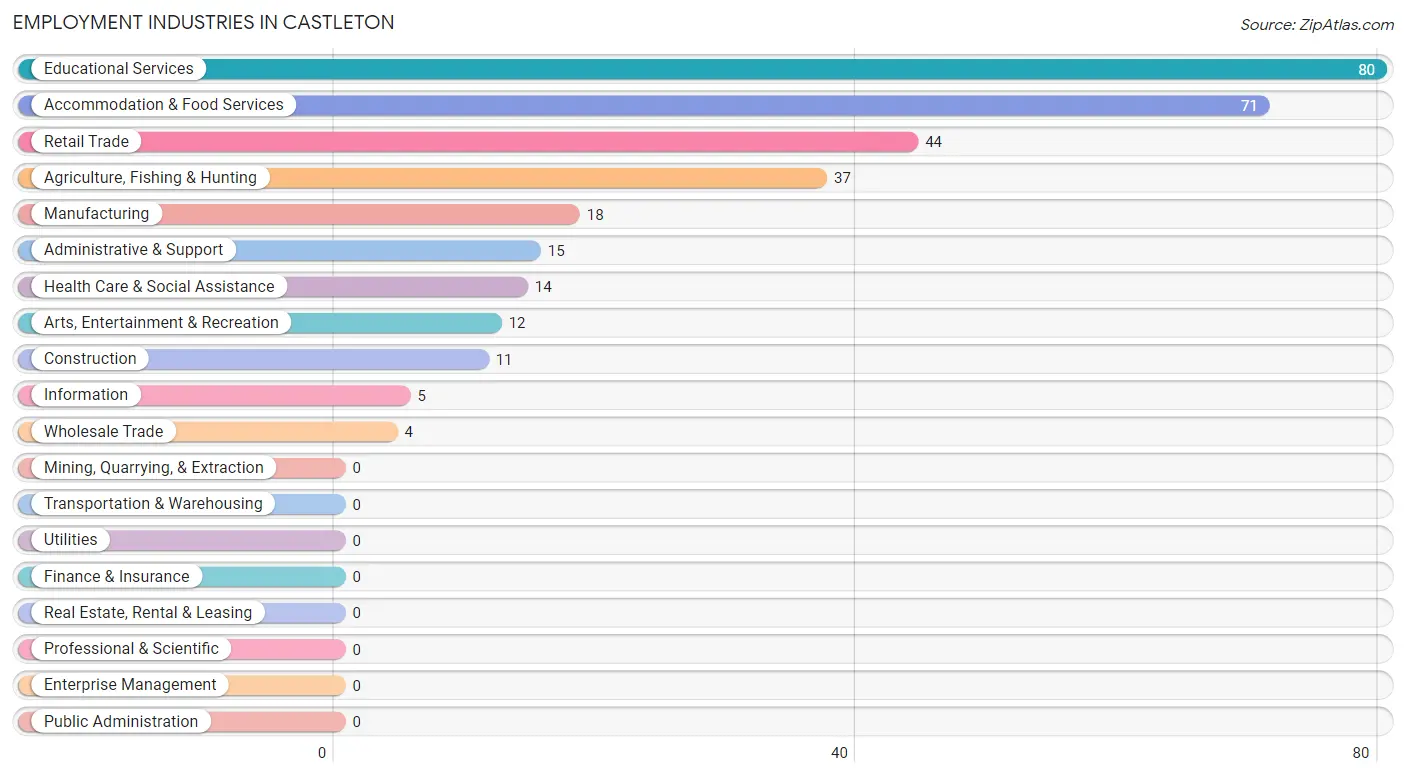
Employment Industries by Sex in Castleton
Employment Industries in Castleton
The major employment industries in Castleton include Educational Services (80 | 23.7%), Accommodation & Food Services (71 | 21.0%), Retail Trade (44 | 13.0%), Agriculture, Fishing & Hunting (37 | 11.0%), and Manufacturing (18 | 5.3%).
Employment Industries by Sex in Castleton
The Castleton industries that see more men than women are Agriculture, Fishing & Hunting (100.0%), Construction (100.0%), and Arts, Entertainment & Recreation (100.0%), whereas the industries that tend to have a higher number of women are Manufacturing (100.0%), Wholesale Trade (100.0%), and Information (100.0%).
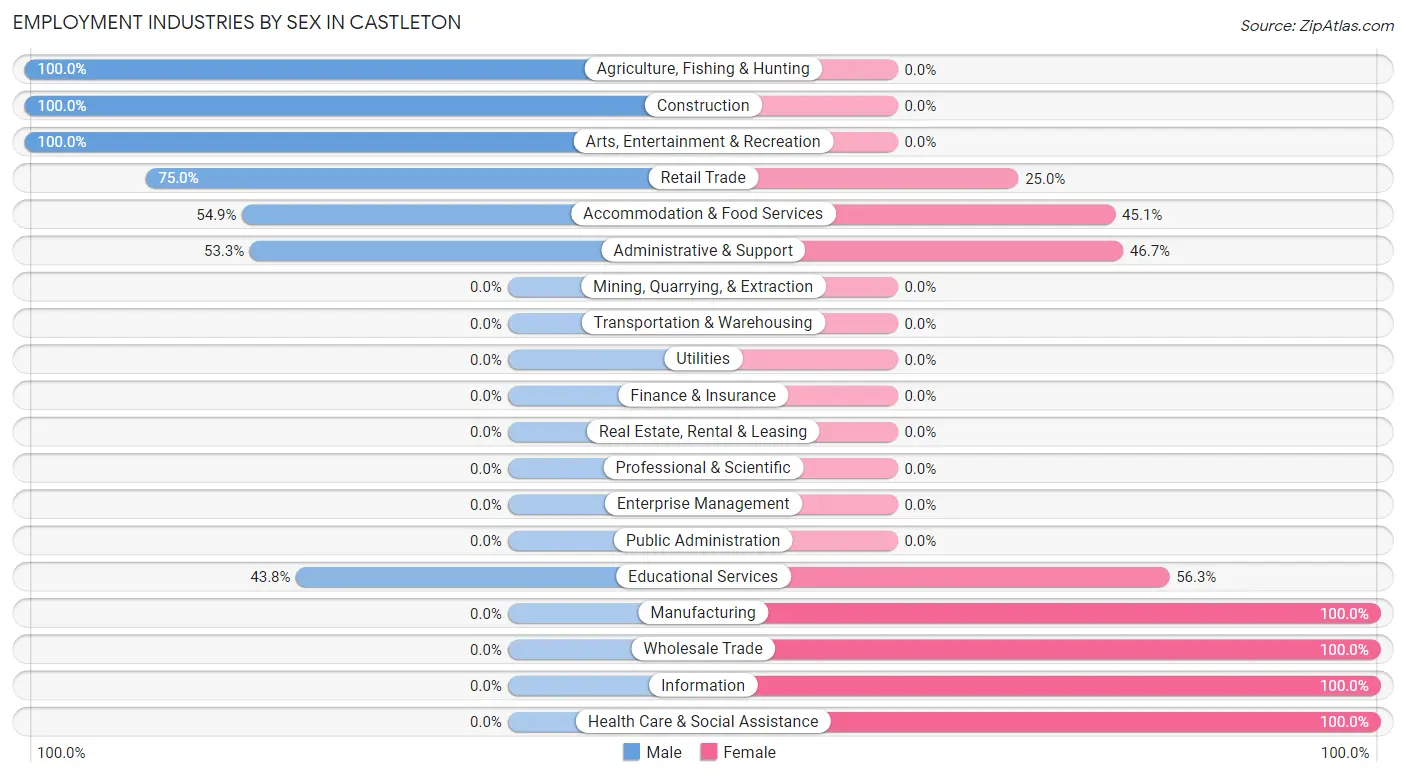
| Industry | Male | Female |
| Agriculture, Fishing & Hunting | 37 (100.0%) | 0 (0.0%) |
| Mining, Quarrying, & Extraction | 0 (0.0%) | 0 (0.0%) |
| Construction | 11 (100.0%) | 0 (0.0%) |
| Manufacturing | 0 (0.0%) | 18 (100.0%) |
| Wholesale Trade | 0 (0.0%) | 4 (100.0%) |
| Retail Trade | 33 (75.0%) | 11 (25.0%) |
| Transportation & Warehousing | 0 (0.0%) | 0 (0.0%) |
| Utilities | 0 (0.0%) | 0 (0.0%) |
| Information | 0 (0.0%) | 5 (100.0%) |
| Finance & Insurance | 0 (0.0%) | 0 (0.0%) |
| Real Estate, Rental & Leasing | 0 (0.0%) | 0 (0.0%) |
| Professional & Scientific | 0 (0.0%) | 0 (0.0%) |
| Enterprise Management | 0 (0.0%) | 0 (0.0%) |
| Administrative & Support | 8 (53.3%) | 7 (46.7%) |
| Educational Services | 35 (43.8%) | 45 (56.2%) |
| Health Care & Social Assistance | 0 (0.0%) | 14 (100.0%) |
| Arts, Entertainment & Recreation | 12 (100.0%) | 0 (0.0%) |
| Accommodation & Food Services | 39 (54.9%) | 32 (45.1%) |
| Public Administration | 0 (0.0%) | 0 (0.0%) |
| Total | 193 (57.1%) | 145 (42.9%) |
Education in Castleton
School Enrollment in Castleton
The most common levels of schooling among the 758 students in Castleton are college / undergraduate (743 | 98.0%), elementary school (6 | 0.8%), and middle school (6 | 0.8%).
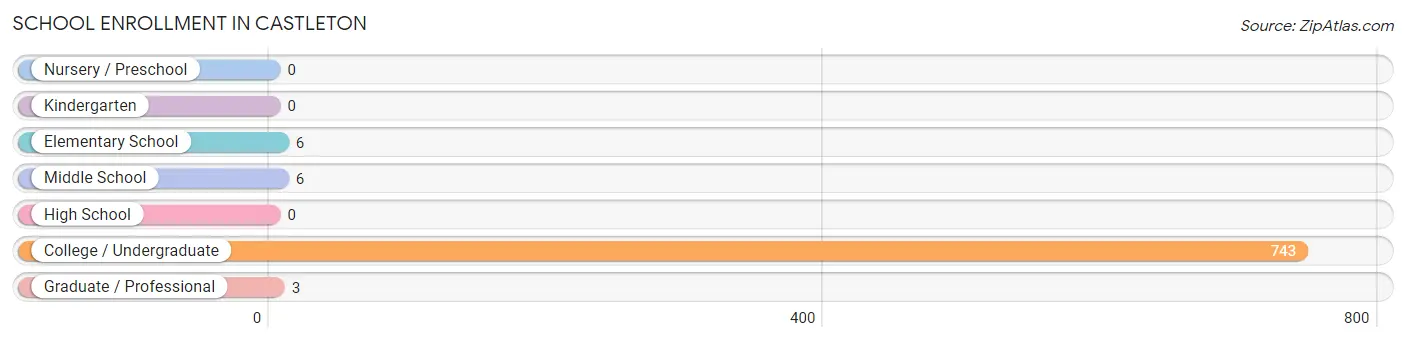
| School Level | # Students | % Students |
| Nursery / Preschool | 0 | 0.0% |
| Kindergarten | 0 | 0.0% |
| Elementary School | 6 | 0.8% |
| Middle School | 6 | 0.8% |
| High School | 0 | 0.0% |
| College / Undergraduate | 743 | 98.0% |
| Graduate / Professional | 3 | 0.4% |
| Total | 758 | 100.0% |
School Enrollment by Age by Funding Source in Castleton
Out of a total of 758 students who are enrolled in schools in Castleton, 35 (4.6%) attend a private institution, while the remaining 723 (95.4%) are enrolled in public schools. The age group of 5 to 9 year old has the highest likelihood of being enrolled in private schools, with 6 (100.0% in the age bracket) enrolled. Conversely, the age group of 10 to 14 year olds has the lowest likelihood of being enrolled in a private school, with 6 (100.0% in the age bracket) attending a public institution.
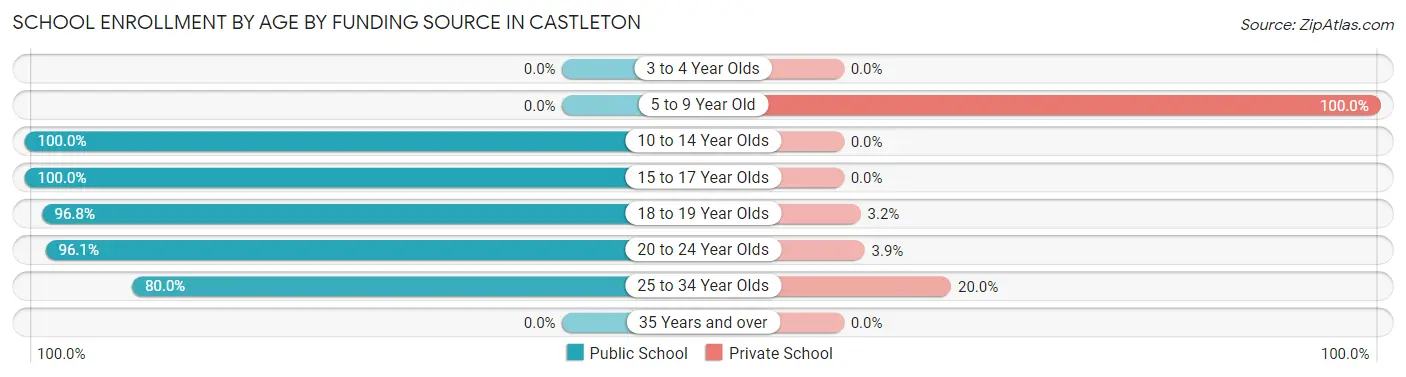
| Age Bracket | Public School | Private School |
| 3 to 4 Year Olds | 0 (0.0%) | 0 (0.0%) |
| 5 to 9 Year Old | 0 (0.0%) | 6 (100.0%) |
| 10 to 14 Year Olds | 6 (100.0%) | 0 (0.0%) |
| 15 to 17 Year Olds | 7 (100.0%) | 0 (0.0%) |
| 18 to 19 Year Olds | 398 (96.8%) | 13 (3.2%) |
| 20 to 24 Year Olds | 296 (96.1%) | 12 (3.9%) |
| 25 to 34 Year Olds | 16 (80.0%) | 4 (20.0%) |
| 35 Years and over | 0 (0.0%) | 0 (0.0%) |
| Total | 723 (95.4%) | 35 (4.6%) |
Educational Attainment by Field of Study in Castleton
Education (28 | 51.8%), business (16 | 29.6%), liberal arts & history (5 | 9.3%), and visual & performing arts (5 | 9.3%) are the most common fields of study among 54 individuals in Castleton who have obtained a bachelor's degree or higher.
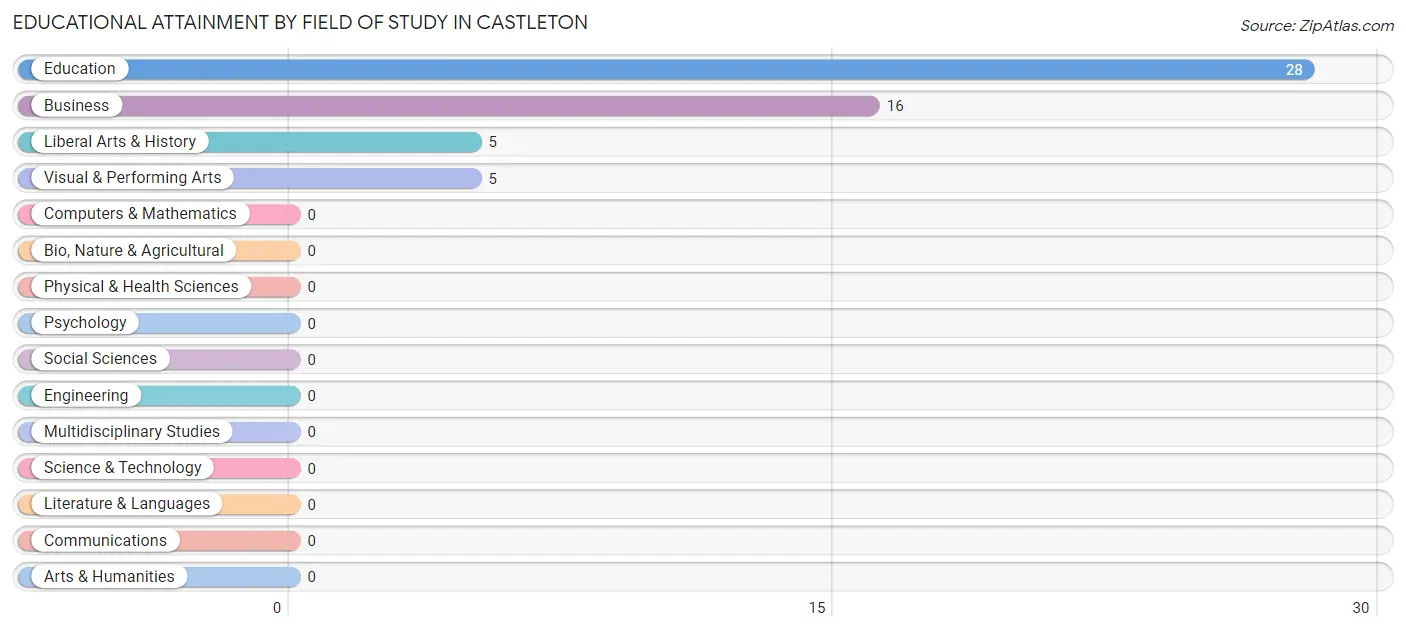
| Field of Study | # Graduates | % Graduates |
| Computers & Mathematics | 0 | 0.0% |
| Bio, Nature & Agricultural | 0 | 0.0% |
| Physical & Health Sciences | 0 | 0.0% |
| Psychology | 0 | 0.0% |
| Social Sciences | 0 | 0.0% |
| Engineering | 0 | 0.0% |
| Multidisciplinary Studies | 0 | 0.0% |
| Science & Technology | 0 | 0.0% |
| Business | 16 | 29.6% |
| Education | 28 | 51.8% |
| Literature & Languages | 0 | 0.0% |
| Liberal Arts & History | 5 | 9.3% |
| Visual & Performing Arts | 5 | 9.3% |
| Communications | 0 | 0.0% |
| Arts & Humanities | 0 | 0.0% |
| Total | 54 | 100.0% |
Transportation & Commute in Castleton
Vehicle Availability by Sex in Castleton
The most prevalent vehicle ownership categories in Castleton are males with 1 vehicle (37, accounting for 53.6%) and females with 1 vehicle (0, making up 740.0%).
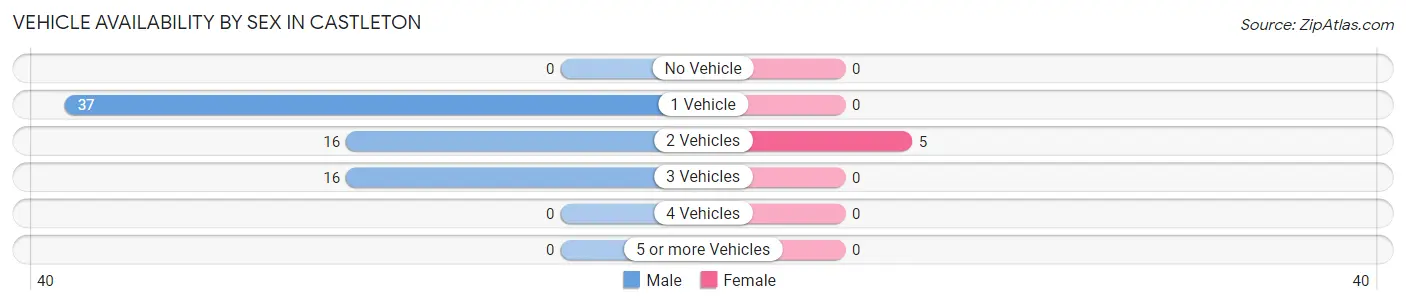
| Vehicles Available | Male | Female |
| No Vehicle | 0 (0.0%) | 0 (0.0%) |
| 1 Vehicle | 37 (53.6%) | 0 (0.0%) |
| 2 Vehicles | 16 (23.2%) | 5 (100.0%) |
| 3 Vehicles | 16 (23.2%) | 0 (0.0%) |
| 4 Vehicles | 0 (0.0%) | 0 (0.0%) |
| 5 or more Vehicles | 0 (0.0%) | 0 (0.0%) |
| Total | 69 (100.0%) | 5 (100.0%) |
Commute Time in Castleton
The most frequently occuring commute durations in Castleton are 5 to 9 minutes (80 commuters, 27.9%), 15 to 19 minutes (61 commuters, 21.2%), and less than 5 minutes (47 commuters, 16.4%).
| Commute Time | # Commuters | % Commuters |
| Less than 5 Minutes | 47 | 16.4% |
| 5 to 9 Minutes | 80 | 27.9% |
| 10 to 14 Minutes | 20 | 7.0% |
| 15 to 19 Minutes | 61 | 21.2% |
| 20 to 24 Minutes | 14 | 4.9% |
| 25 to 29 Minutes | 0 | 0.0% |
| 30 to 34 Minutes | 33 | 11.5% |
| 35 to 39 Minutes | 0 | 0.0% |
| 40 to 44 Minutes | 16 | 5.6% |
| 45 to 59 Minutes | 0 | 0.0% |
| 60 to 89 Minutes | 12 | 4.2% |
| 90 or more Minutes | 4 | 1.4% |
Commute Time by Sex in Castleton
The most common commute times in Castleton are 15 to 19 minutes (57 commuters, 32.2%) for males and 5 to 9 minutes (47 commuters, 42.7%) for females.
| Commute Time | Male | Female |
| Less than 5 Minutes | 18 (10.2%) | 29 (26.4%) |
| 5 to 9 Minutes | 33 (18.6%) | 47 (42.7%) |
| 10 to 14 Minutes | 6 (3.4%) | 14 (12.7%) |
| 15 to 19 Minutes | 57 (32.2%) | 4 (3.6%) |
| 20 to 24 Minutes | 5 (2.8%) | 9 (8.2%) |
| 25 to 29 Minutes | 0 (0.0%) | 0 (0.0%) |
| 30 to 34 Minutes | 26 (14.7%) | 7 (6.4%) |
| 35 to 39 Minutes | 0 (0.0%) | 0 (0.0%) |
| 40 to 44 Minutes | 16 (9.0%) | 0 (0.0%) |
| 45 to 59 Minutes | 0 (0.0%) | 0 (0.0%) |
| 60 to 89 Minutes | 12 (6.8%) | 0 (0.0%) |
| 90 or more Minutes | 4 (2.3%) | 0 (0.0%) |
Time of Departure to Work by Sex in Castleton
The most frequent times of departure to work in Castleton are 6:00 AM to 6:29 AM (53, 29.9%) for males and 12:00 PM to 3:59 PM (36, 32.7%) for females.
| Time of Departure | Male | Female |
| 12:00 AM to 4:59 AM | 0 (0.0%) | 0 (0.0%) |
| 5:00 AM to 5:29 AM | 0 (0.0%) | 0 (0.0%) |
| 5:30 AM to 5:59 AM | 0 (0.0%) | 0 (0.0%) |
| 6:00 AM to 6:29 AM | 53 (29.9%) | 0 (0.0%) |
| 6:30 AM to 6:59 AM | 11 (6.2%) | 18 (16.4%) |
| 7:00 AM to 7:29 AM | 8 (4.5%) | 0 (0.0%) |
| 7:30 AM to 7:59 AM | 3 (1.7%) | 7 (6.4%) |
| 8:00 AM to 8:29 AM | 5 (2.8%) | 0 (0.0%) |
| 8:30 AM to 8:59 AM | 17 (9.6%) | 20 (18.2%) |
| 9:00 AM to 9:59 AM | 0 (0.0%) | 5 (4.5%) |
| 10:00 AM to 10:59 AM | 0 (0.0%) | 5 (4.5%) |
| 11:00 AM to 11:59 AM | 0 (0.0%) | 9 (8.2%) |
| 12:00 PM to 3:59 PM | 35 (19.8%) | 36 (32.7%) |
| 4:00 PM to 11:59 PM | 45 (25.4%) | 10 (9.1%) |
| Total | 177 (100.0%) | 110 (100.0%) |
Housing Occupancy in Castleton
Occupancy by Ownership in Castleton
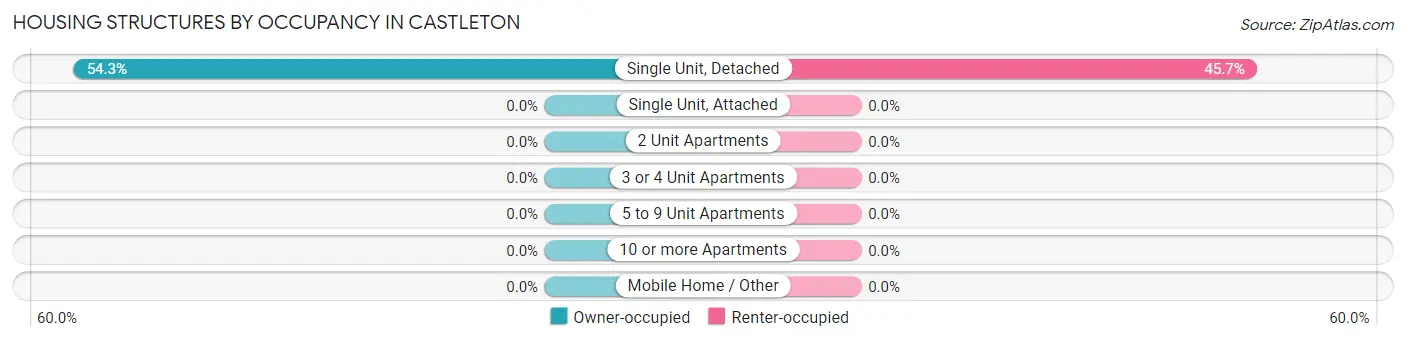
Of the total 81 dwellings in Castleton, owner-occupied units account for 44 (54.3%), while renter-occupied units make up 37 (45.7%).
| Occupancy | # Housing Units | % Housing Units |
| Owner Occupied Housing Units | 44 | 54.3% |
| Renter-Occupied Housing Units | 37 | 45.7% |
| Total Occupied Housing Units | 81 | 100.0% |
Occupancy by Household Size in Castleton
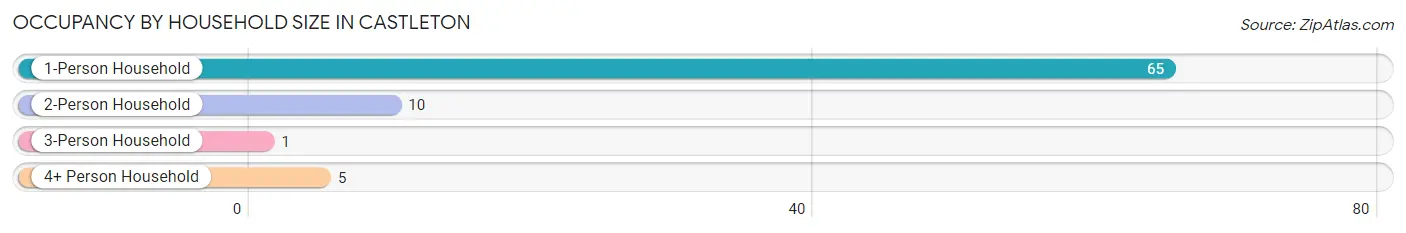
| Household Size | # Housing Units | % Housing Units |
| 1-Person Household | 65 | 80.2% |
| 2-Person Household | 10 | 12.3% |
| 3-Person Household | 1 | 1.2% |
| 4+ Person Household | 5 | 6.2% |
| Total Housing Units | 81 | 100.0% |
Occupancy by Ownership by Household Size in Castleton
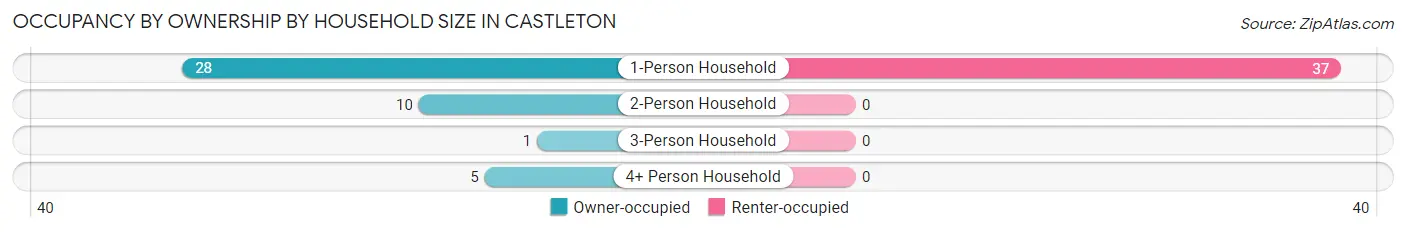
| Household Size | Owner-occupied | Renter-occupied |
| 1-Person Household | 28 (43.1%) | 37 (56.9%) |
| 2-Person Household | 10 (100.0%) | 0 (0.0%) |
| 3-Person Household | 1 (100.0%) | 0 (0.0%) |
| 4+ Person Household | 5 (100.0%) | 0 (0.0%) |
| Total Housing Units | 44 (54.3%) | 37 (45.7%) |
Occupancy by Educational Attainment in Castleton
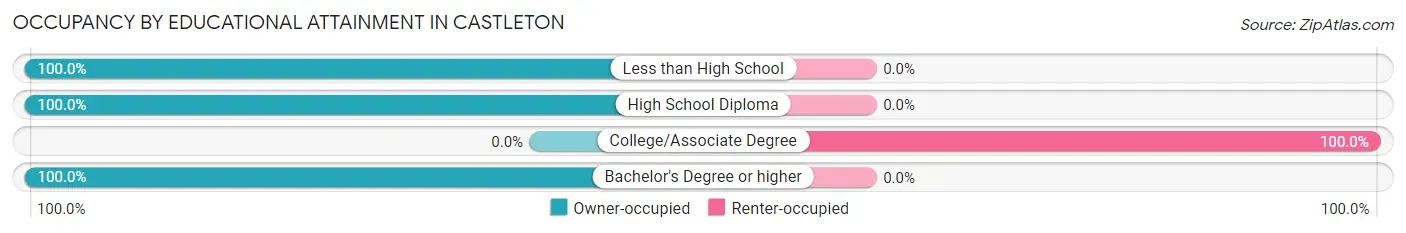
| Household Size | Owner-occupied | Renter-occupied |
| Less than High School | 1 (100.0%) | 0 (0.0%) |
| High School Diploma | 10 (100.0%) | 0 (0.0%) |
| College/Associate Degree | 0 (0.0%) | 37 (100.0%) |
| Bachelor's Degree or higher | 33 (100.0%) | 0 (0.0%) |
Occupancy by Age of Householder in Castleton
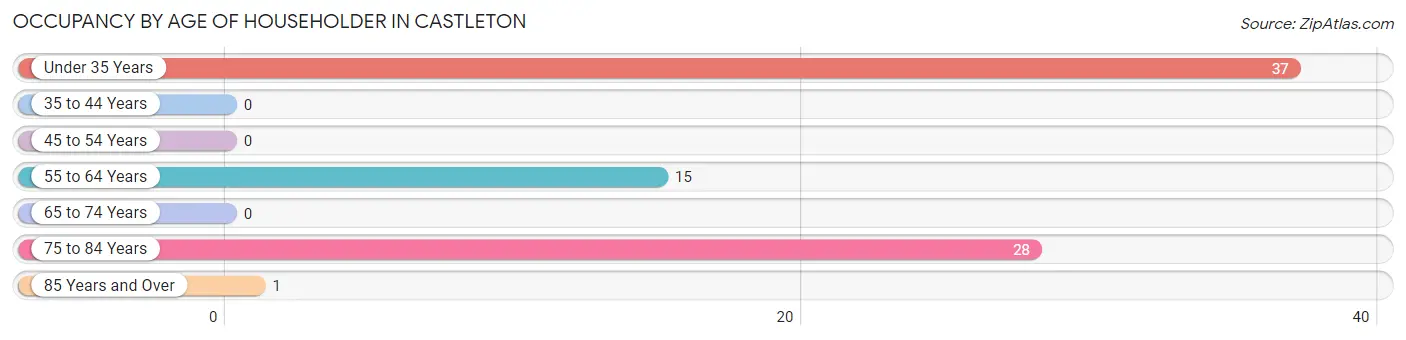
| Age Bracket | # Households | % Households |
| Under 35 Years | 37 | 45.7% |
| 35 to 44 Years | 0 | 0.0% |
| 45 to 54 Years | 0 | 0.0% |
| 55 to 64 Years | 15 | 18.5% |
| 65 to 74 Years | 0 | 0.0% |
| 75 to 84 Years | 28 | 34.6% |
| 85 Years and Over | 1 | 1.2% |
| Total | 81 | 100.0% |
Housing Finances in Castleton
Median Income by Occupancy in Castleton
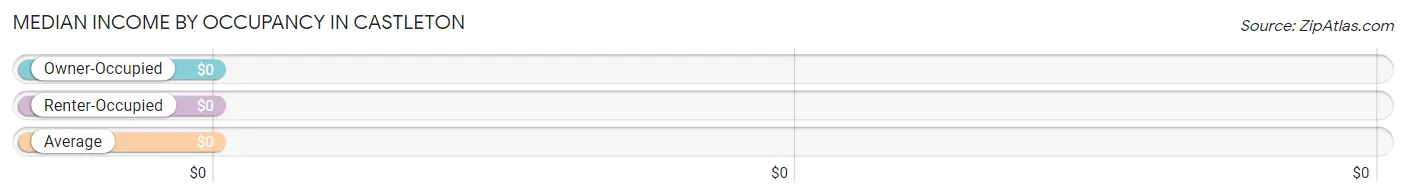
| Occupancy Type | # Households | Median Income |
| Owner-Occupied | 44 (54.3%) | $0 |
| Renter-Occupied | 37 (45.7%) | $0 |
| Average | 81 (100.0%) | $0 |
Occupancy by Householder Income Bracket in Castleton
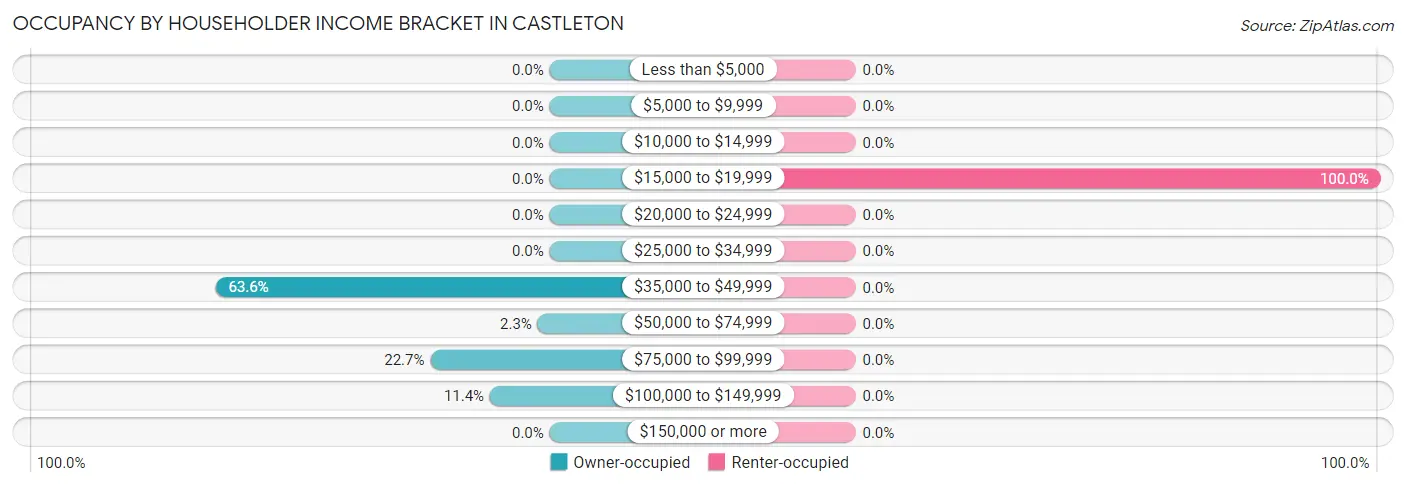
| Income Bracket | Owner-occupied | Renter-occupied |
| Less than $5,000 | 0 (0.0%) | 0 (0.0%) |
| $5,000 to $9,999 | 0 (0.0%) | 0 (0.0%) |
| $10,000 to $14,999 | 0 (0.0%) | 0 (0.0%) |
| $15,000 to $19,999 | 0 (0.0%) | 37 (100.0%) |
| $20,000 to $24,999 | 0 (0.0%) | 0 (0.0%) |
| $25,000 to $34,999 | 0 (0.0%) | 0 (0.0%) |
| $35,000 to $49,999 | 28 (63.6%) | 0 (0.0%) |
| $50,000 to $74,999 | 1 (2.3%) | 0 (0.0%) |
| $75,000 to $99,999 | 10 (22.7%) | 0 (0.0%) |
| $100,000 to $149,999 | 5 (11.4%) | 0 (0.0%) |
| $150,000 or more | 0 (0.0%) | 0 (0.0%) |
| Total | 44 (100.0%) | 37 (100.0%) |
Monthly Housing Cost Tiers in Castleton
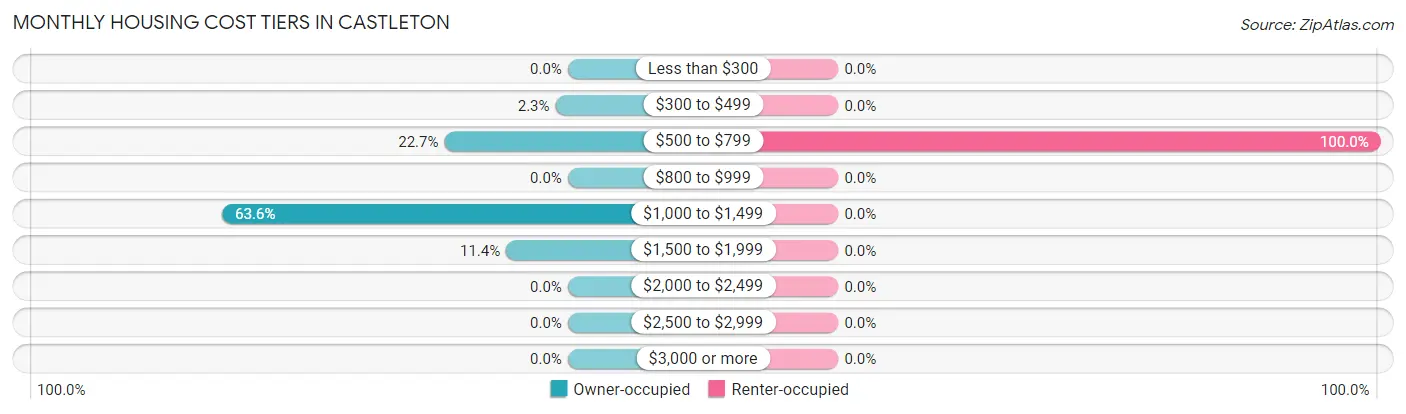
| Monthly Cost | Owner-occupied | Renter-occupied |
| Less than $300 | 0 (0.0%) | 0 (0.0%) |
| $300 to $499 | 1 (2.3%) | 0 (0.0%) |
| $500 to $799 | 10 (22.7%) | 37 (100.0%) |
| $800 to $999 | 0 (0.0%) | 0 (0.0%) |
| $1,000 to $1,499 | 28 (63.6%) | 0 (0.0%) |
| $1,500 to $1,999 | 5 (11.4%) | 0 (0.0%) |
| $2,000 to $2,499 | 0 (0.0%) | 0 (0.0%) |
| $2,500 to $2,999 | 0 (0.0%) | 0 (0.0%) |
| $3,000 or more | 0 (0.0%) | 0 (0.0%) |
| Total | 44 (100.0%) | 37 (100.0%) |
Physical Housing Characteristics in Castleton
Housing Structures in Castleton
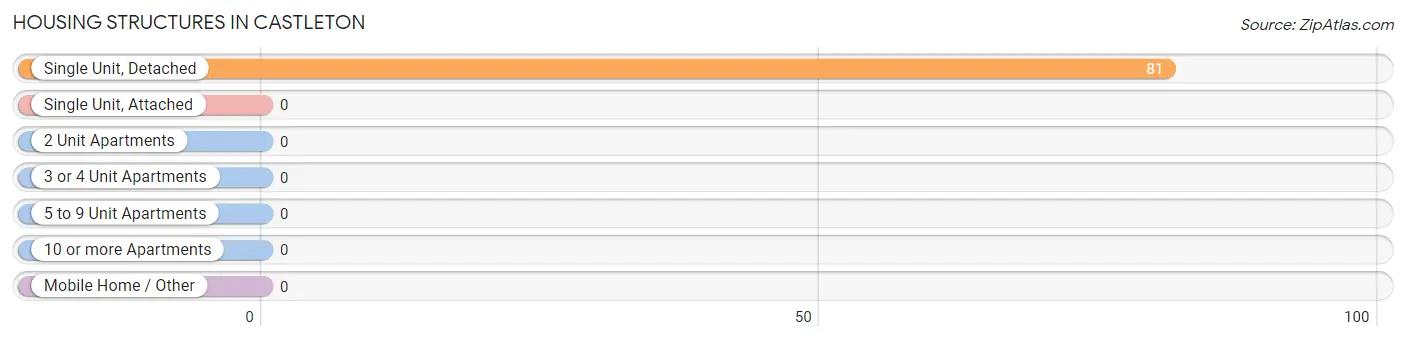
| Structure Type | # Housing Units | % Housing Units |
| Single Unit, Detached | 81 | 100.0% |
| Single Unit, Attached | 0 | 0.0% |
| 2 Unit Apartments | 0 | 0.0% |
| 3 or 4 Unit Apartments | 0 | 0.0% |
| 5 to 9 Unit Apartments | 0 | 0.0% |
| 10 or more Apartments | 0 | 0.0% |
| Mobile Home / Other | 0 | 0.0% |
| Total | 81 | 100.0% |
Housing Structures by Occupancy in Castleton
| Structure Type | Owner-occupied | Renter-occupied |
| Single Unit, Detached | 44 (54.3%) | 37 (45.7%) |
| Single Unit, Attached | 0 (0.0%) | 0 (0.0%) |
| 2 Unit Apartments | 0 (0.0%) | 0 (0.0%) |
| 3 or 4 Unit Apartments | 0 (0.0%) | 0 (0.0%) |
| 5 to 9 Unit Apartments | 0 (0.0%) | 0 (0.0%) |
| 10 or more Apartments | 0 (0.0%) | 0 (0.0%) |
| Mobile Home / Other | 0 (0.0%) | 0 (0.0%) |
| Total | 44 (54.3%) | 37 (45.7%) |
Housing Structures by Number of Rooms in Castleton
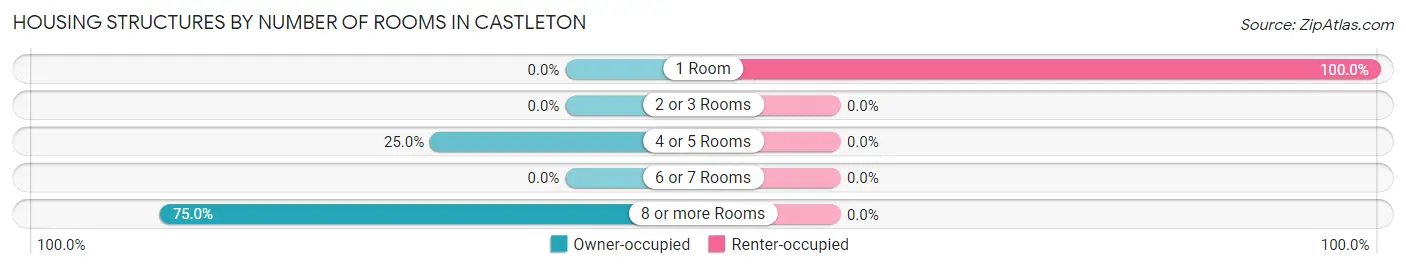
| Number of Rooms | Owner-occupied | Renter-occupied |
| 1 Room | 0 (0.0%) | 37 (100.0%) |
| 2 or 3 Rooms | 0 (0.0%) | 0 (0.0%) |
| 4 or 5 Rooms | 11 (25.0%) | 0 (0.0%) |
| 6 or 7 Rooms | 0 (0.0%) | 0 (0.0%) |
| 8 or more Rooms | 33 (75.0%) | 0 (0.0%) |
| Total | 44 (100.0%) | 37 (100.0%) |
Housing Structure by Heating Type in Castleton
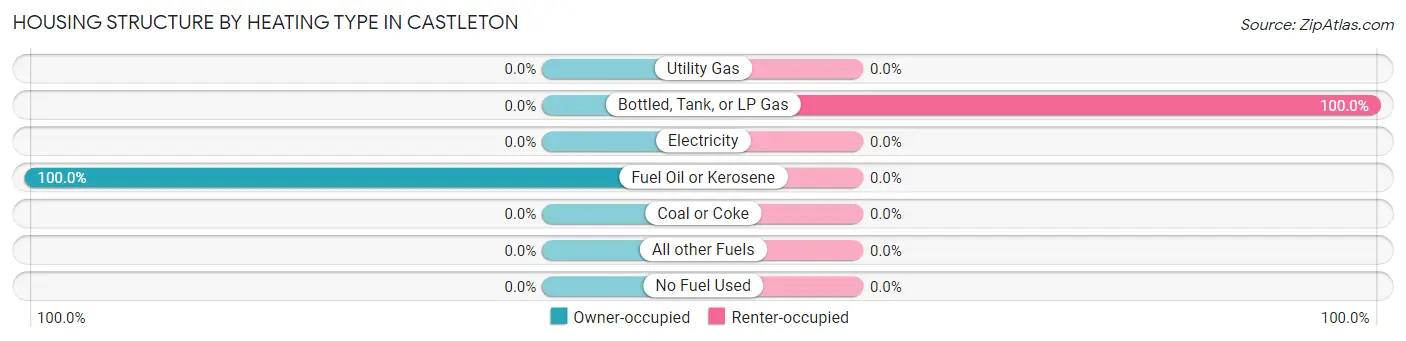
| Heating Type | Owner-occupied | Renter-occupied |
| Utility Gas | 0 (0.0%) | 0 (0.0%) |
| Bottled, Tank, or LP Gas | 0 (0.0%) | 37 (100.0%) |
| Electricity | 0 (0.0%) | 0 (0.0%) |
| Fuel Oil or Kerosene | 44 (100.0%) | 0 (0.0%) |
| Coal or Coke | 0 (0.0%) | 0 (0.0%) |
| All other Fuels | 0 (0.0%) | 0 (0.0%) |
| No Fuel Used | 0 (0.0%) | 0 (0.0%) |
| Total | 44 (100.0%) | 37 (100.0%) |
Household Vehicle Usage in Castleton
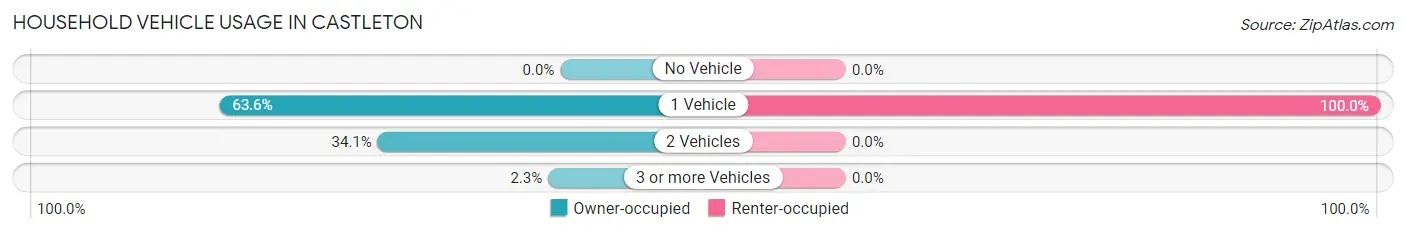
| Vehicles per Household | Owner-occupied | Renter-occupied |
| No Vehicle | 0 (0.0%) | 0 (0.0%) |
| 1 Vehicle | 28 (63.6%) | 37 (100.0%) |
| 2 Vehicles | 15 (34.1%) | 0 (0.0%) |
| 3 or more Vehicles | 1 (2.3%) | 0 (0.0%) |
| Total | 44 (100.0%) | 37 (100.0%) |
Real Estate & Mortgages in Castleton
Real Estate and Mortgage Overview in Castleton
| Characteristic | Without Mortgage | With Mortgage |
| Housing Units | 39 | 5 |
| Median Property Value | $265,200 | $0 |
| Median Household Income | - | - |
| Monthly Housing Costs | $1,030 | $0 |
| Real Estate Taxes | $2,661 | $0 |
Property Value by Mortgage Status in Castleton
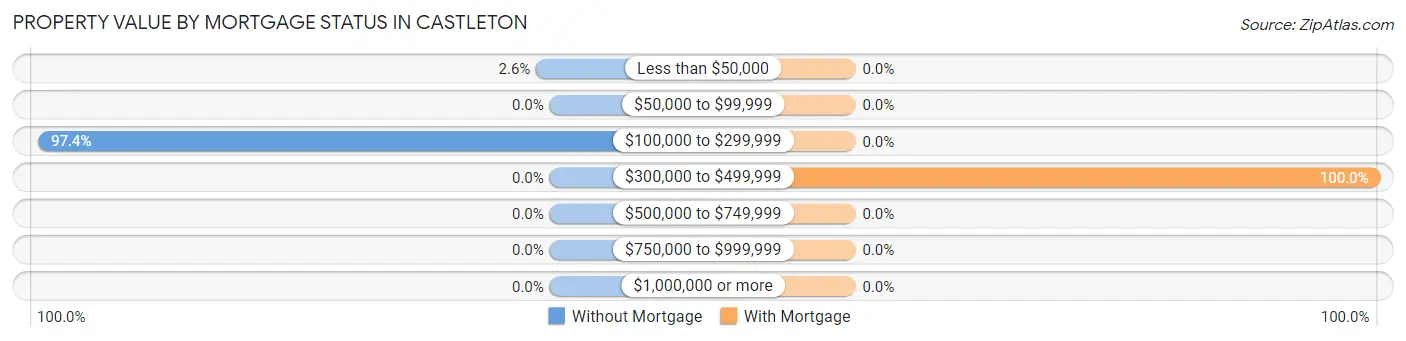
| Property Value | Without Mortgage | With Mortgage |
| Less than $50,000 | 1 (2.6%) | 0 (0.0%) |
| $50,000 to $99,999 | 0 (0.0%) | 0 (0.0%) |
| $100,000 to $299,999 | 38 (97.4%) | 0 (0.0%) |
| $300,000 to $499,999 | 0 (0.0%) | 5 (100.0%) |
| $500,000 to $749,999 | 0 (0.0%) | 0 (0.0%) |
| $750,000 to $999,999 | 0 (0.0%) | 0 (0.0%) |
| $1,000,000 or more | 0 (0.0%) | 0 (0.0%) |
| Total | 39 (100.0%) | 5 (100.0%) |
Household Income by Mortgage Status in Castleton
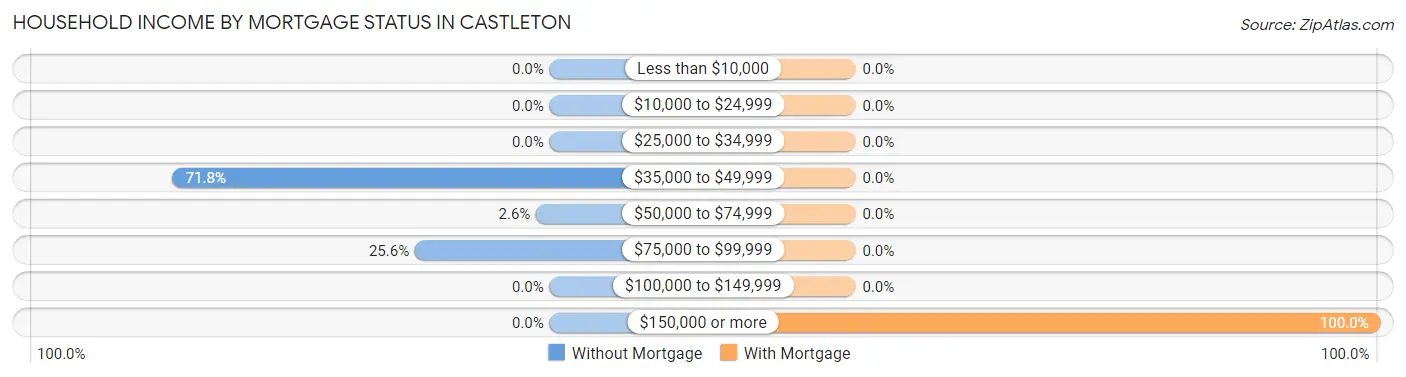
| Household Income | Without Mortgage | With Mortgage |
| Less than $10,000 | 0 (0.0%) | 0 (0.0%) |
| $10,000 to $24,999 | 0 (0.0%) | 0 (0.0%) |
| $25,000 to $34,999 | 0 (0.0%) | 0 (0.0%) |
| $35,000 to $49,999 | 28 (71.8%) | 0 (0.0%) |
| $50,000 to $74,999 | 1 (2.6%) | 0 (0.0%) |
| $75,000 to $99,999 | 10 (25.6%) | 0 (0.0%) |
| $100,000 to $149,999 | 0 (0.0%) | 0 (0.0%) |
| $150,000 or more | 0 (0.0%) | 5 (100.0%) |
| Total | 39 (100.0%) | 5 (100.0%) |
Property Value to Household Income Ratio in Castleton
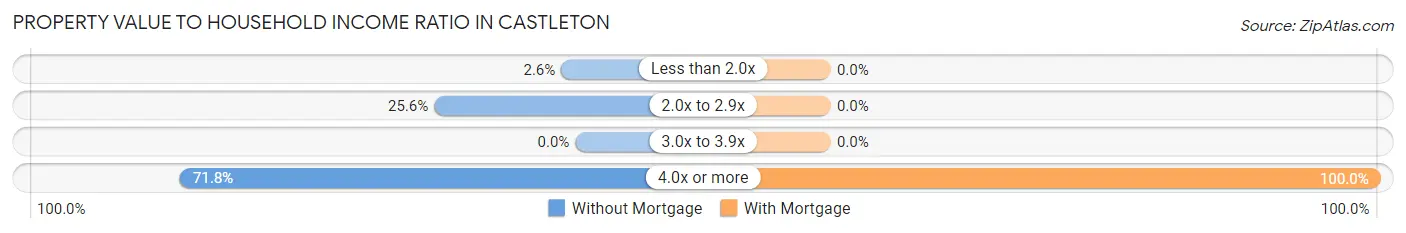
| Value-to-Income Ratio | Without Mortgage | With Mortgage |
| Less than 2.0x | 1 (2.6%) | 0 (0.0%) |
| 2.0x to 2.9x | 10 (25.6%) | 0 (0.0%) |
| 3.0x to 3.9x | 0 (0.0%) | 0 (0.0%) |
| 4.0x or more | 28 (71.8%) | 5 (100.0%) |
| Total | 39 (100.0%) | 5 (100.0%) |
Real Estate Taxes by Mortgage Status in Castleton
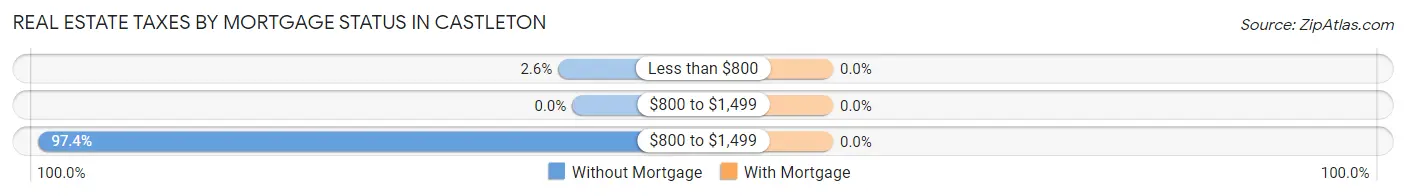
| Property Taxes | Without Mortgage | With Mortgage |
| Less than $800 | 1 (2.6%) | 0 (0.0%) |
| $800 to $1,499 | 0 (0.0%) | 0 (0.0%) |
| $800 to $1,499 | 38 (97.4%) | 0 (0.0%) |
| Total | 39 (100.0%) | 5 (100.0%) |
Health & Disability in Castleton
Health Insurance Coverage by Age in Castleton
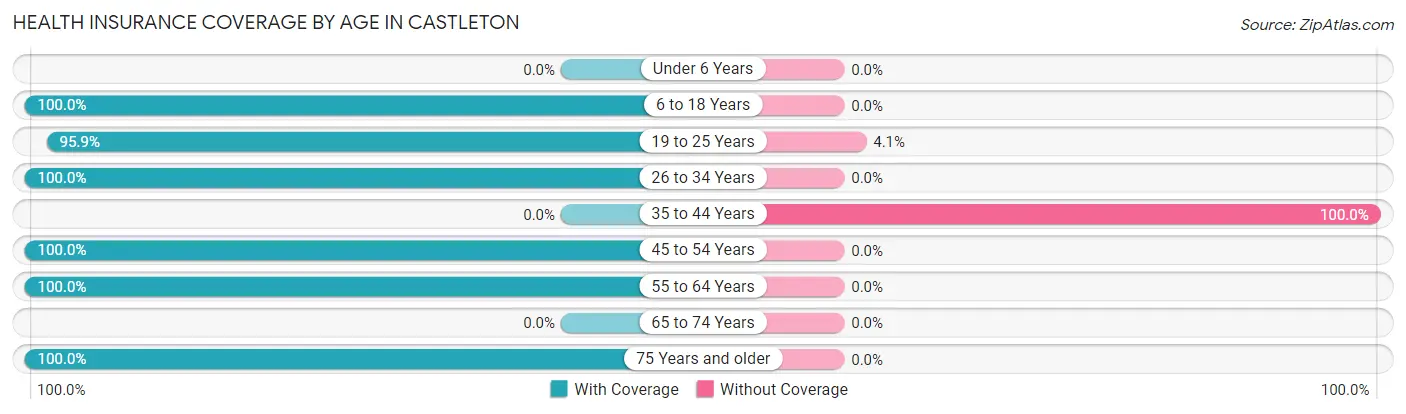
| Age Bracket | With Coverage | Without Coverage |
| Under 6 Years | 0 (0.0%) | 0 (0.0%) |
| 6 to 18 Years | 177 (100.0%) | 0 (0.0%) |
| 19 to 25 Years | 538 (95.9%) | 23 (4.1%) |
| 26 to 34 Years | 57 (100.0%) | 0 (0.0%) |
| 35 to 44 Years | 0 (0.0%) | 18 (100.0%) |
| 45 to 54 Years | 21 (100.0%) | 0 (0.0%) |
| 55 to 64 Years | 37 (100.0%) | 0 (0.0%) |
| 65 to 74 Years | 0 (0.0%) | 0 (0.0%) |
| 75 Years and older | 34 (100.0%) | 0 (0.0%) |
| Total | 864 (95.5%) | 41 (4.5%) |
Health Insurance Coverage by Citizenship Status in Castleton
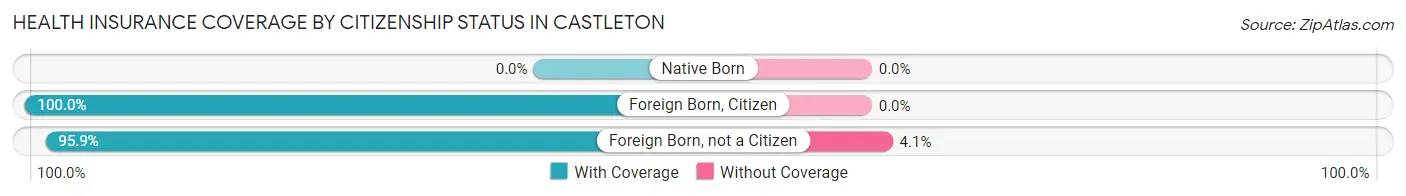
| Citizenship Status | With Coverage | Without Coverage |
| Native Born | 0 (0.0%) | 0 (0.0%) |
| Foreign Born, Citizen | 177 (100.0%) | 0 (0.0%) |
| Foreign Born, not a Citizen | 538 (95.9%) | 23 (4.1%) |
Health Insurance Coverage by Household Income in Castleton
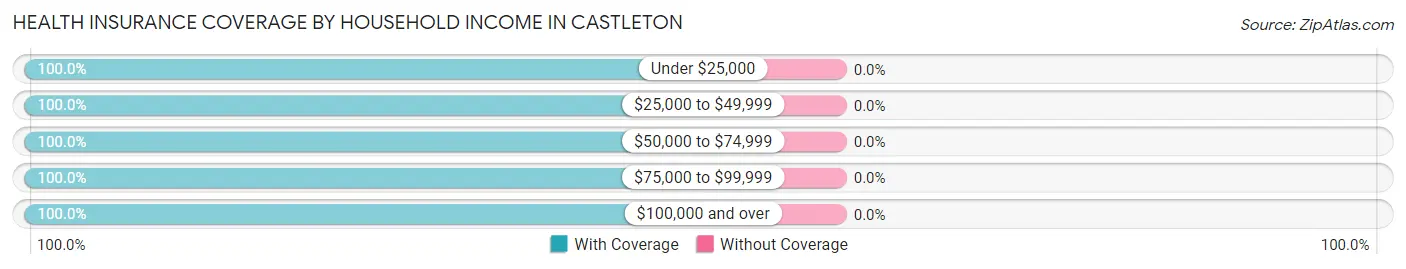
| Household Income | With Coverage | Without Coverage |
| Under $25,000 | 37 (100.0%) | 0 (0.0%) |
| $25,000 to $49,999 | 28 (100.0%) | 0 (0.0%) |
| $50,000 to $74,999 | 22 (100.0%) | 0 (0.0%) |
| $75,000 to $99,999 | 21 (100.0%) | 0 (0.0%) |
| $100,000 and over | 22 (100.0%) | 0 (0.0%) |
Public vs Private Health Insurance Coverage by Age in Castleton
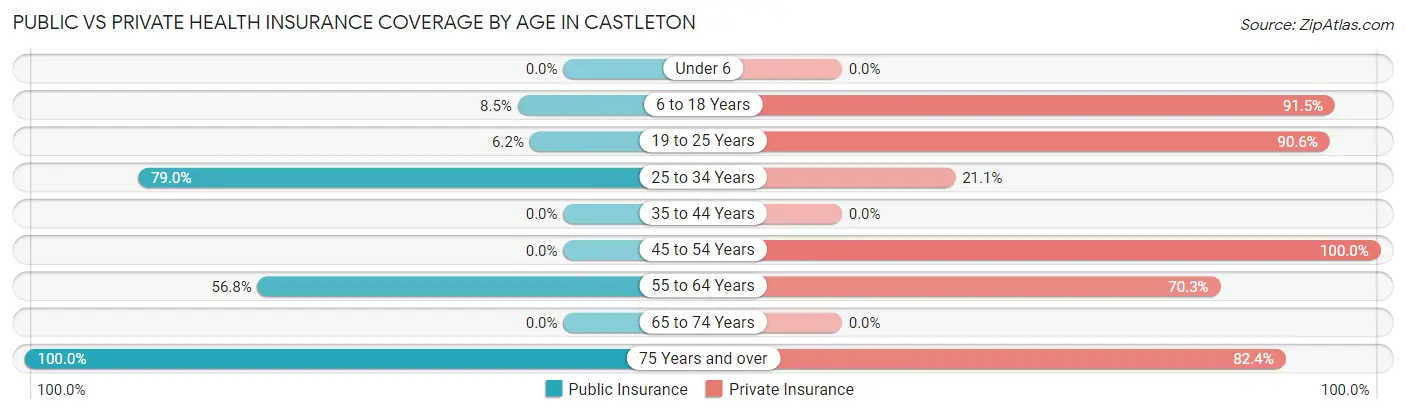
| Age Bracket | Public Insurance | Private Insurance |
| Under 6 | 0 (0.0%) | 0 (0.0%) |
| 6 to 18 Years | 15 (8.5%) | 162 (91.5%) |
| 19 to 25 Years | 35 (6.2%) | 508 (90.5%) |
| 25 to 34 Years | 45 (78.9%) | 12 (21.0%) |
| 35 to 44 Years | 0 (0.0%) | 0 (0.0%) |
| 45 to 54 Years | 0 (0.0%) | 21 (100.0%) |
| 55 to 64 Years | 21 (56.8%) | 26 (70.3%) |
| 65 to 74 Years | 0 (0.0%) | 0 (0.0%) |
| 75 Years and over | 34 (100.0%) | 28 (82.4%) |
| Total | 150 (16.6%) | 757 (83.7%) |
Disability Status by Sex by Age in Castleton
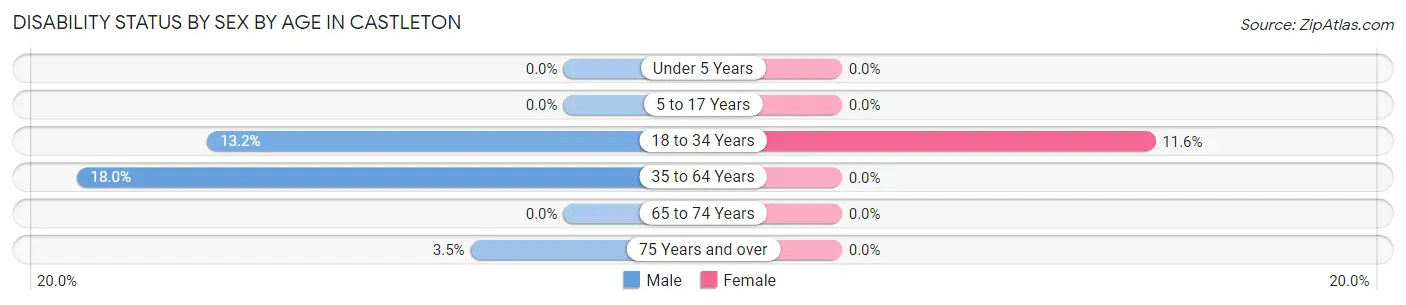
| Age Bracket | Male | Female |
| Under 5 Years | 0 (0.0%) | 0 (0.0%) |
| 5 to 17 Years | 0 (0.0%) | 0 (0.0%) |
| 18 to 34 Years | 64 (13.2%) | 34 (11.6%) |
| 35 to 64 Years | 11 (18.0%) | 0 (0.0%) |
| 65 to 74 Years | 0 (0.0%) | 0 (0.0%) |
| 75 Years and over | 1 (3.5%) | 0 (0.0%) |
Disability Class by Sex by Age in Castleton
Disability Class: Hearing Difficulty
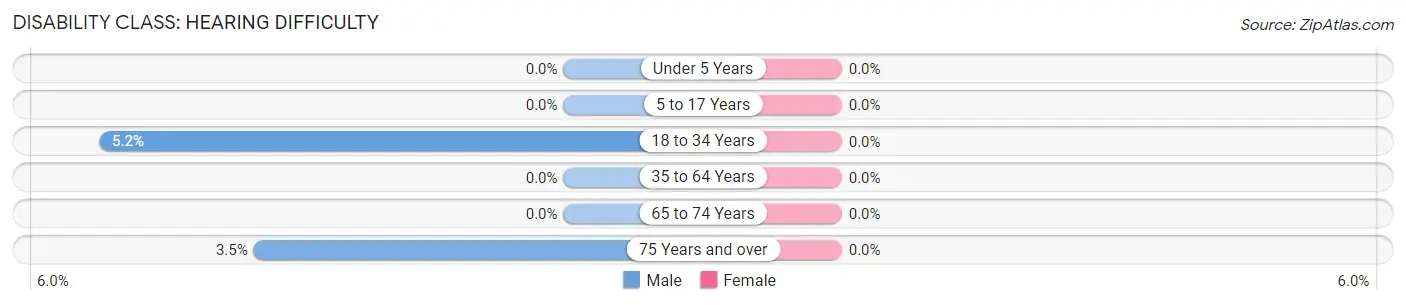
| Age Bracket | Male | Female |
| Under 5 Years | 0 (0.0%) | 0 (0.0%) |
| 5 to 17 Years | 0 (0.0%) | 0 (0.0%) |
| 18 to 34 Years | 25 (5.2%) | 0 (0.0%) |
| 35 to 64 Years | 0 (0.0%) | 0 (0.0%) |
| 65 to 74 Years | 0 (0.0%) | 0 (0.0%) |
| 75 Years and over | 1 (3.5%) | 0 (0.0%) |
Disability Class: Vision Difficulty
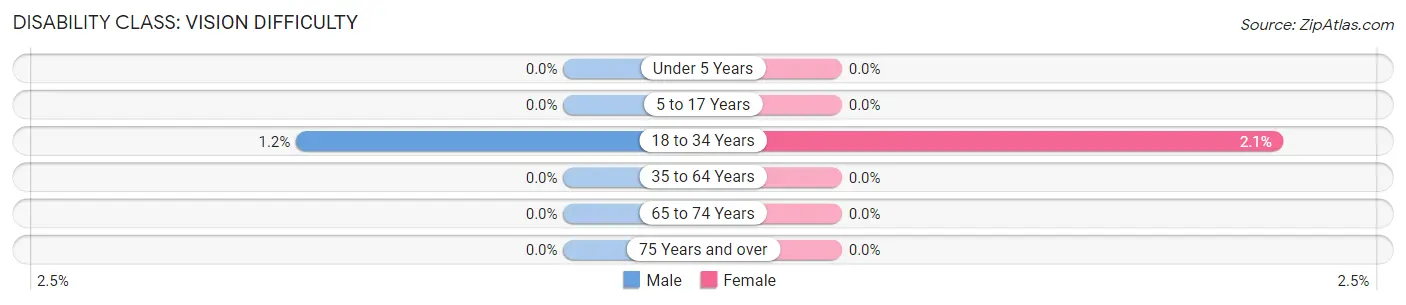
| Age Bracket | Male | Female |
| Under 5 Years | 0 (0.0%) | 0 (0.0%) |
| 5 to 17 Years | 0 (0.0%) | 0 (0.0%) |
| 18 to 34 Years | 6 (1.2%) | 6 (2.1%) |
| 35 to 64 Years | 0 (0.0%) | 0 (0.0%) |
| 65 to 74 Years | 0 (0.0%) | 0 (0.0%) |
| 75 Years and over | 0 (0.0%) | 0 (0.0%) |
Disability Class: Cognitive Difficulty
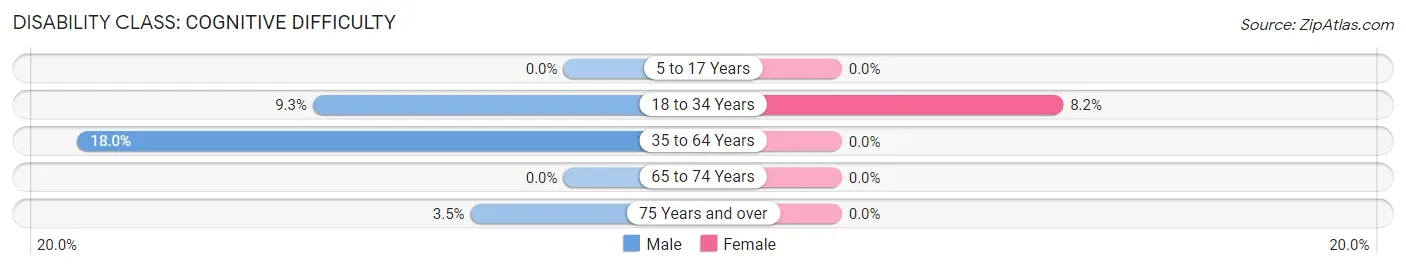
| Age Bracket | Male | Female |
| 5 to 17 Years | 0 (0.0%) | 0 (0.0%) |
| 18 to 34 Years | 45 (9.3%) | 24 (8.2%) |
| 35 to 64 Years | 11 (18.0%) | 0 (0.0%) |
| 65 to 74 Years | 0 (0.0%) | 0 (0.0%) |
| 75 Years and over | 1 (3.5%) | 0 (0.0%) |
Disability Class: Ambulatory Difficulty
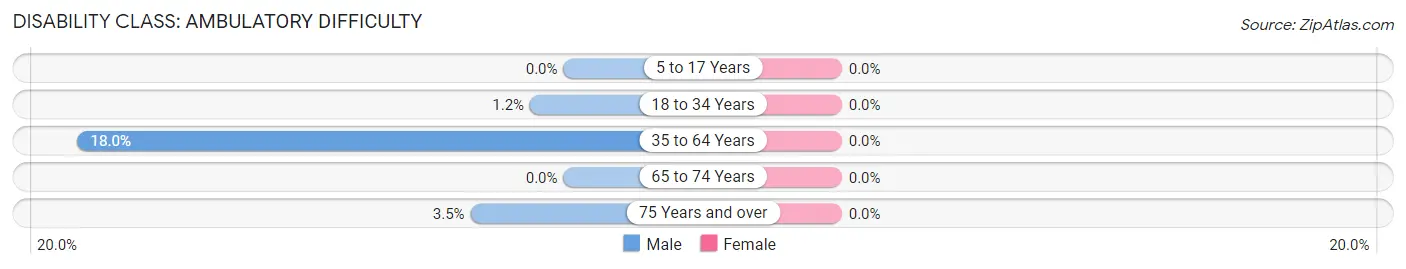
| Age Bracket | Male | Female |
| 5 to 17 Years | 0 (0.0%) | 0 (0.0%) |
| 18 to 34 Years | 6 (1.2%) | 0 (0.0%) |
| 35 to 64 Years | 11 (18.0%) | 0 (0.0%) |
| 65 to 74 Years | 0 (0.0%) | 0 (0.0%) |
| 75 Years and over | 1 (3.5%) | 0 (0.0%) |
Disability Class: Self-Care Difficulty
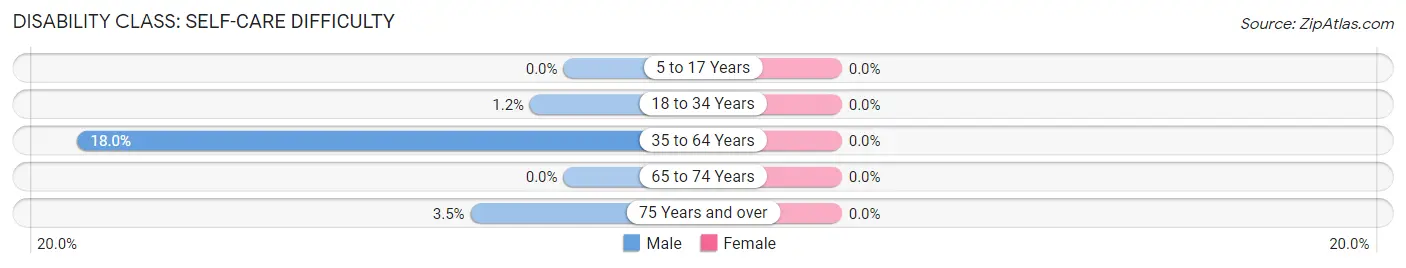
| Age Bracket | Male | Female |
| 5 to 17 Years | 0 (0.0%) | 0 (0.0%) |
| 18 to 34 Years | 6 (1.2%) | 0 (0.0%) |
| 35 to 64 Years | 11 (18.0%) | 0 (0.0%) |
| 65 to 74 Years | 0 (0.0%) | 0 (0.0%) |
| 75 Years and over | 1 (3.5%) | 0 (0.0%) |
Technology Access in Castleton
Computing Device Access in Castleton
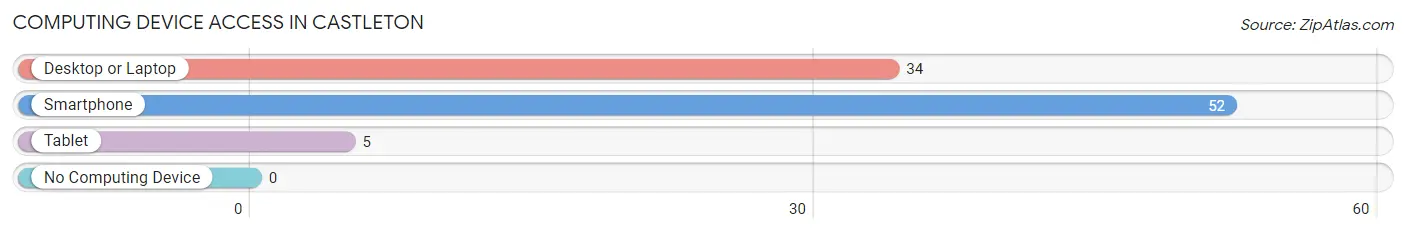
| Device Type | # Households | % Households |
| Desktop or Laptop | 34 | 42.0% |
| Smartphone | 52 | 64.2% |
| Tablet | 5 | 6.2% |
| No Computing Device | 0 | 0.0% |
| Total | 81 | 100.0% |
Internet Access in Castleton
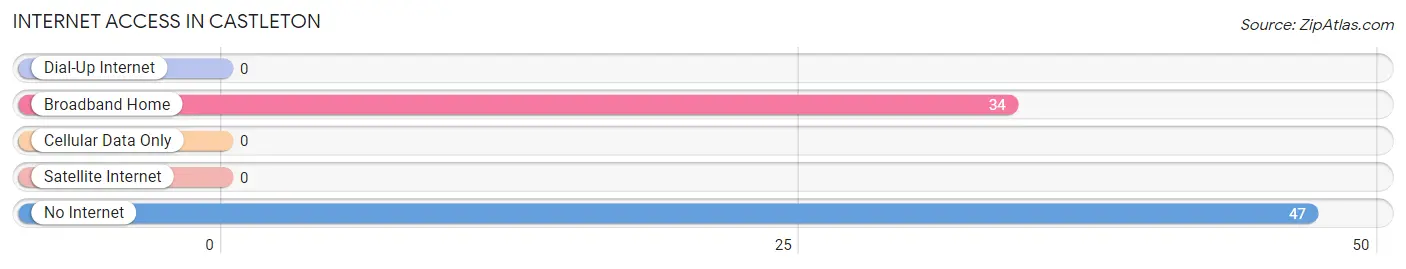
| Internet Type | # Households | % Households |
| Dial-Up Internet | 0 | 0.0% |
| Broadband Home | 34 | 42.0% |
| Cellular Data Only | 0 | 0.0% |
| Satellite Internet | 0 | 0.0% |
| No Internet | 47 | 58.0% |
| Total | 81 | 100.0% |
Castleton Summary
Castleton, Vermont is a small town located in the western part of the state, in Rutland County. It is situated on the banks of Lake Bomoseen, and is surrounded by the Green Mountains. The town was founded in 1761, and has a population of about 2,000 people.
History
Castleton was first settled in 1761 by a group of settlers from Connecticut. The town was named after the town of Castleton in England. The settlers were attracted to the area by the abundance of natural resources, including timber, water, and fertile soil. The town quickly grew, and by 1777 it had become the largest town in Rutland County.
In the early 19th century, Castleton was an important stop on the stagecoach route between Boston and Montreal. The town was also a major center for the production of iron ore, and the local economy was largely based on the iron industry.
In the late 19th century, the town began to decline as the iron industry declined. The town was also affected by the Great Depression, and many of the town’s residents left in search of work.
Geography
Castleton is located in the western part of Vermont, in Rutland County. The town is situated on the banks of Lake Bomoseen, and is surrounded by the Green Mountains. The town is located about 25 miles from the state capital of Montpelier.
The town has a total area of 8.3 square miles, of which 8.2 square miles is land and 0.1 square miles is water. The town is located at an elevation of 1,000 feet above sea level.
Economy
The economy of Castleton is largely based on tourism. The town is home to several popular attractions, including the Castleton State College, the Castleton Village Historic District, and the Castleton River. The town is also home to several small businesses, including restaurants, shops, and lodging.
The town is also home to several manufacturing companies, including a paper mill and a plastics factory. The town is also home to several farms, which produce dairy products, vegetables, and fruits.
Demographics
As of the 2010 census, the population of Castleton was 1,922. The racial makeup of the town was 97.2% White, 0.7% African American, 0.3% Native American, 0.3% Asian, 0.1% Pacific Islander, 0.2% from other races, and 1.3% from two or more races. Hispanic or Latino of any race were 1.3% of the population.
The median income for a household in the town was $45,000, and the median income for a family was $50,000. The per capita income for the town was $20,000. About 8.3% of families and 10.2% of the population were below the poverty line, including 11.3% of those under age 18 and 8.2% of those age 65 or over.
Common Questions
What is Per Capita Income in Castleton?
Per Capita income in Castleton is $7,916.
What is the Median Family Income in Castleton?
Median Family Income in Castleton is $81,750.
What is Income or Wage Gap in Castleton?
Income or Wage Gap in Castleton is 28.6%.
Women in Castleton earn 71.4 cents for every dollar earned by a man.
What is Inequality or Gini Index in Castleton?
Inequality or Gini Index in Castleton is 0.35.
What is the Total Population of Castleton?
Total Population of Castleton is 905.
What is the Total Male Population of Castleton?
Total Male Population of Castleton is 586.
What is the Total Female Population of Castleton?
Total Female Population of Castleton is 319.
What is the Ratio of Males per 100 Females in Castleton?
There are 183.70 Males per 100 Females in Castleton.
What is the Ratio of Females per 100 Males in Castleton?
There are 54.44 Females per 100 Males in Castleton.
What is the Median Population Age in Castleton?
Median Population Age in Castleton is 20.1 Years.
What is the Average Family Size in Castleton
Average Family Size in Castleton is 4.1 People.
What is the Average Household Size in Castleton
Average Household Size in Castleton is 1.6 People.
How Large is the Labor Force in Castleton?
There are 363 People in the Labor Forcein in Castleton.
What is the Percentage of People in the Labor Force in Castleton?
40.6% of People are in the Labor Force in Castleton.
What is the Unemployment Rate in Castleton?
Unemployment Rate in Castleton is 6.9%.